. 2016 May;79(5):794-805.
doi: 10.1002/ana.24630. Epub 2016 Apr 18.

In vivo imaging reveals rapid astrocyte depletion and axon damage in a model of neuromyelitis optica-related pathology

Affiliations

In vivo imaging reveals rapid astrocyte depletion and axon damage in a model of neuromyelitis optica-related pathology

Marina Herwerth et al. Ann Neurol. 2016 May.

Abstract

Objective: Neuromyelitis optica (NMO) is an autoimmune disease of the central nervous system, which resembles multiple sclerosis (MS). NMO differs from MS, however, in the distribution and histology of neuroinflammatory lesions and shows a more aggressive clinical course. Moreover, the majority of NMO patients carry immunoglobulin G autoantibodies against aquaporin-4 (AQP4), an astrocytic water channel. Antibodies against AQP4 can damage astrocytes by complement, but NMO histopathology also shows demyelination, and - importantly-axon injury, which may determine permanent deficits following NMO relapses. The dynamics of astrocyte injury in NMO and the mechanisms by which toxicity spreads to axons are not understood.

Methods: Here, we establish in vivo imaging of the spinal cord, one of the main sites of NMO pathology, as a powerful tool to study the formation of experimental NMO-related lesions caused by human AQP4 antibodies in mice.

Results: We found that human AQP4 antibodies caused acute astrocyte depletion with initial oligodendrocyte survival. Within 2 hours of antibody application, we observed secondary axon injury in the form of progressive swellings. Astrocyte toxicity and axon damage were dependent on AQP4 antibody titer and complement, specifically C1q.

Interpretation: In vivo imaging of the spinal cord reveals the swift development of NMO-related acute axon injury after AQP4 antibody-mediated astrocyte depletion. This approach will be useful in studying the mechanisms underlying the spread of NMO pathology beyond astrocytes, as well as in evaluating potential neuroprotective interventions. Ann Neurol 2016;79:794-805.


Figures

Figure 1
Figure 1
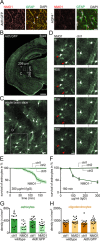
NMO patient‐derived samples contain AQP4‐Ig that stains and ablates mouse astrocytes in vitro and in vivo. (A) White matter spinal cord cryosections of Aldh1l1:GFP mice (Aldh:GFP, left; GFP not shown) and AQP4‐knockout‐mice (AQP4–/–, right), stained for astrocytes (GFAP, green), nuclei (DAPI, white), and with an AQP4‐Ig‐containing NMO sample (NMO1, red). (B) Confocal image of a fixed brain slice from an Aldh1l1‐GFP mouse. Box indicates the relative size of a typical time‐lapse area as magnified in (C). (C) Two‐photon image of astrocytes in an acute brain slice. Boxed area time‐lapsed in (D), left column. (D) Time‐lapse images taken from acute brain slices every 3 minutes for 3 hours, showing astrocytes (red arrowheads) that lose fluorescence and die in the presence of a heat‐inactivated AQP4‐Ig‐containing NMO sample (NMO1) and HD serum as a source of complement. A control serum (ctrl1) had no detectable effect under the same conditions. (E) Astrocyte survival over 180 minutes in acute brain slices in the presence of control sera from healthy subjects (ctrl1‐3) and an AQP4‐Ig‐containing NMO serum (NMO1, 300 μg/ml of IgG; n = 3 recordings for each sample; p < 0.0001, log‐rank test). (F) Dose‐response curve of astrocyte survival after 180 minutes for an AQP4‐IgG containing NMO (NMO1) and three control samples (n = 3 recordings for each sample; p = 0.0045, Mann–Whitney U test, NMO1 vs pooled ctrl1‐3 for 300‐μg/ml IgG concentration). HD serum (4%) as a source of complement was present in all recordings in (E) and (F). (G and H) Histopathological quantification of astrocyte (GFAP; G) and oligodendrocyte (Nogo‐A; H) densities in the superficial spinal cord of wild‐type and Aldh1l1:GFP mice after 180‐minute in vivo application of heat‐inactivated AQP4‐Ig‐containing NMO (NMO1) or a control sample (ctrl1) supplemented with HD serum into a laminectomy opening (n = 3 mice for each genotype/treatment combination; GFAP: wild‐type ctrl1 vs NMO1 p < 0.001; Aldh:GFP ctrl1 vs NMO1 p < 0.01; Nogo‐A: no significant differences, D'Agostino and Pearson's normality test, followed by analysis of variance and Holm‐Sidak's multiple comparisons test). Scale bars, 10 µm in (A), 500 µm in (B), 20 µm in (C), and 10 µm in (D). Data are presented as mean ± standard error of the mean. AQP4 = aquaporin‐4; DAPI = 4′,6‐diamidino‐2‐phenylindole; GFAP = glial fibrillary acidic protein; GFP = green fluorescent protein; HD = healthy donor; Ig = immunoglobulin; NMO = neuromyelitis optica.
Figure 2
Figure 2
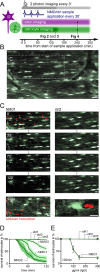
Human AQP4‐Ig samples induce rapid astrocyte pathology in the murine spinal cord in vivo. (A) Schematic sketch of the setup of the in vivo imaging experiment. Note that NMO and control samples were exchanged three times and replaced by aCSF after 90 minutes. (B) Overview of a typical imaging area in Aldh1l1:GFP mice (GFP, green) before application of NMO samples. Boxed area is followed by time lapse in (C), left column. (C) In vivo time‐lapse series of astrocytes (GFP, green) that lose fluorescence and die (red arrows) in the presence of a heat‐inactivated AQP4‐Ig‐containing NMO sample (NMO1) plus HD serum as complement source. Control serum (ctrl2) does not affect astrocytes under the same conditions. Bottom panel shows uptake of the cell death marker, ethidium homodimer (red), which was present during the in vivo recording, in astrocytes that lost fluorescence in response to AQP4‐Ig‐containing serum (boxed area is magnified to the right). (D) Percentage of surviving astrocytes in the presence (0–90 minutes) of control (ctrl) and AQP4‐Ig‐containing NMO samples (NMO) with HD serum as complement source (n = 3–5 recordings per sample; p < 0.001, for NMO1‐3 each tested vs ctrl1, log‐rank test; adjusted to 150 μg/ml for NMO and 300 μg/ml for ctrl samples). (E) Dose response of astrocyte loss as a function of total IgG concentration after 120 minutes for one NMO and several control samples (n = 3–5 recordings per sample, 100–300 μg/ml; n = 1–2 recordings for 0–75 μg/ml). All samples were complemented with the same amount of HD serum (p = 0.0045, for NMO1 vs pooled ctrl1‐3 for 300‐μg/ml concentration, Mann–Whitney U test). Scale bars, 20 µm in (B), 10 µm in (C). Data are presented as mean ± standard error of the mean. aCSF = artificial cerebrospinal fluid; AQP4 = aquaporin‐4; GFAP = glial fibrillary acidic protein; GFP = green fluorescent protein; HD = healthy donor; Ig = immunoglobulin; NMO = neuromyelitis optica.
Figure 3
Figure 3
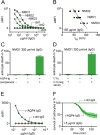
NMO‐related astrocyte pathology is AQP4‐Ig specific and complement dependent. (A) Titration of the NMO patient‐derived sera and control sera in an in vitro binding assay. Antibody titers in serum correspond to the difference in binding to an AQP4‐transduced cell line and a control cell line (delta median fluorescence intensity; ΔMFI). (B) Correlation between the AQP4‐Ig titer and the time when 50% astrocyte loss was reached (t50; 150 µg/ml). Mean values are presented as green data symbols. (C) Complement inactivation (complement –) or AQP4‐Ig depletion by an AQP4‐preabsorption column (AQP4 Ig–) abolishes the pathological effects on astrocytes caused by the AQP4‐Ig‐containing NMO1 sample. A preabsorption column without AQP4‐antigen has no effect (AQP4 IgG+; n = 2–5 for all conditions; p < 0.0001, log‐rank test). (D) C1q factor depletion (C1q neg serum+/C1q–) abolishes the pathological effects on astrocytes caused by the NMO1 sample. Resubstitution of purified C1q factor (20 µg/ml) reinstates the effect (C1q neg serum+/C1q+), whereas C1q alone has no effect (C1q neg serum–/C1q+; n = 3 for all conditions; p < 0.0001, log‐rank test). (E) Titration as in (A) of a recombinant AQP4 antibody (r‐AQP4‐IgG) and of a control antibody (r‐ctrl‐IgG). (F) Percent of surviving astrocytes in the presence of r‐AQP4‐IgG and r‐ctrl‐IgG (1.5 µg/ml; n ≥ 3 recordings for all conditions, p < 0.0001, log‐rank test). Data are presented as mean ± standard error of the mean. AQP4 = aquaporin‐4; HD = healthy donor; Ig = immunoglobulin; NMO = neuromyelitis optica.
Figure 4
Figure 4
AQP4‐antibody mediated astrocyte loss is followed by axonal pathology in vivo. (A) Time‐lapse imaging of the spinal cord in vivo (every 15 minutes for 6 hours) reveals axons that develop progressive swellings in the presence of an AQP4‐Ig‐containing sample (NMO2), whereas in the presence of a control sample (ctrl3), axons remain unaffected. (B) The same experiment as in (A), but without two‐photon imaging. Afterward, the tissue was fixed and images of the spinal cord were taken on a confocal microscope (axons, magenta; astrocytes, green) and quantitatively compared to imaged samples (same data as in C), as shown in the graph on the right (n = 3; p = 0.7, Mann–Whitney U test). (C) Percentage of swollen axons as a function of time using three different NMO patient‐derived AQP4‐Ig‐containing samples (NMO1‐3; 150 μg/ml) vs three control samples (ctrl1‐3; 300 μg/ml, n > 120 axons from three experiments for each sample; p < 0.0001, log‐rank test of NMO1‐3 individually vs ctrl1). (D) Example of concomitant quantification of astrocyte survival (green) and axonal swellings (magenta) in one recording using sample NMO2 complemented with HD serum, which were present from 0 to 90 minutes. (E) Correlation between survival of astrocytes and axonal swellings after 6 hours induced by the indicated AQP4‐Ig‐containing samples. Mean values are presented as magenta data symbols. (F) Analogous to Figure 3C, complement inactivation and AQP4‐Ig depletion abolish the pathological effects of NMO patient‐derived samples on axons (n = 2–3 for each condition; p < 0.0001, log‐rank test; 360 minutes). (G) Percentage of astrocyte survival (green) and axonal swellings (magenta) in the presence of the recombinant AQP4‐antibody ('r‐AQP4‐IgG'; 1.5 µg/ml, n > 125 axons, n = 3; p < 0.0001 compared to r‐ctrl‐IgG, data not shown, log‐rank test). Scale bars, 10 µm in A and B. Data are presented as mean ± standard error of the mean. AQP4 = aquaporin‐4; HD = healthy donor; Ig = immunoglobulin; NMO = neuromyelitis optica; OFP = orange fluorescent protein.

References

    1. Coleman MP, Perry VH. Axon pathology in neurological disease: a neglected therapeutic target. Trends Neurosci 2002;25:532–537. - PubMed
    1. Trapp BD, Peterson J, Ransohoff RM, et al. Axonal transection in the lesions of multiple sclerosis. N Engl J Med 1998;338:278–285. - PubMed
    1. Schirmer L, Antel JP, Brück W, Stadelmann C. Axonal loss and neurofilament phosphorylation changes accompany lesion development and clinical progression in multiple sclerosis. Brain Pathol 2011;21:428–440. - PMC - PubMed
    1. Wingerchuk DM, Lennon VA, Lucchinetti CF, et al. The spectrum of neuromyelitis optica. Lancet Neurol 2007;6:805–815. - PubMed
    1. Lennon VA, Wingerchuk DM, Kryzer TJ, et al. A serum autoantibody marker of neuromyelitis optica: distinction from multiple sclerosis. Lancet 2004;364:2106–2112. - PubMed

LinkOut - more resources