. 2016 Apr;241(7):755-65.
doi: 10.1177/1535370216636722. Epub 2016 Mar 4.

Original Research: Sickle cell anemia and pediatric strokes: Computational fluid dynamics analysis in the middle cerebral artery

Affiliations

Original Research: Sickle cell anemia and pediatric strokes: Computational fluid dynamics analysis in the middle cerebral artery

Christian P Rivera et al. Exp Biol Med (Maywood). 2016 Apr.

Abstract

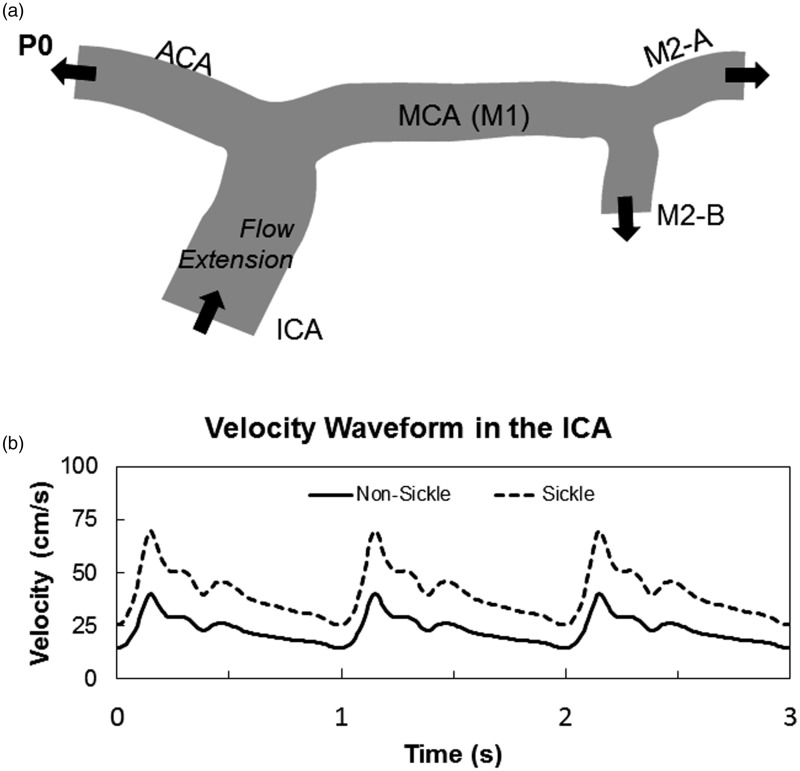
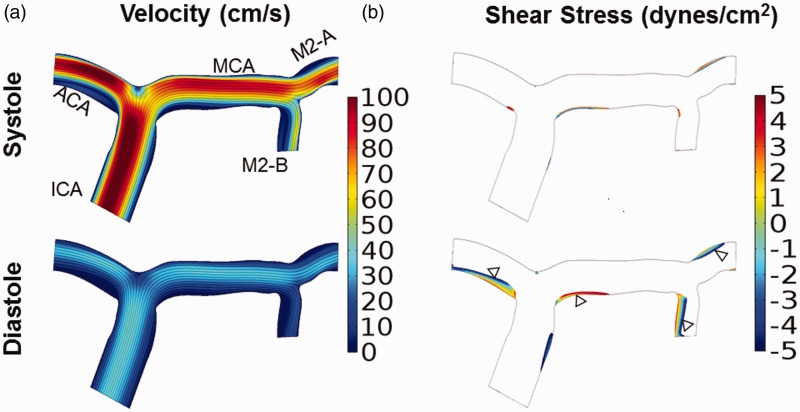
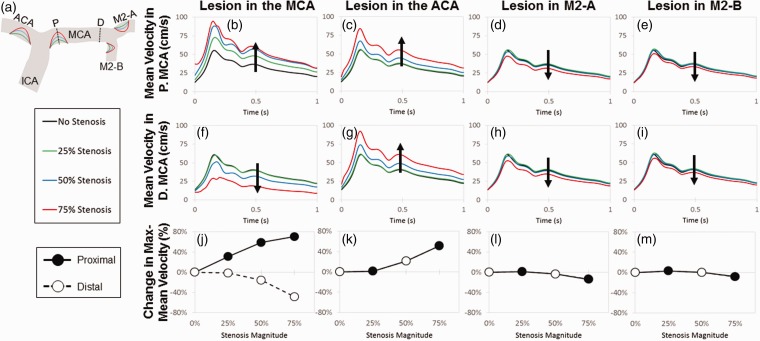
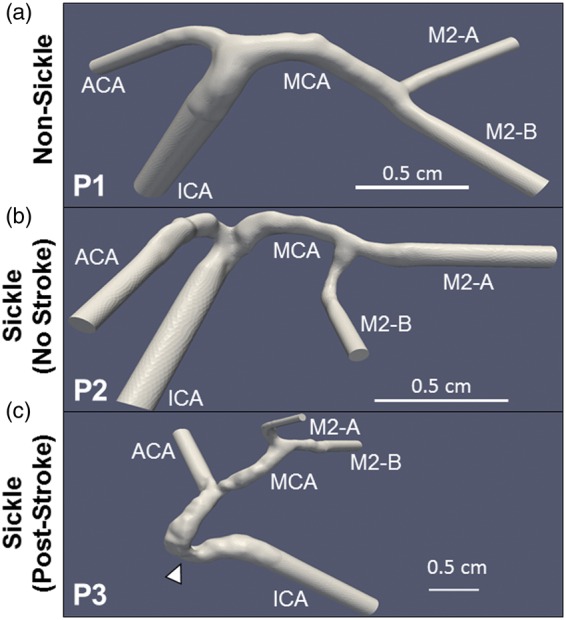
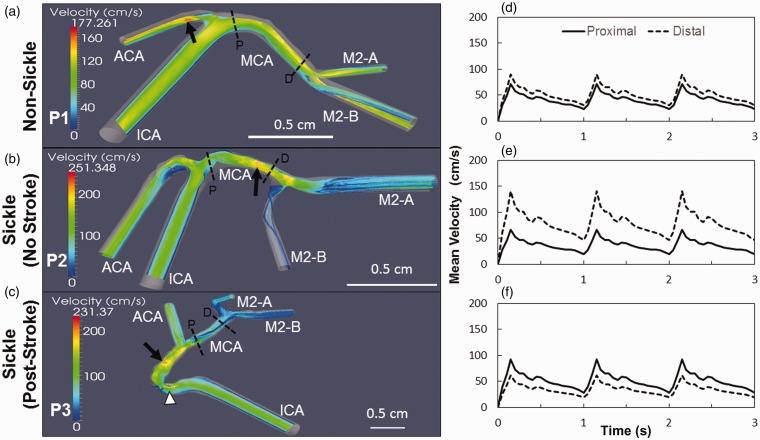
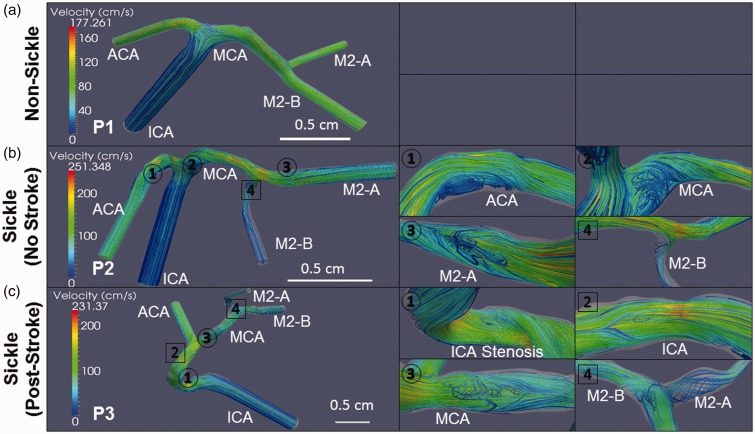
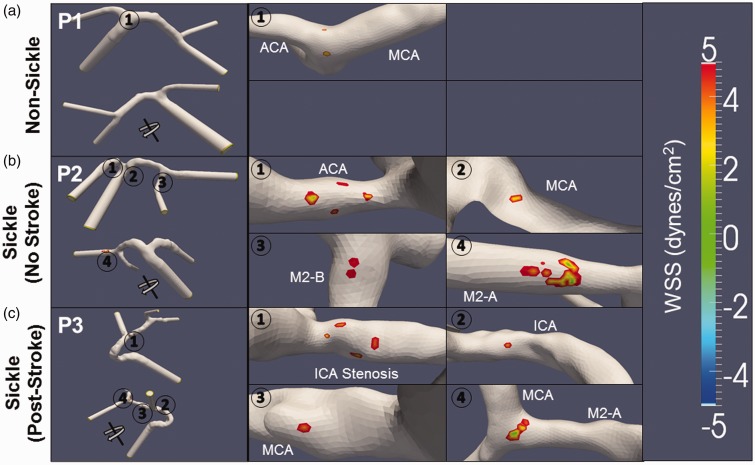
Children with sickle cell anemia (SCA) have a high incidence of strokes, and transcranial Doppler (TCD) identifies at-risk patients by measuring blood velocities in large intracerebral arteries; time-averaged mean velocities greater than 200 cm/s confer high stroke risk and warrant therapeutic intervention with blood transfusions. Our objective was to use computational fluid dynamics to alter fluid and artery wall properties, to simulate scenarios causative of significantly elevated arterial blood velocities. Two-dimensional simulations were created and increasing percent stenoses were created in silico, with their locations varied among middle cerebral artery (MCA), internal carotid artery (ICA), and anterior cerebral artery (ACA). Stenoses placed in the MCA, ICA, or ACA generated local increases in velocity, but not sufficient to reach magnitudes > 200 cm/s, even up to 75% stenosis. Three-dimensional reconstructions of the MCA, ICA, and ACA from children with SCA were generated from magnetic resonance angiograms. Using finite element method, blood flow was simulated with realistic velocity waveforms to the ICA inlet. Three-dimensional reconstructions revealed an uneven, internal arterial wall surface in children with SCA and higher mean velocities in the MCA up to 145 cm/s compared to non-SCA reconstructions. There were also greater areas of flow recirculation and larger regions of low wall shear stress. Taken together, these bumps on the internal wall of the cerebral arteries could create local flow disturbances that, in aggregate, could elevate blood velocities in SCA. Identifying cellular causes of these microstructures as adhered blood cells or luminal narrowing due to endothelial hyperplasia induced by disturbed flow would provide new targets to treat children with SCA. The preliminary qualitative results provided here point out the critical role of 3D reconstruction of patient-specific vascular geometries and provide qualitative insight to complex interplay between vascular geometry and rheological properties possibly altered by SCA.

Keywords: Shear stress; computational fluid dynamics; endothelium; hemodynamics; strokes.


Figures

Figure 1
Figure 1
Outline of two-dimensional cerebral artery model. A 2D representation of the MCA from a 71-year-old female subject was used for the two-dimensional simulation (a). Comparison velocity profiles over three cardiac cycles found in the ICA of SS and AA individuals. The elevated velocity profile caused by anemia in SCA was used as the inlet boundary condition for all simulations (b)
Figure 2
Figure 2
Elevated internal carotid artery velocities caused by sickle cell anemia does not generate velocities greater than 200 cm/s in the middle cerebral artery. Velocity and shear stress profiles were calculated for a 2-D arterial model with the TAMMV of the ICA inflow velocity set to those of a patient with SCA (70 cm/s). (a) Velocity during systole and diastole. Velocity was highest in the ICA and ACA, and the maximum velocity in the MCA did not exceed 90 cm/s. (b) Regions of low wall shear stress during systole and diastole are depicted with a maximum threshold of ± 5 dynes/cm2 . The affected regions correlate to regions with low velocities (a), and include the apex of the terminal end ICA bifurcation and inner curvature of bifurcations
Figure 3
Figure 3
A lesion at the entrance of the middle cerebral artery produces the largest difference in the proximal and distal velocities. Lesions of increasing size from 25% to 75% of the artery diameter were placed at the entrance of MCA, ACA, MCA-1, and MCA-2 (areas affected by low WSS) in order to produce stenotic lesions (a). Dotted lines represent slices where the mean velocity was measured in the proximal (top panel) and distal (middle panel) MCA. Mean velocity in the proximal MCA increased with lesion magnitude when narrowing occurred at the entrance of the MCA (b) and ACA (c). Lesions in M2-A and M2-B had a negligible effect on velocity, despite lesion magnitudes of 75% (d, e). In the distal end of the MCA, the mean velocity decreased with increasing MCA stenosis (f). Increasing the magnitude of the ACA lesion led to an increased velocity in the distal MCA (g), and stenoses in the M2-A and M2-B did not affect velocity (h, i), matching observations seen in the proximal MCA. In the bottom panel, percent change in the maximum mean velocity was calculated in respect to lesion magnitude and location. A lesion in the MCA entrance produced the greatest difference in percent change, increasing and decreasing in the proximal and distal MCA velocity, respectively (j). Lesions in the ACA, MCA-1, and MCA-2 entrances have the same effect on both the proximal and distal velocities (k–m)
Figure 4
Figure 4
Reconstructed geometries of sickle and non-sickle cerebral arteries. Three-dimensional models were generated from MRAs of one non-sickle subject (P1) (a) and two sickle patients: one with no history of stroke (P2) (b), and another post-stroke (P3) (c). The model of Patient 3’s artery is extended due a stenosis in the ICA (arrowhead). Scale bar is shown
Figure 5
Figure 5
Velocity profiles in the middle cerebral are elevated in individuals with sickle cell anemia. Slices of the velocity streamlines are depicted for the each subject during systole. The maximum velocity in the non-sickle patient (P1) is highest in the ACA (arrow), and the MCA presents a consistent profile that peaks at ∼150 cm/s (a). In the sickle patient with no stroke (P2), the velocity is highest in the MCA (arrow), increasing from the proximal to the distal end with a maximum speed of 251 cm/s (b). The sickle subject with a previous history of stroke (P3) has the highest velocity occurring along the ICA prior to the bifurcation (arrow) and at the stenosis (arrowhead). The maximum velocity in the MCA reaches approximately 180 cm/s at the proximal end and decreases towards the distal MCA bifurcation (c). The velocity in the MCA of P1 has the least variance with the velocity at the proximal and distal ends reaching 72 and 90 cm/s, respectively (d). The velocity profile in the MCA of P2 has the largest variance amongst all the subjects with velocity increasing from the proximal end at 66 cm/s to the distal end at the 141 cm/s (e). Subject P3 has its velocity in the MCA decrease from 92 cm/s at the proximal side to 61 cm/s at the distal end (f). Scale bar is shown
Figure 6
Figure 6
Recirculation of velocity streamlines is more prevalent in sickle cell anemia. Patient-specific velocity streamlines during systole are depicted for the 3-D vascular models with recirculations (circles) and vortexes (squares) magnified for easier viewing. The non-sickle subject’s (P1) artery is completely void of any regions of fluid recirculation (a). The first sickle subject (P2) has fluid recirculating at multiple locations near the inner curvature of bifurcations: specifically at the ACA (1), MCA (2), and M2-A (3) arterial segments. A vortex is also observed in the M2-B segment (4) (b). The second subject has recirculation occurring at the ICA stenosis (1), and the MCA (3) following the ICA bifurcation. Vortexes are observed along the ICA (2) and at the MCA bifurcation (4) (c). Scale bar is shown
Figure 7
Figure 7
Areas of low shear stress are greater in sickle cell anemia arteries. Low WSS (±5 dynes/cm2) during diastole were calculated from the velocity profiles of the non-sickle and sickle subjects. The locations of these low WSS (circles) are magnified in the images to the right for easier viewing. In the non-sickle subject (P1), two spots of low stress areas of low shear stress occur at the apex of the internal carotid bifurcation (1) (a). The sickle subject with no history of stroke (P2) has regions of low WSS occur along the inner curvature both bifurcations in the ACA (1), MCA (2), M2-B (3), and M2-A (4) (b). The second subject (P3) has multiple regions of low WSS. Two occur in the ICA, first at the stenosis (1) and then preceding the ICA bifurcation (2). Low shear areas also occur along the length of the MCA, one following the ICA bifurcation (3), and the other at the apex of the MCA bifurcation (4) (c)

References

    1. Hassell KL. Population estimates of sickle cell disease in the U.S. Am J Prev Med 2010; 38: S512–21. - PubMed
    1. Hillery C, Panepinto J. Pathophysiology of stroke in sickle cell disease. Microcirculation 2004; 11: 195–208. - PubMed
    1. DeBaun MR, Armstrong FD, McKinstry RC, Ware RE, Vichinsky E, Kirkham FJ. Silent cerebral infarcts: a review on a prevalent and progressive cause of neurologic injury in sickle cell anemia. Blood 2012; 119: 4587–96. - PMC - PubMed
    1. Adams RJ, Brambilla D. Optimizing primary stroke prevention in sickle cell anemia trial I. Discontinuing prophylactic transfusions used to prevent stroke in sickle cell disease. N Engl J Med 2005; 353: 2769–78. - PubMed
    1. Adams RJ, McKie VC, Hsu L, Files B, Vichinsky E, Pegelow C, Abboud M, Gallagher D, Kutlar A, Nichols FT, Bonds DR, Brambilla D. Prevention of a first stroke by transfusions in children with sickle cell anemia and abnormal results on transcranial Doppler ultrasonography. N Engl J Med 1998; 339: 5–11. - PubMed

Publication types