. 2016 Mar 15;14(10):2426-39.
doi: 10.1016/j.celrep.2016.02.040. Epub 2016 Mar 3.

Global Analysis of Cellular Protein Flux Quantifies the Selectivity of Basal Autophagy

Affiliations

Global Analysis of Cellular Protein Flux Quantifies the Selectivity of Basal Autophagy

Tian Zhang et al. Cell Rep. .

Abstract

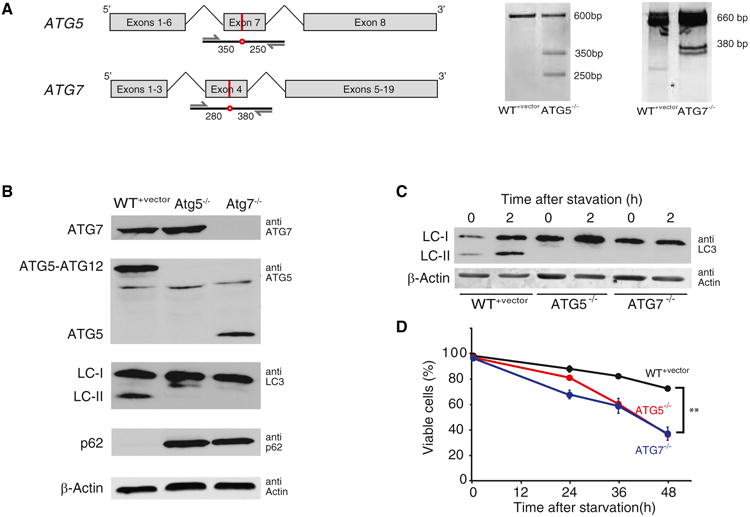
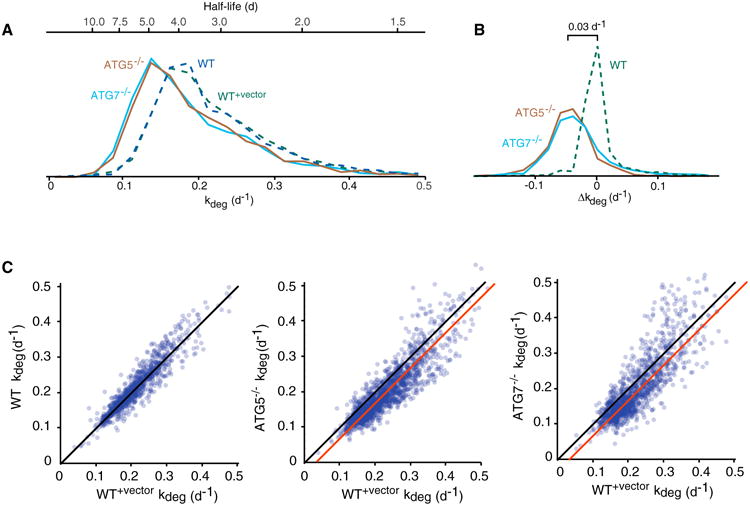
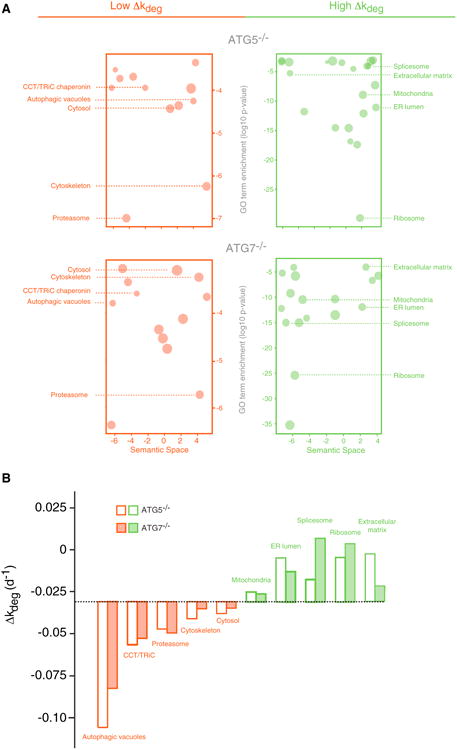
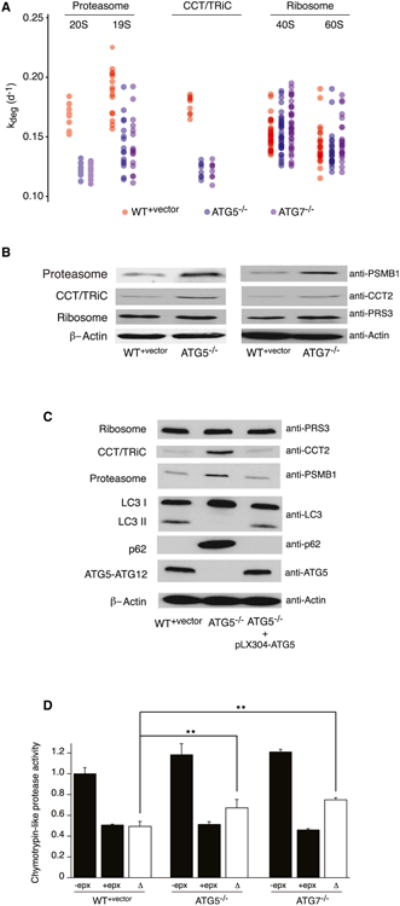
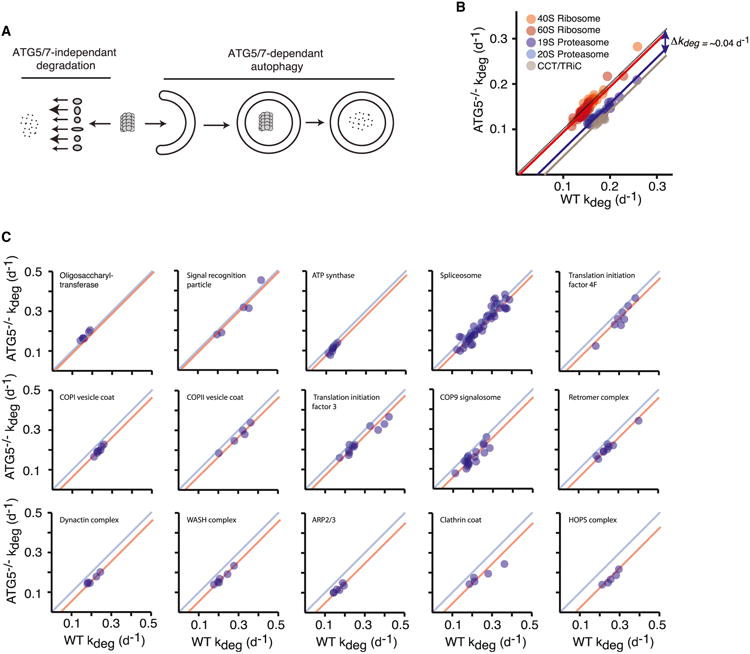
In eukaryotic cells, macroautophagy is a catabolic pathway implicated in the degradation of long-lived proteins and damaged organelles. Although it has been demonstrated that macroautophagy can selectively degrade specific targets, its contribution to the basal turnover of cellular proteins has not been quantified on proteome-wide scales. In this study, we created autophagy-deficient primary human fibroblasts and quantified the resulting changes in basal degradative flux by dynamic proteomics. Our results provide a global comparison of protein half-lives between wild-type and autophagy-deficient cells. The data indicate that in quiescent fibroblasts, macroautophagy contributes to the basal turnover of a substantial fraction of the proteome at varying levels. As contrasting examples, we demonstrate that the proteasome and CCT/TRiC chaperonin are robust substrates of basal autophagy, whereas the ribosome is largely protected under basal conditions. This selectivity may establish a proteostatic feedback mechanism that stabilizes the proteasome and CCT/TRiC when autophagy is inhibited.


Figures

Figure 1
Figure 1. Creation and Validation of Autophagy-Deficient Human Fibroblasts
(A) The schematics on the left are gene maps of human ATG5 and ATG7 showing the site of the introduced mutations (red line and circle) and the PCR strategy for amplifying the mutated genomic regions for the SURVEYOR assay. The numbers indicate the expected sizes of the mutated amplicon fragments after SURVEYOR nuclease cleavage. The right panel shows the results of the SURVEYOR assay indicating the introduction of mutations at expected genomic positions. (B)Western blots show the expression of ATG5, ATG7, LC3, p62, and β-actin control in WT+vector,ATG5−/, and ATG7−/ cells. The blots indicate that ATG5 and ATG7 are completely knocked out in HCA2-hTert cells. The deletion of ATG5 and ATG7 results in complete disappearance of LC3-II, and the deletion of ATG7 prevents the conjugation of ATG5 to ATG12. The basal level of p62 is significantly elevated in ATG5−/ and ATG7−/ cells. (C) LC3-II levels increase under starvation conditions in WT+vector, but not ATG5−/ and ATG7−/ cells. (D) ATG5−/ and ATG7−/ cells are more sensitive to amino acid starvation. Cell viabilities were measured after different periods of amino acid starvation. Each time point was measured in three replicate experiments, and the error bar indicates SD. n = 3 biological replicates; **p < 0.01. See also Figure S1.
Figure 2
Figure 2. Global Measurement of Degradation Rates by Isotopic Labeling and LC-MS/MS
(A) The schematic illustrates the experimental design. Cells were cultured in unlabeled (12C) media. Four days after reaching confluency, labeled (13C) media was added to the cells. During the following 6 days, cells were collected at different time points for LC-MS/MS analysis. (B) Isotopic labeling kinetics of p62-SQSTM1 and RPS11 are shown as example proteins. The spectra show the increase in fractional isotopic labeling of single peptides mapped to the two proteins. The unlabeled (“light”) spectra are shown in blue and the labeled (“heavy”) spectra are shown in red. Data from all peptides mapped to the proteins were combined and the kinetics of labeling were fitted to a first-order exponential equation to measure the degradation rate constant (kdeg) and half-life of each protein in the four genetic backgrounds. The scatterplots indicate the median of peptide measurements at different time points, and the error bars indicate the SD of all peptides mapped to each protein. (C) Numbers of peptides and proteins detected and quantified in the proteomic analyses. (D)Scatterplot indicating a comparison of measured fractional labeling of WT+vector proteins at 4 days for two biologically replicate experiments. See also Figures S2–S4.
Figure 3
Figure 3. Global Impact of Autophagy Impairment on Basal Degradation Rates
(A) Distribution of protein half-lives and degradation rates in WT, WT+vector, ATG5−/, and ATG7−/ cells. (B)Distribution of differences in degradation rates (Δkdeg) between WT+vector cells, and ATG5−/, ATG7−/, and WT cells. (C) Pairwise comparisons of protein degradation rates in WT, WT+vector, ATG5−/, and ATG7−/ cells. Black lines indicate identity lines, and red lines indicate best-fit lines to the proteome-wide data.
Figure 4
Figure 4. Degradation Kinetics of Proteins Belonging to Specific Cellular Component Gene Ontology Categories Are Differentially Impacted by the Inhibition of Autophagy
(A) Gene Ontology (GO) term enrichments of proteins with high (green) or low (red) Δkdeg values were organized based on semantic similarity and visualized by REViGO. × axis represents the semantic similarity between GO terms based on overlap of their constituent proteins, and y axis is the Benjamini-corrected p values of statistical significance for GO category enrichment; the symbol size is correlated to the number of proteins mapped to each GO term. (B) The median of Δkdeg values for proteins mapped to GO categories indicated in (A). See also Table S7 for a complete list of GO term enrichments and genes mapped to each term.
Figure 5
Figure 5. The Inhibition of Autophagy Impacts the Stability and Expression Levels of Protein Complexes Involved in Proteome Homeostasis
(A) Degradation rates of subunits of the ribosome, proteasome, and CCT/TRiC in WT+vector, ATG5-/- and ATG7-/- cells. (B) The proteasome and CCT/TRiC accumulate in autophagy-deficient cells while ribosome levels remain unchanged. (C) Re-expression of ATG5 in ATG5−/− cells restores autophagy and reduces expression levels of the proteasome and CCT/TRiC. (D) Autophagy-deficient cells have higher levels of proteasome activity in cell free assays (n = 5, **p < 0.01). See also Figure S5.
Figure 6
Figure 6. The Differential Impact of Autophagy Inhibition on Long-Lived and Short-Lived Proteins
(A) The average Δkdeg for subsets of proteins with varying degradation rates in ATG5−/− and ATG7−/− cells. The trend is consistent with the idea that the change in degradation rates of long-lived proteins is primarily due to reduced flux through the autophagy pathway whereas short-lived proteins may be de-stabilized due to increased proteasome levels. Bars indicate the mean of Δkdeg measurements for subsets of proteins with the indicated range of kdeg values, and error bars indicate SEM. (B) Steady-state SILAC analysis indicates that, as a group, relative expression levels of long-lived proteins are increased and relative expression levels of short-lived proteins are decreased in ATG5−/− and ATG7−/− cells. Bars indicate the mean of the log2 ratio of expression levels between ATG5−/− and WT+vector cells for subsets of proteins with the indicated range of kdeg values, and error bars indicate SEM.
Figure 7
Figure 7. Subunits of Protein Complexes Are Degraded as a Unit by Autophagy
(A) Proposed model for the degradation of protein complexes. Subunits of protein complexes may be degraded as a unit by ATG5/7-dependent autophagy or at distinct rates by ATG5/7-independent pathways. (B) Comparison of degradation rates of ribosome, proteasome, and CCT/TRiC subunits in WT+vector and ATG5−/− cells. The data indicate that the degradation rates of most subunits belonging to a complex are decreased by a relatively constant factor (Δkdeg). (C) This general trend is observed for a number of stable complexes. See also Figure S6.

References

    1. An B, Zhang M, Johnson RW, Qu J. Surfactant-aided precipitation/on-pellet-digestion (SOD) procedure provides robust and rapid sample preparation for reproducible, accurate and sensitive LC/MS quantification of therapeutic protein in plasma and tissues. Anal Chem. 2015;87:4023–4029. - PubMed
    1. Bjørkøy G, Lamark T, Pankiv S, Øvervatn A, Brech A, Johansen T. Monitoring autophagic degradation of p62/SQSTM1. Methods Enzymol. 2009;452:181–197. - PubMed
    1. Bodnar AG, Ouellette M, Frolkis M, Holt SE, Chiu CP, Morin GB, Harley CB, Shay JW, Lichtsteiner S, Wright WE. Extension of life-span by introduction of telomerase into normal human cells. Science. 1998;279:349–352. - PubMed
    1. Buchanan DL. Total carbon turnover measured by feeding a uniformly labeled diet. Arch Biochem Biophys. 1961;94:500–511.
    1. Cambridge SB, Gnad F, Nguyen C, Bermejo JL, Krüger M, Mann M. Systems-wide proteomic analysis in mammalian cells reveals conserved, functional protein turnover. J Proteome Res. 2011;10:5275–5284. - PubMed

Publication types

MeSH terms