. 2016 Mar 15;14(10):2281-8.
doi: 10.1016/j.celrep.2016.02.034. Epub 2016 Mar 3.

Plasticity between Epithelial and Mesenchymal States Unlinks EMT from Metastasis-Enhancing Stem Cell Capacity

Affiliations

Plasticity between Epithelial and Mesenchymal States Unlinks EMT from Metastasis-Enhancing Stem Cell Capacity

Evelyne Beerling et al. Cell Rep. .

Abstract

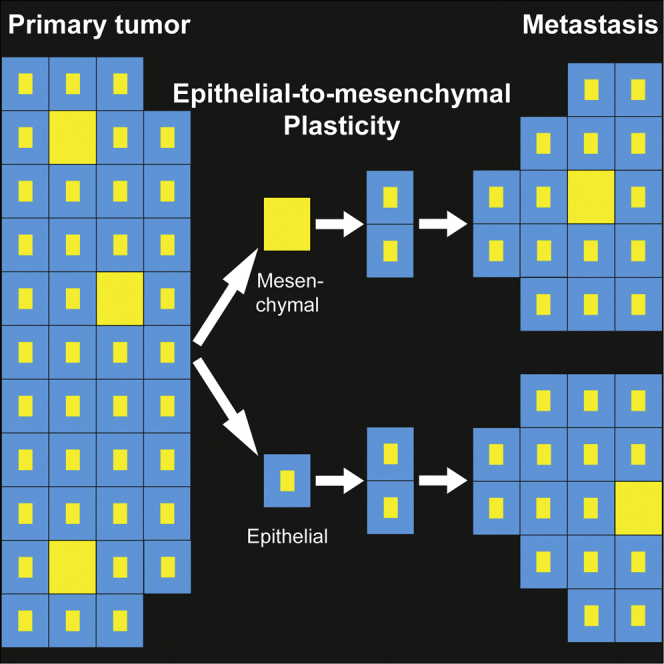
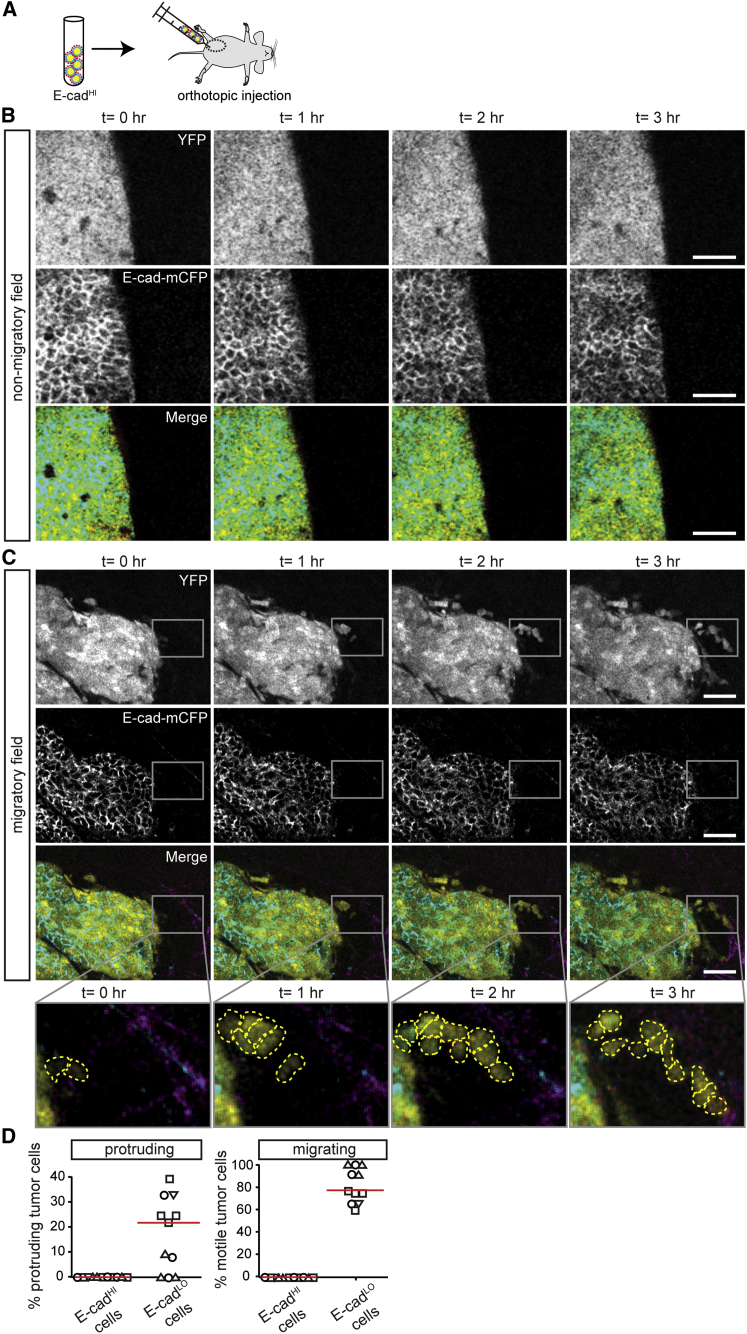
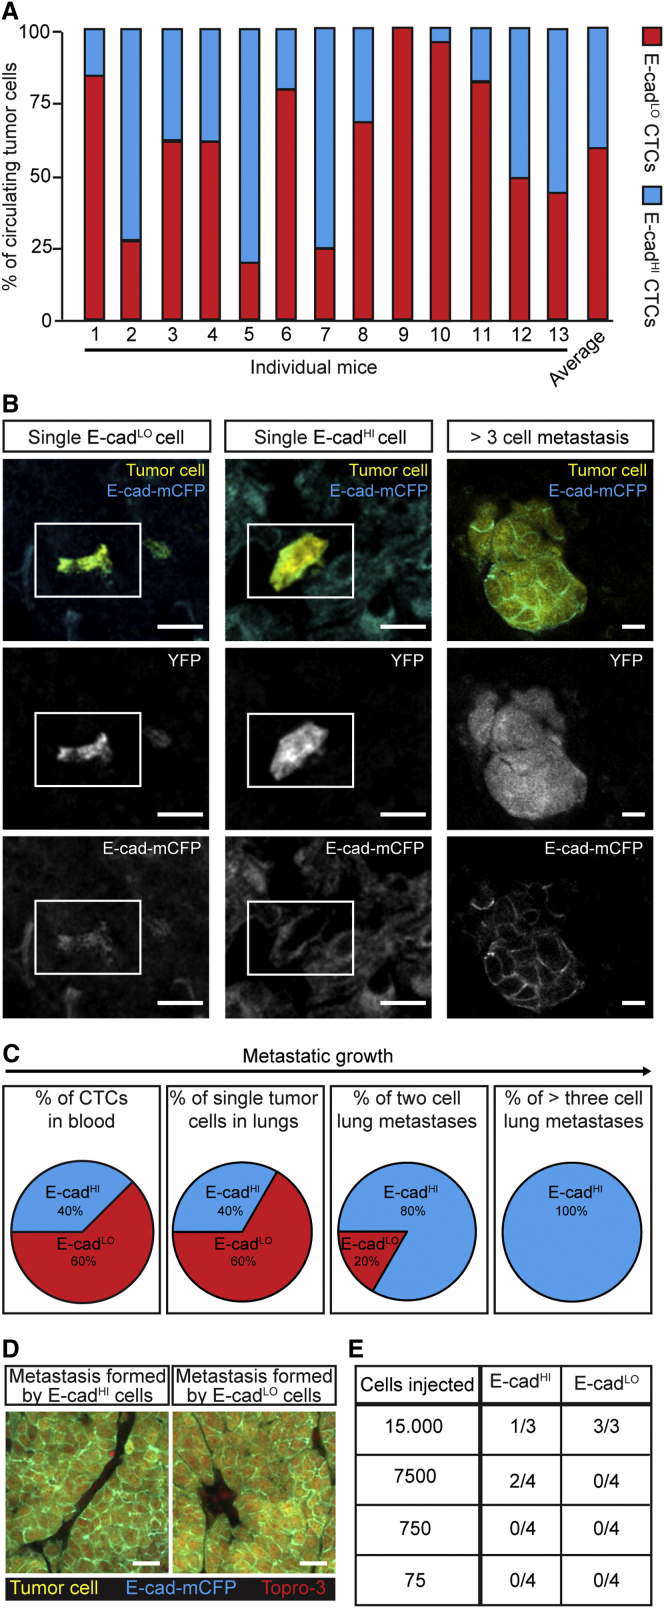
Forced overexpression and/or downregulation of proteins regulating epithelial-to-mesenchymal transition (EMT) has been reported to alter metastasis by changing migration and stem cell capacity of tumor cells. However, these manipulations artificially keep cells in fixed states, while in vivo cells may adapt transient and reversible states. Here, we have tested the existence and role of epithelial-mesenchymal plasticity in metastasis of mammary tumors without artificially modifying EMT regulators. In these tumors, we found by intravital microscopy that the motile tumor cells have undergone EMT, while their epithelial counterparts were not migratory. Moreover, we found that epithelial-mesenchymal plasticity renders any EMT-induced stemness differences, as reported previously, irrelevant for metastatic outgrowth, because mesenchymal cells that arrive at secondary sites convert to the epithelial state within one or two divisions, thereby obtaining the same stem cell potential as their arrived epithelial counterparts. We conclude that epithelial-mesenchymal plasticity supports migration but additionally eliminates stemness-enhanced metastatic outgrowth differences.

Keywords: cancer; epithelial-to-mesenchymal transition (EMT); intravital microscopy.


Figures

None
Graphical abstract
Figure 1
Figure 1
Development of a Fluorescent Mouse Model for Metastatic E-cad-Positive Invasive Ductal Carcinomas (A) Human invasive ductal carcinoma (upper) and a late-stage MMTV-PyMT tumor (lower), stained for E-cad and counterstained with H&E. Scale bar, 30 μm. (B) Schematic representation of the fluorescent mouse model in which all tumor cells express YFP and in which the endogenous E-cad is labeled with CFP. The western blot shows wild-type and CFP-tagged E-cad. (C) Multi-photon images of fluorescent PyMT mammary tumors. Scale bars, 30 μm.
Figure 2
Figure 2
Rare E-cadLO Cells Isolated from Mouse Invasive Ductal Carcinomas Have Undergone EMT (A) Western blot of indicated samples. n = 3 mice. (B) Scatterplot showing expression values for E-cadHI and E-cadLO cells. Red dots that are encircled in red represent genes that are significantly upregulated in E-cadLO cells (q value < 0.01). (C) The relative mRNA expression of EMT-related genes determined by RNA sequencing (RNA-seq) and RT. n = 4 mice, except for ZEB1, where n = 3 mice. (D) T-distributed stochastic neighbor embedding (t-SNE) plot. Using unsupervised K-medoids clustering, two separate clusters were identified indicated as squares and triangles that overlap with E-cadHI (blue) and E-cadLO (red) tumor cells. (E) t-SNE intensity plot for genes differentially upregulated in (B). Related to Figures S1, S2, and S3 and Table S1.
Figure 3
Figure 3
E-cadLO Cells Are Similar to Human Mesenchymal Tumor Cells (A) From a published dataset (Onder et al., 2008), the expression level in human mammary epithelial cells (HMLE) of the human orthologs of the mouse E-cadLO gene set in Figure 2B was retrieved. Differential expression levels per gene as the deviation of the median across all experiments are shown. (B) The image shows an E-cad+ human invasive ductal carcinoma, and the graph shows the percentage of E-cadHI and E-cadLO cells (n = 4 tumors). Scale bar, 20 μm. (C) From published RNA-seq experiments of human breast cancer CTCs (Yu et al., 2013), the relative expression levels of human-mouse orthologs were retrieved. Plots show the average differential expression found in the Yu et al. (2013) dataset for the E-cadLO-upregulated (red bars) or non-upregulated genes (black bars). Expression levels for circulating cells were determined for blood draws from ten healthy donors (left two bars), four blood draws from one patient with CTCs with an epithelial phenotype (middle two bars), and one of the same patient with CTCs with a mesenchymal phenotype (right two bars).
Figure 4
Figure 4
Behavioral Characterization of Rare E-cadLO Tumor Cells in Mouse Mammary Carcinomas that Highly Express E-cad (A) Cartoon of the experimental setup. (B and C) Intravital images of PyMT tumors containing non-motile (B) and migratory (C) tumor cells. The rectangular box highlights migrating E-cadLO cells. Scale bars, 50 μm. (D) The percentage of protruding (left) and motile cells (right) plotted against E-cad status. Red lines indicate the median. The graph represents data from imaging fields with moving cells (11 out of 45 imaging fields from four mice, where symbols represent different mice). Related to Figure S4 and Movies S1 and S2.
Figure 5
Figure 5
Epithelial-Mesenchymal Plasticity Renders Potential Stem Cell Differences Irrelevant for Metastatic Outgrowth (A) The percentage of E-cadLO- and E-cadHI-circulating tumor cells. n = 13 mice. (B) Representative images of single E-cadLO and E-cadHI cells and a multi-cellular metastasis in the lung. White rectangle highlights single cells. Scale bars, 20 μm. (C) Percentages of E-cadLO and E-cadHI tumor cells in blood and lungs. Blood: n = 13 mice; lungs: n = 143 metastases in 16 mice. (D) Representative images of liver metastases grown from E-cadHI cells (left) and E-cadLO cells (right). Scale bars, 40 μm. (E) Table indicating the metastatic outgrowth potential of E-cadLO and E-cadHI cells. Tumor-initiating cell frequency as tested by the Elda-limiting dilution test: E-cadHI cells 1/21,228; E-cadLO cells 1/17,545, p = 0.82. Related to Figure S5.

References

    1. Beck B., Lapouge G., Rorive S., Drogat B., Desaedelaere K., Delafaille S., Dubois C., Salmon I., Willekens K., Marine J.C., Blanpain C. Different levels of Twist1 regulate skin tumor initiation, stemness, and progression. Cell Stem Cell. 2015;16:67–79. - PubMed
    1. Bill R., Christofori G. The relevance of EMT in breast cancer metastasis: correlation or causality? FEBS Lett. 2015;589:1577–1587. - PubMed
    1. Bukholm I.K., Nesland J.M., Børresen-Dale A.L. Re-expression of E-cadherin, alpha-catenin and beta-catenin, but not of gamma-catenin, in metastatic tissue from breast cancer patients [seecomments] J. Pathol. 2000;190:15–19. - PubMed
    1. Cheung K.J., Gabrielson E., Werb Z., Ewald A.J. Collective invasion in breast cancer requires a conserved basal epithelial program. Cell. 2013;155:1639–1651. - PMC - PubMed
    1. Del Pozo Martin Y., Park D., Ramachandran A., Ombrato L., Calvo F., Chakravarty P., Spencer-Dene B., Derzsi S., Hill C.S., Sahai E., Malanchi I. Mesenchymal cancer cell-stroma crosstalk promotes niche activation, epithelial reversion, and metastatic colonization. Cell Rep. 2015;13:2456–2469. - PMC - PubMed

Publication types

MeSH terms