. 2016 Mar 15;14(10):2313-24.
doi: 10.1016/j.celrep.2016.02.030. Epub 2016 Mar 3.

Selective Vulnerability of Cancer Cells by Inhibition of Ca(2+) Transfer from Endoplasmic Reticulum to Mitochondria

Affiliations

Selective Vulnerability of Cancer Cells by Inhibition of Ca(2+) Transfer from Endoplasmic Reticulum to Mitochondria

César Cárdenas et al. Cell Rep. .

Erratum in

Abstract

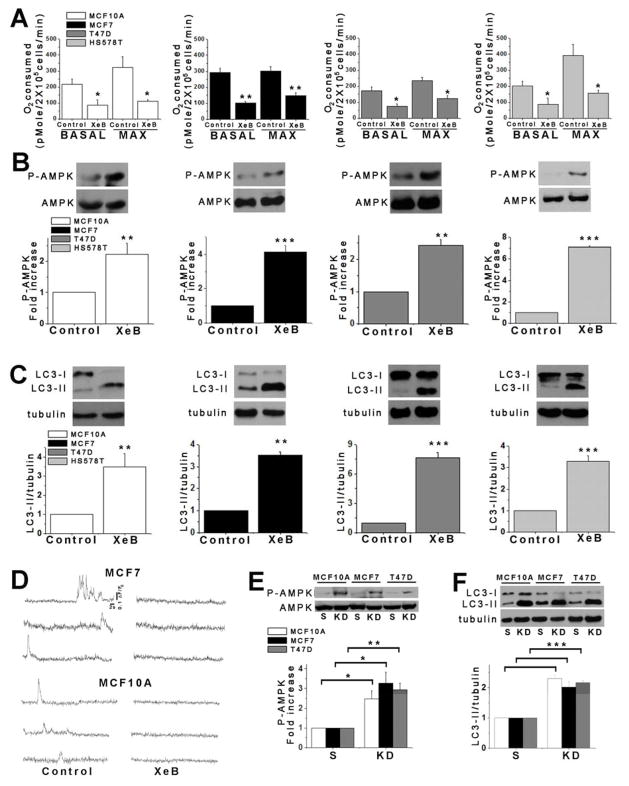
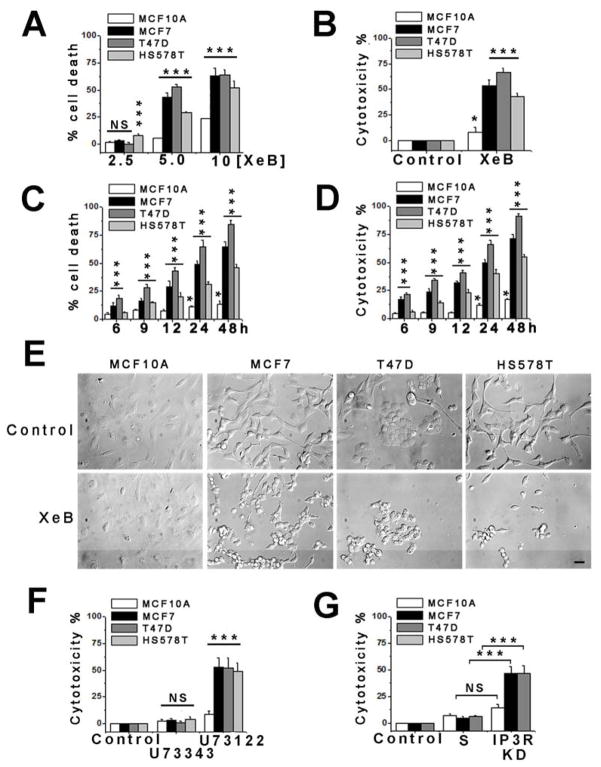
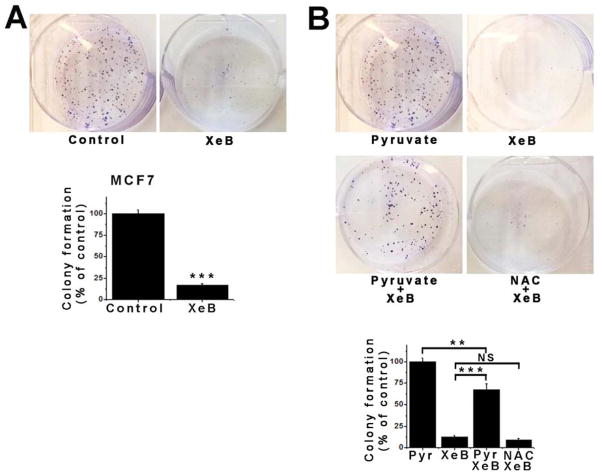
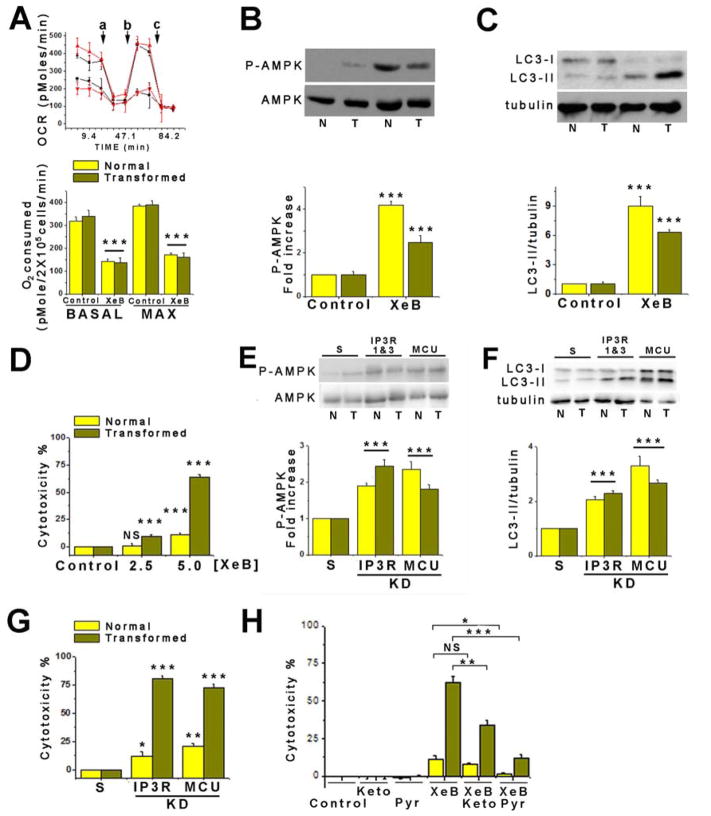
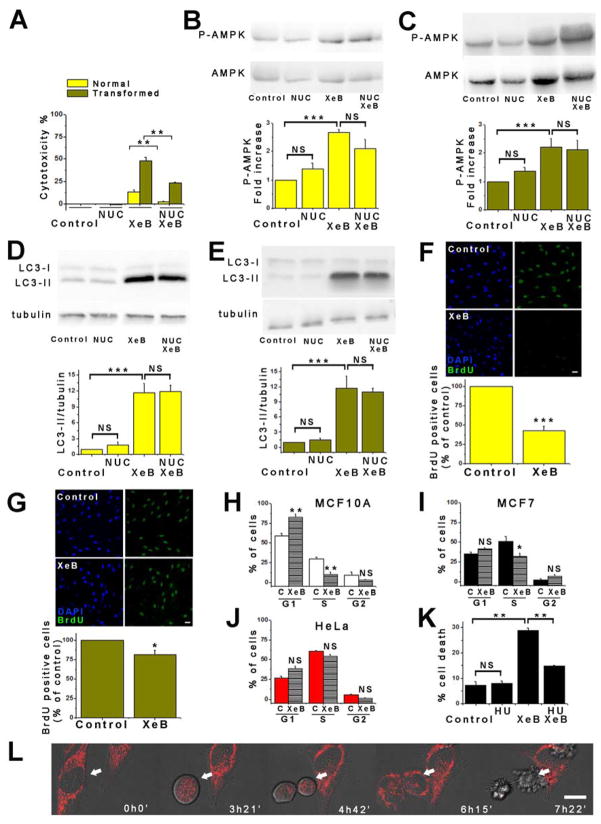
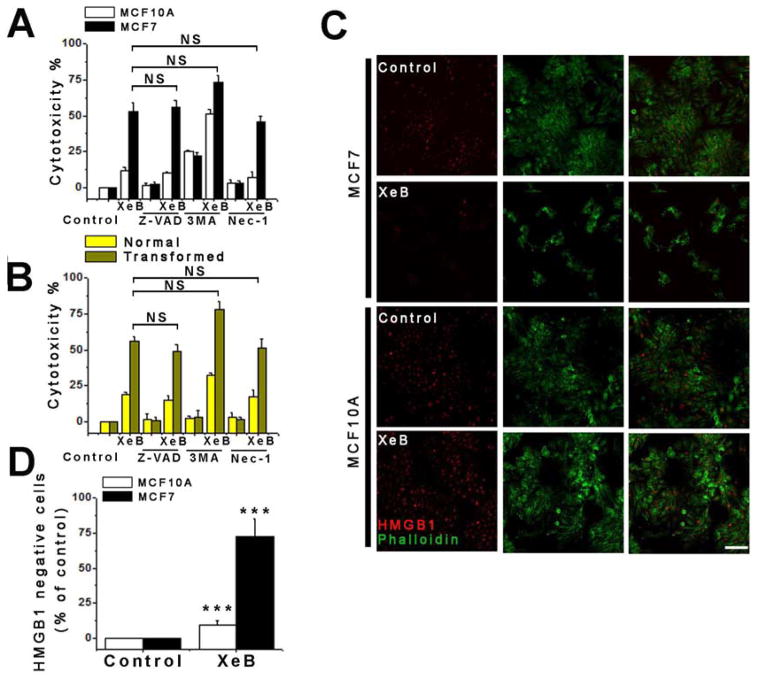
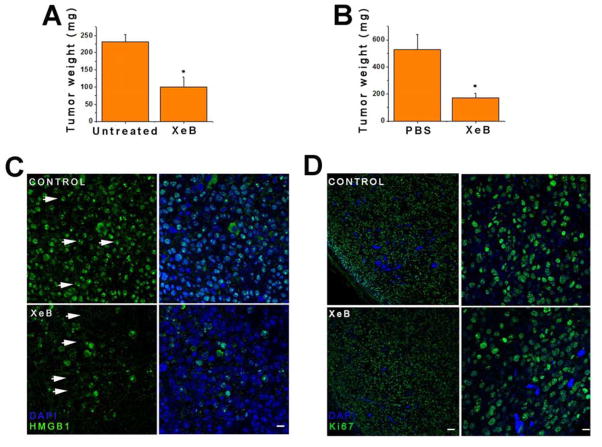
In the absence of low-level ER-to-mitochondrial Ca(2+) transfer, ATP levels fall, and AMPK-dependent, mTOR-independent autophagy is induced as an essential survival mechanism in many cell types. Here, we demonstrate that tumorigenic cancer cell lines, transformed primary human fibroblasts, and tumors in vivo respond similarly but that autophagy is insufficient for survival, and cancer cells die while their normal counterparts are spared. Cancer cell death is due to compromised bioenergetics that can be rescued with metabolic substrates or nucleotides and caused by necrosis associated with mitotic catastrophe during their proliferation. Our findings reveal an unexpected dependency on constitutive Ca(2+) transfer to mitochondria for viability of tumorigenic cells and suggest that mitochondrial Ca(2+) addiction is a feature of cancer cells.


Figures

Figure 1
Figure 1. Inhibition of InsP3R Activity Reduces Oxygen Consumption and Activates AMPK-dependent Autophagy
(A) Basal and maximal oxygen consumption rate (OCR) of non-tumorigenic and tumorigenic breast cell lines incubated with 5 μM XeB for 1h. N=3, mean ± S.E., *p<0.05, **p<0.01 (t-test). (B) Representative Western blots of phosphorylated (P-AMPK) and total AMPK in non-tumorigenic and tumorigenic breast cell lines incubated with 5 μM XeB for 1h. Bar graph: P-AMPK/AMPK expressed as average fold increase over basal levels (control cells). N=5, mean ± S.E., **p<0.01, ***p<0.001 (t-test). (C) Representative Westerns blots of autophagy marker LC3 or tubulin as loading control in non-tumorigenic and tumorigenic breast cell lines treated with 5 μM XeB (1h) and quantification of LC3-II/tubulin expressed as fold increase over basal levels (control cells). N=5, mean ± S.E., **p< 0.01. ***p<0.001 (t-test). (D) Representative fluorescence recordings of Ca2+ release events in unstimulated MCF7 and MCF10A cells treated or not with 5 μM XeB. See also Supplemental Videos 1 and 2. (E) Representative Western blots of AMPK in breast lines transiently transfected with a siRNA against both types 1 and type 3 InsP3R (KD) or non-target scrambled (S) siRNA for 24h. Bar graph: P-AMPK/AMPK expressed as average fold increase over basal levels (NT cells). N=3, mean ± S.E, *p<0.05, **p<0.01 (t test). (F) Representative Western blots of LC3 or tubulin in breast cells transiently transfected with a siRNA against types 1 and 3 InsP3R (KD) or a non-target (S) siRNA for 24h and quantification of LC3-II/tubulin expressed as average fold increase over basal levels (NT cells). N=3, mean ± S.E, ***p<0.001 (t-test). See also Figure S1.
Figure 2
Figure 2. Inhibition of InsP3R Causes Death of Tumorigenic Breast Cell Lines
(A) Non-tumorigenic and tumorigenic human breast cell lines were treated with XeB for 24h and cell death determined by TOTO-3 incorporation by flow cytometry. N=3, mean ± S.E, *** p<0.001, NS: not significant (one-way analysis of variance followed by Dunnett’s multiple comparison post-test). (B) Breast cell lines were treated with 5 μM XeB for 24h and cell death determined by LDH release. N=3, mean ± S.E, *p<0.05, ***p<0.001 (t-test). (C) Time course of cell death determined by TOTO-3 incorporation by flow cytometry in human breast cell lines treated with 5 μM XeB. N=3, mean ± S.E, * p<0.05, *** p<0.001 (t-test). (D) Time course of cell death determined by LDH release in breast cell lines treated with 5 μM XeB. N=3, mean ± S.E, *p<0.05, ***p<0.001 (t-test). (E) DIC images of breast cell lines derived from non-tumorigenic (MCF10A) or tumorigenic (MCF7, T47D, HS578T) human tissue treated with 5 μM XeB for 24h. Bar: 10 μm. N = 3. (F) Non-tumorigenic and tumorigenic breast cell lines were treated with 2 μM of the PLC inhibitor U73122 or its inactive analog U73343 for 12h and cell death determined by LDH release. N=3, mean ± S.E., ***p<0.001, NS: not significant (t -test). (G) Cell death (LDH release) in human breast cell lines transiently transfected with a siRNA against type 1 and type 3 InsP3R (KD) or a scrambled non-target (S) siRNA for 24h. N=3, mean ± S.E., ***p<0.001, NS: non significant (t-test). See also Figure S1.
Figure 3
Figure 3. Inhibition of InsP3R Signaling Impairs Colony Formation in the MCF7 Tumorigenic Breast Cell Line
(A) Representative plates of MCF7 cells treated with 5 μM XeB or vehicle (top) and quantitative analysis of colony numbers (bottom). N=3, mean ± S.E, ***p<0.001 (t-test). (B) Representative plates of MCF7 cells treated with 5 μM XeB, 5 mM methyl-pyruvate, 5 μM XeB plus 5 mM methyl-pyruvate or 5 μM XeB plus 5 mM n-acetylcysteine (NAC) (top) and quantitative analysis of colony numbers (bottom). N=3, mean ± S.E., ***p<0.001, **p<0.001, NS: not significant (t-test). See also Figure S2.
Figure 4
Figure 4. Pharmacological and Genetic Inhibition of InsP3R Causes Death of Primary HRasG12V-Cdk4 Transformed Human Fibroblasts
(A) Upper: representative traces of OCR in normal (black) or transformed (red) fibroblasts treated (●,▼) or not (■, ▲) with 5 μM XeB for 1h. a: injection of 1 μM oligomycin; b: 300 nM FCCP; c: 100 nM rotenone. Bottom, summary of basal and maximal OCR in fibroblasts treated or not with 5 μM XeB for 1h. N=3, mean ± S.E., ***p< 0.001. (B) Representative Western blots of AMPK in normal (N) and transformed (T) fibroblasts treated with 5 μM XeB (1h). Bar graph: P-AMPK/AMPK expressed as average fold increase over basal levels (control cells). N=6, mean ± S.E., ***p<0.001 (t-test). (C) Representative Western blots of LC3 and tubulin in normal (N) and transformed (T) fibroblasts treated with 5 μM XeB for 1h. Bar graph: LC3-II/tubulin expressed as average fold increase over basal levels (control cells). N=6, mean ± S.E., ***p<0.001 (t-test). (D) Determination of cell death by LDH release in normal and transformed fibroblasts treated with 2.5 or 5 μM XeB (24h). N=3, mean ± S.E., ***p<0.001, NS: not significant (t-test). (E) Representative Western blots AMPK in normal (N) and transformed (T) fibroblasts transiently transfected with a siRNA against type 1 and type 3 InsP3R for 24h or siRNA against MCU for 72h. Bar graph: P-AMPK/AMPK expressed as the average fold increase over basal levels (NT cells). N=3, mean ± S.E., ***p<0.001 (t-test). (F) Representative Western blots of LC3 and tubulin in normal (N) and transformed (T) fibroblasts transiently transfected with a siRNA against types 1 and 3 InsP3R for 24h or siRNA against MCU for 72h, or scrambled sRNAs (S); LC3-II/tubulin expressed as average fold increase over basal levels (S cells). N=3, mean ± S.E., ***p<0.001 (t-test). (G) Determination of cell death by LDH release in normal and transformed fibroblasts transiently transfected with a siRNA against types 1 and 3 InsP3R for 24h or siRNA against MCU for 72h. N=3, mean ± S.E., *p<0.05, **p<0.01, ***p<0.001 (t-test). (H) Determination of cell death by LDH release in normal and transformed fibroblasts treated simultaneously with 5 μM XeB and either 5 mM methyl-pyruvate (Pyr) or 5 mM dimethyl alpha-ketoglutarate (Keto) for 24h. N=3, mean ± S.E., *p<0.05, **p<0.01, ***p<0.001, NS: non significant (t-test). See also Figure S4.
Figure 5
Figure 5. Nucleoside Rescue of Cancer Cell Killing and Cell Cycle Defects by Inhibition of InsP3R Activity
(A) Normal and transformed fibroblasts were treated with 5 μM XeB in absence or presence of nucleosides (NUC) for 24h and cell death determined by LDH release. N=3, mean ± S.E., **p<0.01 (t-test). (B) Representative Western blots of AMPK in normal fibroblasts treated with 5 μM XeB for 1h in presence or absence of NUC. Bar graph: P-AMPK/AMPK expressed as average fold increase over basal levels (control cells). N=3, mean ± S.E., ***p<0.001, NS: not significant (t-test). (C) As in (B), using transformed fibroblasts. N=3, mean ± S.E., ***p<0.001, NS: not significant (t-test). (D) Representative Western blots of LC3 and tubulin in normal fibroblasts treated with 5 μM XeB for 1h in presence or absence of NUC. Bar graph: LC3-II/tubulin expressed as average fold increase over basal levels (control cells). N=3, mean ± S.E., ***p<0.001, NS: not significant (t-test). (E) As in (D), using transformed fibroblasts. N=3, mean ± S.E., ***p<0.001 (t- test). (F) BrdU incorporation in normal fibroblasts treated with 5 μM XeB for 12h. Top: BrdU immunofluorescence. Bottom: BrdU labeling expressed as percent of control. N=3, mean ± S.E., ***p<0.001 (t-test). (G) As in (F), using transformed fibroblasts. N=3, mean ± S.E., *p<0.05 (t-test). (H) Cell cycle profile determined by flow cytometry in MCF10A cells treated or not with 5 μM XeB for 24h, showing percent of cells in each phase. N=3. **p<0.001, NS: not significant. (I) Cell cycle profile in MCF7 cells treated or not with 5 μM XeB for 24h, showing percentage of cells in each phase. N=3. *p<0.05, NS: not significant. (J) As in (I), using HeLa cells. N=3. NS: not significant. (K) Cell death determined by propidium iodide incorporation by flow cytometry of MCF7 cells treated or not with 5 μM XeB for 24h after a 48h treatment with 400 μM hydroxyurea (HU). **p<0.001 (t-test). (L) DIC images of HeLa cells loaded with 8 nM TMRE. XeB (5 μM) added at time 0h0′; images collected at indicated times. Arrow shows dividing cell. Bar: 10 μm. See also Supplemental Video 3.
Figure 6
Figure 6. Inhibition of InsP3R Activity Kills Cancer Cells by Necrosis but Not by Autophagy, Apoptosis or Necroptosis
(A) Non-tumorigenic (MCF10A) and tumorigenic (MCF7) breast cell lines were treated with 5 μM XeB for 24h in presence or absence of the apoptosis inhibitor Z-VAD-FMK (20 μM), autophagy inhibitor 3-MA (10 mM) or necroptosis inhibitor nec-1 (20 μM) and cell death determined by LDH release. N=3, mean ± S.E., NS: not significant (t-test). (B) As in (A) for normal and transformed primary human fibroblasts. N=3, mean ± S.E., NS: not significant (t-test). (C) HMGB1 immunofluorescence in MCF7 and MCF10A cells treated with 5 μM XeB or vehicle for 24h. Note that most nuclear label is absent in treated MCF7 cells. Bar: 10 μm. (D) Quantification of loss of nuclear HMGB1 expressed as percent increase over control. N=3, mean ± S.E., ***p<0.001 (t-test).
Figure 7
Figure 7. Inhibition of InsP3R Retards Tumor Growth In Vivo
Tumors were generated by subcutaneous injection of murine melanoma-derived B16F10 cells into nude mice. (A) Tumor weight in mice with tumors injected with 100 μl of a 100 μM XeB solution 1d before euthanization. N=9, mean ± S.E., *p<0.05 (t-test). (B) Tumor weight in mice with tumors injected with 100 μl of a 100 μM XeB solution or vehicle every other day for 6d before euthanization. N=9, mean ± S.E., *p<0.05 (t-test). (C) HMGB1 immunofluorescence in tumors injected or not with 100 μl of a 100 μM XeB solution 1d before euthanization. Control tumor shows strong nuclear labeling (arrows) while in XeB-treated tumor the nuclei appear empty (arrows) with remaining labeling cytosolic or extracellular. N = 3. Bar: 100 μm. (D) Ki67 immunofluorescence in tumors injected or not with 100 μl of a 100 μM XeB solution 1d before euthanization. Left: panoramic view of control and XeB-treated tumors. Bar: 100 μm. Right: detail of control and XeB-treated tumors. Bar: 10 μm. N = 3. See also Figure S6.

Comment in

References

    1. Ahn CS, Metallo CM. Mitochondria as biosynthetic factories for cancer proliferation. Cancer Metab. 2015;3:1. - PMC - PubMed
    1. Andrae U, Singh J, Ziegler-Skylakakis K. Pyruvate and related alpha-ketoacids protect mammalian cells in culture against hydrogen peroxide-induced cytotoxicity. Toxicol Lett. 1985;28:93–98. - PubMed
    1. Armstrong CT, Anderson JL, Denton RM. Studies on the regulation of the human E1 subunit of the 2-oxoglutarate dehydrogenase complex, including the identification of a novel calcium-binding site. Biochem J. 2014;459:369–381. - PubMed
    1. Bayley JP, Devilee P. Warburg tumours and the mechanisms of mitochondrial tumour suppressor genes. Barking up the right tree? Curr Opin Genet Dev. 2010;20:324–329. - PubMed
    1. Birsoy K, Possemato R, Lorbeer FK, Bayraktar EC, Thiru P, Yucel B, Wang T, Chen WW, Clish CB, Sabatini DM. Metabolic determinants of cancer cell sensitivity to glucose limitation and biguanides. Nature. 2014;508:108–112. - PMC - PubMed

Publication types

MeSH terms