. 2016 Mar 7:7:10872.
doi: 10.1038/ncomms10872.

Osteoclast-derived exosomal miR-214-3p inhibits osteoblastic bone formation

Affiliations

Osteoclast-derived exosomal miR-214-3p inhibits osteoblastic bone formation

Defang Li et al. Nat Commun. .

Erratum in

  • Author Correction: Osteoclast-derived exosomal miR-214-3p inhibits osteoblastic bone formation.
    Li D, Liu J, Guo B, Liang C, Dang L, Lu C, He X, Cheung HY, Xu L, Lu C, He B, Liu B, Shaikh AB, Li F, Wang L, Yang Z, Au DW, Peng S, Zhang Z, Zhang BT, Pan X, Qian A, Shang P, Xiao L, Jiang B, Wong CK, Xu J, Bian Z, Liang Z, Guo DA, Zhu H, Tan W, Lu A, Zhang G. Li D, et al. Nat Commun. 2025 Jun 19;16(1):5348. doi: 10.1038/s41467-025-61082-9. Nat Commun. 2025. PMID: 40537508 Free PMC article. No abstract available.

Abstract

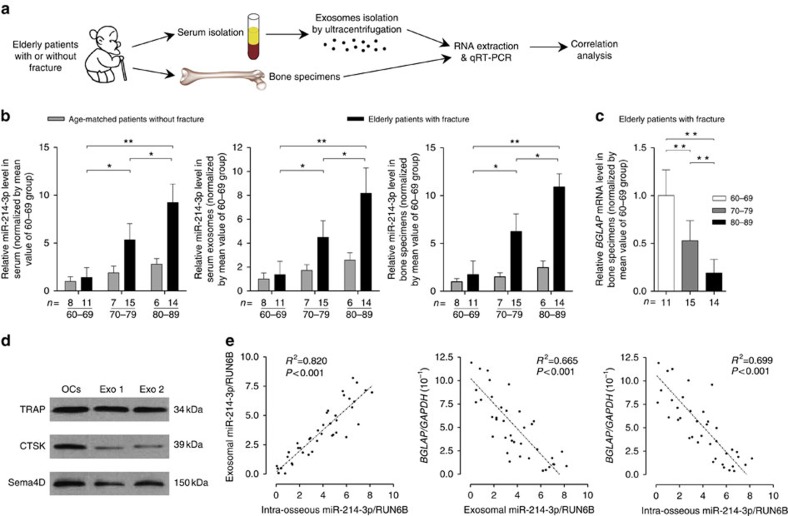
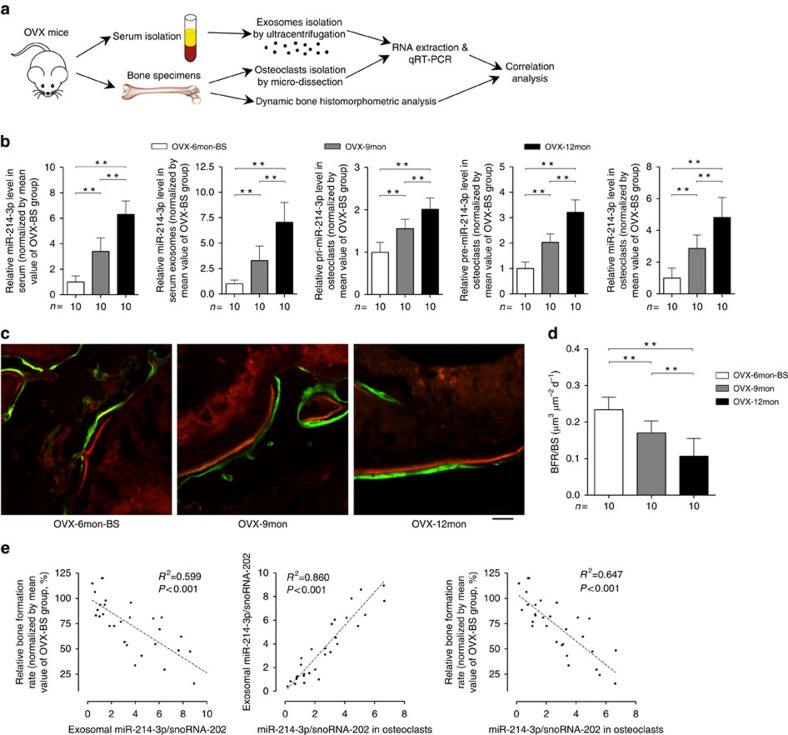
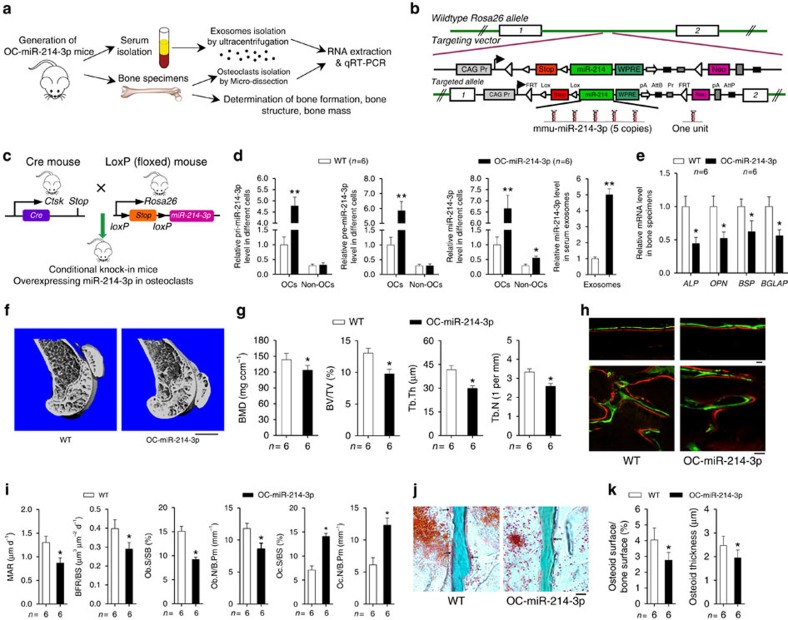
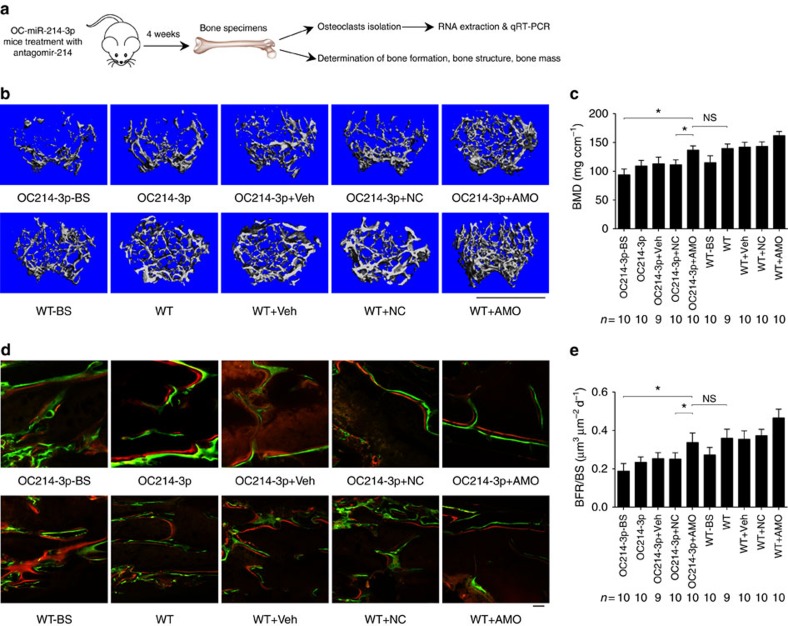
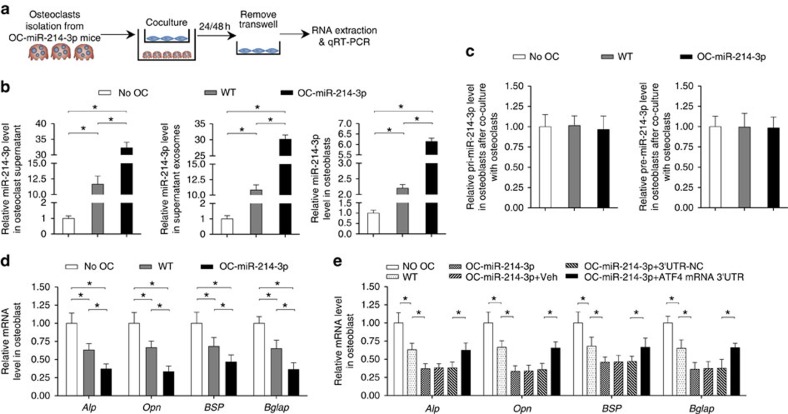
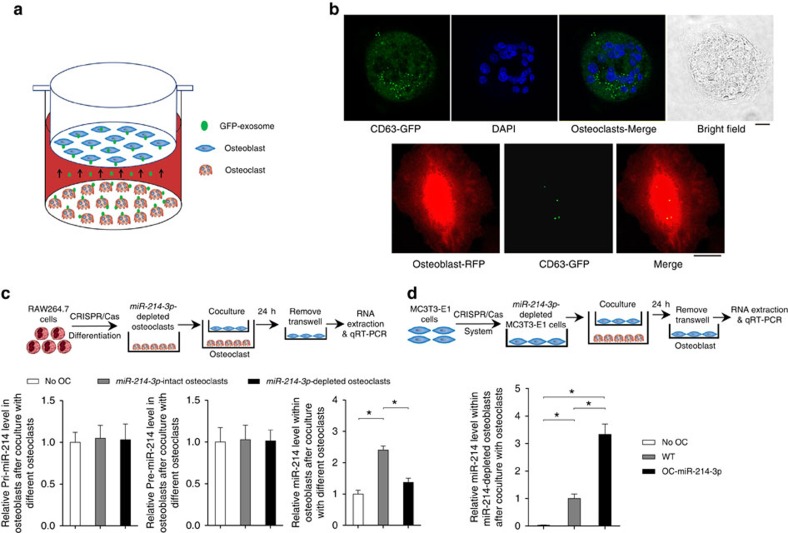
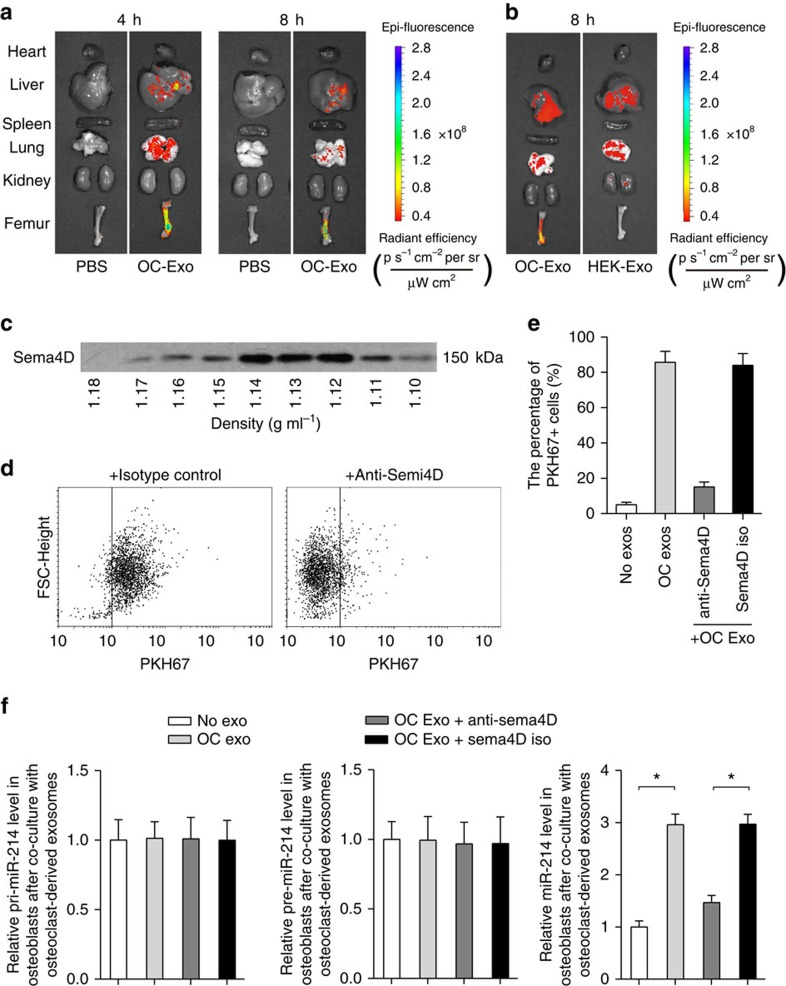
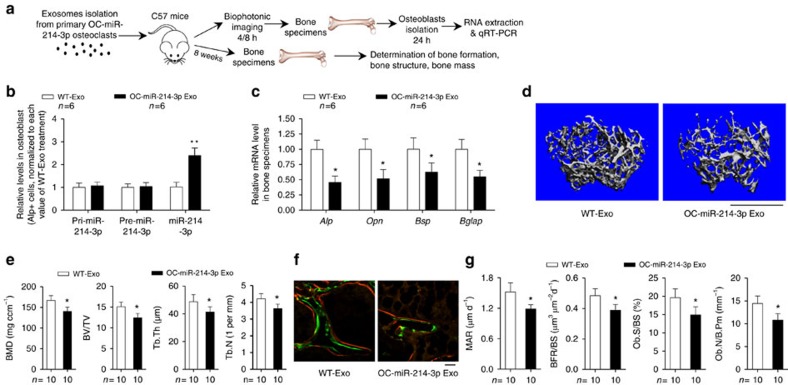
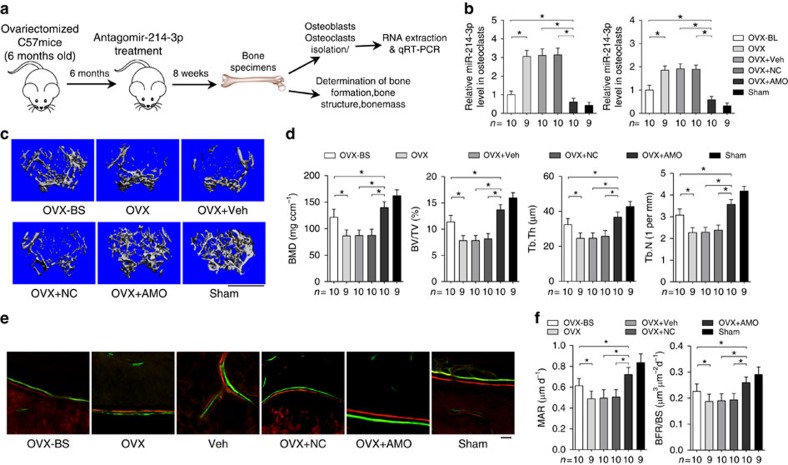
Emerging evidence indicates that osteoclasts direct osteoblastic bone formation. MicroRNAs (miRNAs) have a crucial role in regulating osteoclast and osteoblast function. However, whether miRNAs mediate osteoclast-directed osteoblastic bone formation is mostly unknown. Here, we show that increased osteoclastic miR-214-3p associates with both elevated serum exosomal miR-214-3p and reduced bone formation in elderly women with fractures and in ovariectomized (OVX) mice. Osteoclast-specific miR-214-3p knock-in mice have elevated serum exosomal miR-214-3p and reduced bone formation that is rescued by osteoclast-targeted antagomir-214-3p treatment. We further demonstrate that osteoclast-derived exosomal miR-214-3p is transferred to osteoblasts to inhibit osteoblast activity in vitro and reduce bone formation in vivo. Moreover, osteoclast-targeted miR-214-3p inhibition promotes bone formation in ageing OVX mice. Collectively, our results suggest that osteoclast-derived exosomal miR-214-3p transfers to osteoblasts to inhibit bone formation. Inhibition of miR-214-3p in osteoclasts may be a strategy for treating skeletal disorders involving a reduction in bone formation.


Figures

Figure 1
Figure 1. Increased intraosseous miR-214-3p associates with elevated serum exosomal miR-214-3p and reduced bone formation in elderly patients.
(a) A schematic diagram illustrating the experimental design. Serum and bone samples were collected from elderly woman patients with or without fractures, and divided into 60–69, 70–79 and 80–89 groups, respectively, according to age. (b) Real-time PCR analysis of the age-related changes in miR-214-3p levels in whole serum (left), serum exosomes (middle) and bone specimens (right) from elderly patients with or without fractures, respectively. The relative miR-214-3p level in each group was normalized to the mean value of the 60–69 group. Human RUN6B was used as the internal control. All data are the mean±s.d. *P<0.05, **P<0.01. Two-way analysis of variance (ANOVA) with a Turkey's multiple comparisons test was performed. Both the time effect (age), the group effect (with or without fractures) and the time-by-group interaction effect were all statistically significant for all the examined parameters. (c) Real-time PCR analysis showing the age-related changes in BGLAP mRNA levels in bone specimens from elderly patients with fractures, respectively. The relative BGLAP mRNA level in each group was normalized to the mean value of the 60–69 group. Human GAPDH mRNA was used as the internal control. Data are the mean±s.d. **P<0.01. One-way ANOVA with a post-hoc test was performed. (d) Western blot analysis of the osteoclast marker proteins (CTSK, TRAcP5 and Sema4D) in the lysates of serum exosomes isolated from elderly patients with or without fractures. OCs, the lysates of osteoclasts differentiated from human peripheral blood mononuclear cells. Exo 1, the lysates of serum exosomes from elderly patients without fractures. Exo 2, the lysates of serum exosomes from elderly patients with fracture. (e) Correlation analysis between exosomal and intra-osseous miR-214-3p levels (left), between exosomal miR-214-3p level and intra-osseous BGLAP mRNA level (middle) and between intra-osseous miR-214-3p level and intra-osseous BGLAP mRNA level (right), respectively, in elderly patients with fractures. The n value for each group is indicated at the bottom of each histogram.
Figure 2
Figure 2. Increased intra-osteoclast miR-214-3p associates with elevated serum exosomal miR-214-3p and reduced bone formation in OVX mice.
(a) A schematic diagram illustrating the experimental design. Serum and bone samples were collected from female C57BL/6 mice that were ovariectomized at 6-month-old and killed at 6 months (as baseline, OVX-6mon-BS), 9 months (OVX-9mon) and 12 months (OVX-12mon) after ovariectomy, respectively. (b) Real-time PCR analysis of the age-related changes in the levels of miR-214-3p in whole serum (left) and serum exosomes (middle left), and the levels of pri-miR-214-3p (middle), pre-miR-214-3p (middle right) and mature miR-214-3p in osteoclasts (right) in OVX mice in three age-subgroups, respectively. The relative miR-214-3p level in each group was normalized to the mean value of the OVX-BS group. Mouse snoRNA-202 was used as the internal control. (c) Representative images of new bone formation at distal femur metaphysis assessed by double labelling with calcein green and xylenol orange in three age-subgroups. Scale bar, 10 μm. (d) Bone histomorphometry analysis of the age-related changes in BFR/BS at distal femur in three age-subgroups, respectively. (e) Correlation analysis between serum exosomal miR-214-3p level and BFR/BS (left), between serum exosomal and intraosteoclast miR-214-3p levels (middle) and between intraosteoclast miR-214-3p level and BFR/BS (right), respectively. The n value for each group is indicated at the bottom of each histogram. All data are the mean±s.d. **P<0.01. One-way ANOVA with a post-hoc test was performed.
Figure 3
Figure 3. Reduced bone formation in OC-miR-214-3p mice.
(a) A schematic diagram illustrating the experimental design. (b,c) Schematic diagrams of the development strategy of the OC-miR-214-3p mice. The ROSA26-miR-214-3p knock-in mice containing the miR-214-3p knock-in allele were generated, and then crossed with the Ctsk-cre transgenic mice to obtain the OC-miR-214-3p mice. One unit included the mmu-miR-214-3p stem–loop, a 200-bp 5′ flanking sequence and a 200-bp 3′ flanking sequence. (d) Real-time PCR analysis of pri-miR-214-3p (left), pre-miR-214-3p (middle left) and miR-214-3p (middle right) levels in osteoclasts (OCs) versus non-osteoclasts (non-OCs) and serum exosomal miR-214-3p level (right) from WT and OC-miR-214-3p mice. The OCs and non-OCs were the Ctsk+ and Ctsk cells isolated from the bone marrow cells by magnetic-activated cell sorting, respectively. (e) Real-time PCR analysis of the mRNA levels of bone formation marker genes (Alp, Opn, BSP and Bglap) in bone specimens from WT and OC-miR-214-3p mice. (f) Representative micro-CT images of the distal femur from WT and OC-miR-214-3p mice. (g) The values of micro-CT parameters (BMD, BV/TV, Tb.Th and Tb.N) at the distal femur metaphysis from WT and OC-miR-214-3p mice. (h) Representative images of new bone formation assessed by double labelling with calcein green and xylenol orange at the cortical bone (CB) and trabecular bone (TB) of distal femur from WT and OC-miR-214-3p mice. Scale bars, 10 μm. (i) The values of bone histomorphometry parameters (MAR, BFR/BS, Ob.S/BS, Ob.N/B.Pm, Oc.S/BS and Oc.N/B.Pm) at the distal femur metaphysis from WT and OC-miR-214-3p mice. (j) Representative images of osteoid formation indicated by Masson's trichrome staining at the distal femur metaphysis of WT and OC-miR-214-3p mice. Scale bars, 20 μm. (k) The values of osteoid-related parameters (Osteoid surface/bone surface and Osteoid thickness) at the distal femur metaphysis from WT and OC-miR-214-3p mice. The n value for each group is indicated at the bottom of each histogram. All data are the mean±s.d. *P<0.05 versus WT. **P<0.01 versus WT. Student's t-test was performed.
Figure 4
Figure 4. Osteoclast-targeted antagomir-214-3p treatment rescues bone phenotype in OC-miR-214-3p mice.
(a) A schematic diagram illustrating the experimental design. The 4-week-old OC-miR-214-3p or WT mice were intravenously injected with PBS (OC214-3p/WT), (D-Asp)8-liposome (vehicle) alone (OC214-3p+Veh/WT+Veh), (D-Asp)8-liposome-antagomir nonsense control (OC214-3p+NC/WT+NC) and (D-Asp)8-liposome-antagomir-214-3p (OC214-3p+AMO/WT+AMO), respectively, at a weekly interval and killed 4 weeks after the first treatment. Another group of OC-miR-214-3p or WT mice were killed at 4-week-old before treatment initiation as baseline (OC214-3p-BS/WT-BS). (b) Representative micro-CT images of the distal femur metaphysis in each group. Scale bars, 1 mm. (c) The values of micro-CT parameter (BMD) at the distal femur metaphysis in each group. (d) Representative images of new bone formation assessed by double labelling with calcein green and xylenol orange at the distal femur metaphysis in each group. Scale bars, 10 μm. (e) The values of bone histomorphometry parameter (BFR/BS) at the distal femur metaphysis in each group. The n value for each group is indicated at the bottom of each histogram. All data are the mean±s.d. *P<0.05. NS, not significant. One-way ANOVA with a post-hoc test was performed.
Figure 5
Figure 5. Osteoclastic miR-214-3p inhibit osteoblast activity.
(a) A schematic diagram illustrating the design of the co-culture experiments. The osteoblasts derived from the calvarial bone of newborn C57BL/6 mice were co-cultured with the osteoclasts derived from OC-miR-214-3p mice (OC-miR-214-3p OCs) or WT mice (WT OCs), or cultured without osteoclasts (No OC). (b) Real-time PCR analysis of the supernatant, supernatant exosomal and intra-osteoblast miR-214-3p levels (normalized by the mean value of No OC) at 24 h after co-culture, respectively. (c) The pri-miR-214-3p and pre-miR-214-3p levels in osteoblasts at 24 h after co-culture. (d) Real-time PCR analysis of the mRNA levels of osteoblast activity-related marker genes (Alp, Opn, BSP and Bglap) in osteoblasts at 48 h after co-culture. (e) Real-time PCR analysis of the mRNA expression levels of Alp, Opn, BSP and Bglap in osteoblasts transfected with exogenous ATF4 mRNA 3′UTR at 48 h after co-culture. The osteoblasts transfected with either vehicle (OC-miR-214 3p+Veh), nonsense 3′UTR control (OC-miR-214 3p+NC) or ATF4 mRNA 3′UTR (OC-miR-214 3p+ ATF4 mRNA 3′UTR) were co-cultured with the OC-miR-214 3p osteoclasts. All data are the mean±s.d. of four independent experiments. *P<0.05. One-way ANOVA with a post-hoc test was performed.
Figure 6
Figure 6. Osteoclast-derived exosomal miR-214-3p transfer to osteoblasts.
(a) A schematic diagram illustrating the design of co-culture experiments with GFP-exosome-producing osteoclasts and osteoblasts. CMV-GFP-CD63 were transfected into the OC-miR-214-3p osteoclasts to label the osteoclast-derived exosomes. (b) Representative confocal images of the GFP-exosome-producing osteoclasts at 24 h after transfection (left panels), and the uptake of GFP-exosome by osteoblasts (right panels) at 24 h after co-culture. (c) A schematic diagram illustrating the design of co-culture experiments with the osteoblasts and miR-214-3p-depleted osteoclasts (upper panels), and real-time PCR analysis of the levels of pri-miR-214-3p, pre-miR-214-3p and miR-214-3p in osteoblasts (normalized by the mean value of No OC group) at 24 h after co-culture with miR-214-3p-depleted/intact osteoclasts differentiated from miR-214-3p-depleted/intact RAW264.7 cells, respectively (lower panels). (d) A schematic diagram illustrating the design of co-culture experiments with the osteoclasts and miR-214-3p-depleted osteoblasts (upper panels), and real-time PCR analysis of the miR-214-3p level in miR-214-3p-depleted osteoblasts (normalized by the mean value of No OC group) at 24 h after co-culture with either OC-miR-214-3p or WT osteoclasts (lower panels). All data are the mean±s.d. of four independent experiments. *P<0.05. One-way ANOVA with a post-hoc test was performed.
Figure 7
Figure 7. Osteoclast-derived exosomes target osteoblasts.
(a) Representative biophotonic images of the tissue distribution of fluorescence signal in mice at 4 and 8 h after intravenous injection of purified PKH67-labelled exosomes isolated from the supernatant of OC-miR-214-3p osteoclasts (OC-Exo). (b) Representative biophotonic images of the tissue distribution of fluorescence signal in mice at 8 h after intravenous injection of purified PKH67 exosomes isolated from the supernatant of either OC-miR-214-3p osteoclast (OC-Exo) or HEK 293T cells (HEK-Exo). (c) Western blot analysis of the Sema4D protein expression in pellets of sucrose gradient fractions from the osteoclast-derived exosome preparations. The density of each fraction was determined by refraction index measurements. (d,e) Flow cytometry analysis of PKH67+ osteoblasts after incubation with PKH67-labelled exosomes derived from OC-miR-214-3p osteoclasts. The PKH67-labelled exosomes were pre-treated with either anti-Sema4D (20 μg ml−1) or isotype-matched control (Sema4D iso) and then added to osteoblasts for 4 h incubation. (f) Real-time PCR analysis of the levels of pri-miR-214, pre-miR-214 and mature miR-214 in osteoblasts after incubation with either anti-Sema4D-treated exosomes (OC Exo+Anti-Sema4D) or Sema4D isotype-treated exosomes (OC Exo+Sema4D iso), respectively. All data are the mean±s.d. of four independent experiments. *P<0.05. One-way ANOVA with a post-hoc test was performed.
Figure 8
Figure 8. Osteoclast-derived exosomal miR-214-3p inhibit bone formation.
(a) A schematic diagram illustrating the experimental design. The female C57BL/6 mice were intravenously injected with purified exosomes derived from either OC-miR-214-3p (OC-miR-214-3p Exo) or WT (WT-Exo) osteoclasts. (b) Real-time PCR analysis of the levels of either pri-miR-214, pre-miR-214 or miR-214 in ALP+ cells (osteoblasts) isolated from bone marrow cells by fluorescence-activated cell sorting at 24 h after the mice were intravenously injected with either OC-miR-214-3p Exo or WT-Exo. (c) Real-time PCR analysis of the mRNA expression levels of Alp, Opn, BSP and Bglap in femurs from the mice administered with either OC-miR-214-3p Exo or WT-Exo, respectively. (d) Representative micro-CT images of the distal femur metaphysis from the mice administered with either OC-miR-214-3p Exo or WT-Exo. Scale bar, 1 mm. (e) The values of micro-CT parameters (BMD, BV/TV, Tb.Th and Tb.N) at the distal femur metaphysis from the mice administered with either OC-miR-214-3p Exo or WT-Exo, respectively. (f) Representative images of new bone formation assessed by double labelling with calcein green and xylenol orange at the distal femur metaphysis from the mice administered with either OC-miR-214-3p Exo or WT-Exo. Scale bars, 10 μm. (g) The values of bone histomorphometry parameters (MAR, BFR/BS, Ob.S/BS, Ob.N/B.Pm) at the distal femur metaphysis from the mice administered with either OC-miR-214-3p Exo or WT-Exo, respectively. The n value for each group is indicated at the top/bottom of each histogram. All data are the mean±s.d. *P<0.05 versus WT. Student's t-test was performed.
Figure 9
Figure 9. Osteoclast-targeted antagomiR-214-3p treatment promotes bone formation in ageing OVX mice.
(a) A schematic diagram illustrating the experimental design. The female C57BL/6 mice were either ovariectomized or Sham operated at 6-month-old, and left untreated for 6 months. At 12-month-old, the OVX mice received eight consecutive intravenous injections with either PBS (OVX), (D-Asp)8-liposome (vehicle) alone (OVX+Veh), (D-Asp)8-liposome-antagomir nonsense control (OVX+NC) or (D-Asp)8-liposome-antagomir-214-3p (OVX+AMO), whereas the Sham mice received eight consecutive intravenous injections with PBS (Sham), at a weekly interval and killed 8 weeks after the first injection. Another group of OVX mice were killed at 12-month-old before treatment initiation as baseline (OVX-BS). (b) Real–time PCR analysis of the miR-214-3p levels in CTSK+ cells (Osteoclasts) and ALP+ cells (osteoblasts) isolated from cryosections of femur by laser-captured microdissection from the mice in each group. (c) Representative micro-CT images of the distal femur metaphysis from the mice in each group. Scale bars, 1 mm. (d) The values of micro-CT parameters (BMD, BV/TV, Tb.Th and Tb.N) at the distal femur metaphysis from the mice in each group. (e) Representative images of new bone formation assessed by double labelling with calcein green and xylenol orange at the distal femur metaphysis from the mice in each group. Scale bars, 10 μm. (f) The values of bone histomorphometry parameters (MAR, BFR/BS) at the distal femur metaphysis from the mice in each group. The n value for each group is indicated at the top/bottom of each histogram. All data are the mean±s.d. *P<0.05. One-way ANOVA with a post-hoc test was performed.

References

    1. Sims N. A. & Martin T. J. Coupling the activities of bone formation and resorption: a multitude of signals within the basic multicellular unit. BoneKEy Rep. 3, 481 (2014). - PMC - PubMed
    1. Rachner T. D., Khosla S. & Hofbauer L. C. Osteoporosis: now and the future. Lancet 377, 1276–1287 (2011). - PMC - PubMed
    1. Zaidi M. Skeletal remodeling in health and disease. Nature Med. 13, 791–801 (2007). - PubMed
    1. Martin T. J. & Sims N. A. Osteoclast-derived activity in the coupling of bone formation to resorption. Trends Mol. Med. 11, 76–81 (2005). - PubMed
    1. Irie N. et al. Bidirectional signaling through ephrinA2-EphA2 enhances osteoclastogenesis and suppresses osteoblastogenesis. J. Biol. Chem. 284, 14637–14644 (2009). - PMC - PubMed

Publication types

MeSH terms