. 2016 May-Jun;49(3):323-36.
doi: 10.1016/j.jelectrocard.2016.02.014. Epub 2016 Feb 20.

Spatial organization of acute myocardial ischemia

Affiliations

Spatial organization of acute myocardial ischemia

Kedar Aras et al. J Electrocardiol. 2016 May-Jun.

Abstract

Introduction: Myocardial ischemia is a pathological condition initiated by supply and demand imbalance of the blood to the heart. Previous studies suggest that ischemia originates in the subendocardium, i.e., that nontransmural ischemia is limited to the subendocardium. By contrast, we hypothesized that acute myocardial ischemia is not limited to the subendocardium and sought to document its spatial distribution in an animal preparation. The goal of these experiments was to investigate the spatial organization of ischemia and its relationship to the resulting shifts in ST segment potentials during short episodes of acute ischemia.

Methods: We conducted acute ischemia studies in open-chest canines (N=19) and swines (N=10), which entailed creating carefully controlled ischemia using demand, supply or complete occlusion ischemia protocols and recording intramyocardial and epicardial potentials. Elevation of the potentials at 40% of the ST segment between the J-point and the peak of the T-wave (ST40%) provided the metric for local ischemia. The threshold for ischemic ST segment elevations was defined as two standard deviations away from the baseline values.

Results: The relative frequency of occurrence of acute ischemia was higher in the subendocardium (78% for canines and 94% for swines) and the mid-wall (87% for canines and 97% for swines) in comparison with the subepicardium (30% for canines and 22% for swines). In addition, acute ischemia was seen arising throughout the myocardium (distributed pattern) in 87% of the canine and 94% of the swine episodes. Alternately, acute ischemia was seen originating only in the subendocardium (subendocardial pattern) in 13% of the canine episodes and 6% of the swine episodes (p<0.05).

Conclusions: Our findings suggest that the spatial distribution of acute ischemia is a complex phenomenon arising throughout the myocardial wall and is not limited to the subendocardium.

Keywords: Acute myocardial ischemia; Spatial organization; Subendocardium; Subepicardium.


Figures

Figure 1
Figure 1
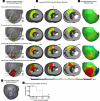
Experiment setup: (a) Experiment setup, (b) sample study protocol, (c) sample epicardial and intramural electrograms, (d) ischemia threshold based on localized ST40% potential. (e) schematic of subendocardial and distributed patterns of ischemia localization
Figure 2
Figure 2
Canine ventricular response to complete occlusion demonstrating that acute ischemia arises throughout the myocardium including the subendocardium, mid-wall and sub-epicardium. A) Intramural ST40% potential difference map (ischemic volume). B) Intramural ST40% potential difference map (surface distribution) corresponding to the three axial slices (S1, S2, S3) in panel A. C) Epicardial ST40% potential difference map. D) Canine heart with location of the plunge needles. E) Complete occlusion study protocol. The rows correspond to the time points during the ischemic episode and marked in panel E: a) control, b) 15 seconds into the intervention, c) 30 seconds into the intervention, and d) 180 seconds into the intervention.
Figure 3
Figure 3
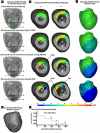
Canine ventricular response to supply ischemia @ 172 BPM showing that acute ischemia arises throughout the myocardium and in this instance the subendocardium and the mid-wall region. A) Intramural ST40% potential difference map (ischemic volume). B) Intramural ST40% potential difference map (surface distribution), corresponding to the two axial slices (S1, S2) in panel A. C) Epicardial ST40% potential difference map. D) Canine heart with location of the plunge needles. E) Supply ischemia study protocol. The rows correspond to the time points during the ischemic episode and marked in panel E: a) control, b) 255 seconds into the intervention, c) 270 seconds into the intervention, and d) 480 seconds into the intervention.
Figure 4
Figure 4
Canine ventricular response to demand ischemia @ 50% perfusion deficit showing that acute ischemia arises throughout the myocardium and in this instance the subendocardium and the mid-wall region. A) Intramural ST40% potential difference map (ischemic volume). B) Intramural ST40% potential difference map (surface distribution), corresponding to the two axial slices (S1, S2) in panel A. C) Epicardial ST40% potential difference map. D) Canine heart with location of the plunge needles. E) Demand ischemia study protocol. The rows correspond to the time points during the ischemic episode and marked in panel E: a) control, b) 240 seconds into the intervention, c) 320 seconds into the intervention, and d) 480 seconds into the intervention.
Figure 5
Figure 5
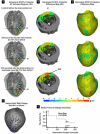
Swine ventricular response to supply ischemia @ 133 BPM demonstrating that acute ischemia is not always localized in the subendocardium and in this instance arises in the mid-wall region. A) Intramural ST40% potential difference map (ischemic volume). B) Intramural ST40% potential difference map (surface distribution), corresponding to the axial slice (S1) in panel A. C) Epicardial ST40% potential difference map. D) Swine heart with location of the plunge needles. E) Supply ischemia study protocol. The rows correspond to the time points during the ischemic episode and marked in panel E: a) control, b) 255 seconds into the intervention, and c) 270 seconds into the intervention.
Figure 6
Figure 6
Statistical summary of ischemia distribution across all canine studies demonstrating higher frequency of spatial distribution in the subendocardium and mid-wall regions relative to the subepicardial region. In addition, the distributed pattern of ischemia is the dominant pattern regardless of the type and severity of ischemia. The histograms quantify the relative frequency of occurrence of acute ischemia in each of the three defined regions as well as the two overlapping regions for A) cumulative, B) demand ischemia, and C) supply ischemia episodes. D) The histograms of relative frequency of occurrence of acute ischemia grouped by subendocardial or distributed pattern of localization (cumulative). The figures capture a total of 100 episodes of ischemia in canines.
Figure 7
Figure 7
Statistical summary of ischemia distribution across all swine studies demonstrating higher frequency of spatial distribution in the subendocardium and mid-wall regions relative to the subepicardial region. In addition, the distributed pattern of ischemia is the dominant pattern regardless of the type and severity of ischemia. The histograms quantify the relative frequency of occurrence of acute ischemia in each of the three defined regions as well as the two overlapping regions for A) cumulative, B) demand ischemia, and C) supply ischemia episodes. D) The histograms of relative frequency of occurrence of acute ischemia grouped by subendocardial or distributed pattern of localization (cumulative). The figures capture a total of 36 episodes of ischemia in swines.

References

    1. Gorgels A. ST elevation and non-ST elevation acute coronary syndromes: Should the guidelines be changed? Journal of Electrocardiology. 2013;46(4):318–323. - PubMed
    1. O'Rourke R, O'Gara P. Hurst's the Heart - Diagnosis and Management of Patients with CID. McGraw-Hill; New York: 2010. 1em plus 0.5em minus 0.4em.
    1. Reimer K, Jennings R. Myocardial ischemia, hypoxia and mi. In: Fozzard H, et al., editors. The Heart and Cardiovascular System. Raven Press; New York: 1986. pp. 1133–2101. 1em plus 0.5em minus 0.4em.
    1. Kleber A, Janse M, van Capelle F, Durrer D. Mechanism and time course of ST and TQ segment changes during acute regional myocardial ischemia in the pig heart determined by extracellular and intracellular recordings. Circulation Research. 1978;42:603–613. - PubMed
    1. Kubota I, Yamaki M, Shibata T, Ikeno E, Hosoya Y, Tomoike H. Role of ATP-sensitive channel on ECG ST segment elevation during a bout of myocardial ischemia. Circulation. 1993;88:1845–1851. - PubMed

Publication types

LinkOut - more resources