

Early Prediction and Evaluation of Breast Cancer Response to Neoadjuvant Chemotherapy Using Quantitative DCE-MRI
- PMID: 26947876
- PMCID: PMC4800060
- DOI: 10.1016/j.tranon.2015.11.016
Early Prediction and Evaluation of Breast Cancer Response to Neoadjuvant Chemotherapy Using Quantitative DCE-MRI
Abstract
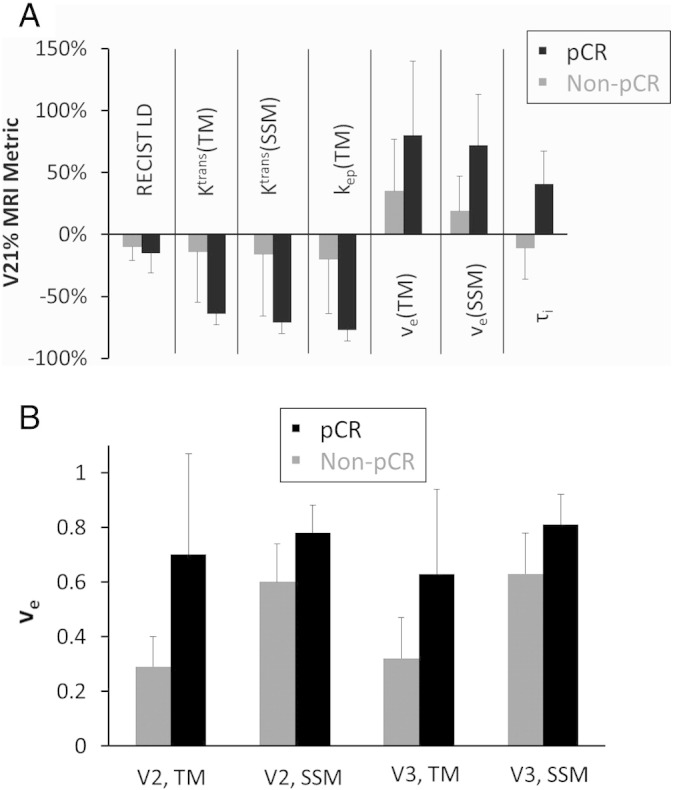
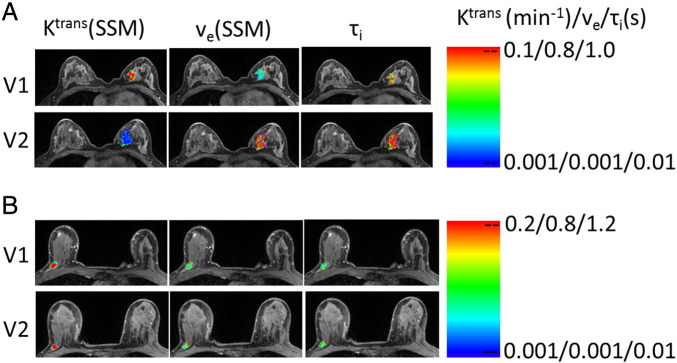
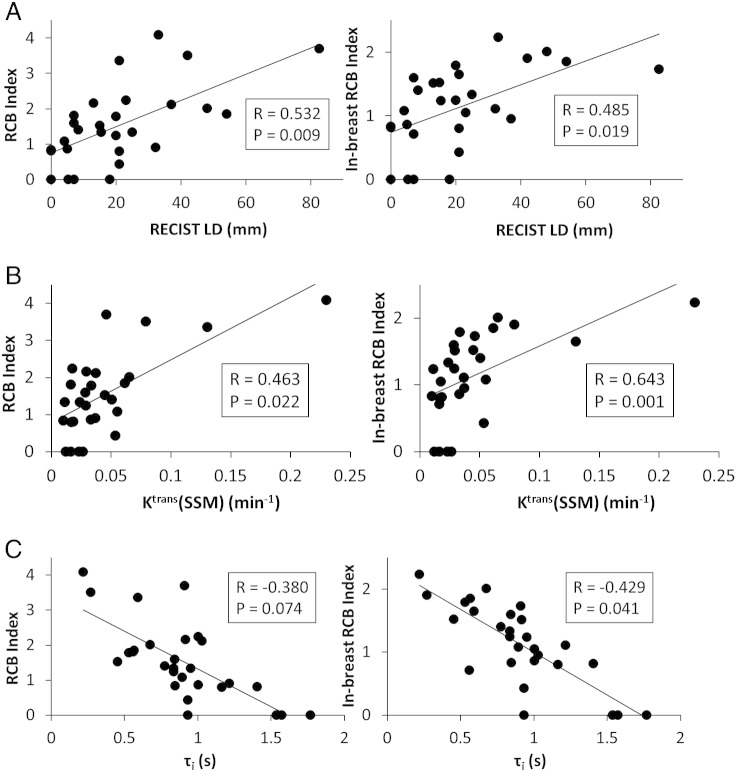
The purpose is to compare quantitative dynamic contrast-enhanced (DCE) magnetic resonance imaging (MRI) metrics with imaging tumor size for early prediction of breast cancer response to neoadjuvant chemotherapy (NACT) and evaluation of residual cancer burden (RCB). Twenty-eight patients with 29 primary breast tumors underwent DCE-MRI exams before, after one cycle of, at midpoint of, and after NACT. MRI tumor size in the longest diameter (LD) was measured according to the RECIST (Response Evaluation Criteria In Solid Tumors) guidelines. Pharmacokinetic analyses of DCE-MRI data were performed with the standard Tofts and Shutter-Speed models (TM and SSM). After one NACT cycle the percent changes of DCE-MRI parameters K(trans) (contrast agent plasma/interstitium transfer rate constant), ve (extravascular and extracellular volume fraction), kep (intravasation rate constant), and SSM-unique τi (mean intracellular water lifetime) are good to excellent early predictors of pathologic complete response (pCR) vs. non-pCR, with univariate logistic regression C statistics value in the range of 0.804 to 0.967. ve values after one cycle and at NACT midpoint are also good predictors of response, with C ranging 0.845 to 0.897. However, RECIST LD changes are poor predictors with C = 0.609 and 0.673, respectively. Post-NACT K(trans), τi, and RECIST LD show statistically significant (P < .05) correlations with RCB. The performances of TM and SSM analyses for early prediction of response and RCB evaluation are comparable. In conclusion, quantitative DCE-MRI parameters are superior to imaging tumor size for early prediction of therapy response. Both TM and SSM analyses are effective for therapy response evaluation. However, the τi parameter derived only with SSM analysis allows the unique opportunity to potentially quantify therapy-induced changes in tumor energetic metabolism.
Copyright © 2016 The Authors. Published by Elsevier Inc. All rights reserved.
Figures
References
-
- Hayes DF, Schott AF. Neoadjuvant chemotherapy: what are the benefits for the patient and for the investigator? J Natl Cancer Inst Monogr. 2015;2015:36–39. - PubMed
-
- Schott AF, Hayes DF. Defining the benefits of neoadjuvant chemotherapy for breast cancer. J Clin Oncol. 2012;30:1747–1749. - PubMed
-
- Fisher B, Bryant J, Wolmark N, Mamounas E, Brown A, Fisher ER. Effect of preoperative chemotherapy on the outcome of women with operable breast cancer. J Clin Oncol. 1998;16:2672–2685. - PubMed
-
- Mauri D, Pavlidis N, Ioannidis JP. Neoadjuvant versus adjuvant systemic treatment in breast cancer: a meta-analysis. J Natl Cancer Inst. 2005;97:188–194. - PubMed
-
- Redden MH, Fuhrman GM. Neoadjuvant chemotherapy in the treatment of breast cancer. Surg Clin North Am. 2013;93:493–499. - PubMed
Grants and funding
LinkOut - more resources
Full Text Sources
Other Literature Sources
Medical
Research Materials
