. 2016 Apr;37(4):505-18.
doi: 10.1038/aps.2015.148. Epub 2016 Mar 7.

Hyperoside induces both autophagy and apoptosis in non-small cell lung cancer cells in vitro

Affiliations

Hyperoside induces both autophagy and apoptosis in non-small cell lung cancer cells in vitro

Ting Fu et al. Acta Pharmacol Sin. 2016 Apr.

Abstract

Aim: Hyperoside (quercetin-3-O-β-D-galactopyranoside) is a flavonol glycoside found in plants of the genera Hypericum and Crataegus, which exhibits anticancer, anti-oxidant, and anti-inflammatory activities. In this study we investigated whether autophagy was involved in the anticancer mechanisms of hyperoside in human non-small cell lung cancer cells in vitro.

Methods: Human non-small cell lung cancer cell line A549 was tested, and human bronchial epithelial cell line BEAS-2B was used for comparison. The expression of LC3-II, apoptotic and signaling proteins was measured using Western blotting. Autophagosomes were observed with MDC staining, LC3 immunocytochemistry, and GFP-LC3 fusion protein techniques. Cell viability was assessed using MTT assay.

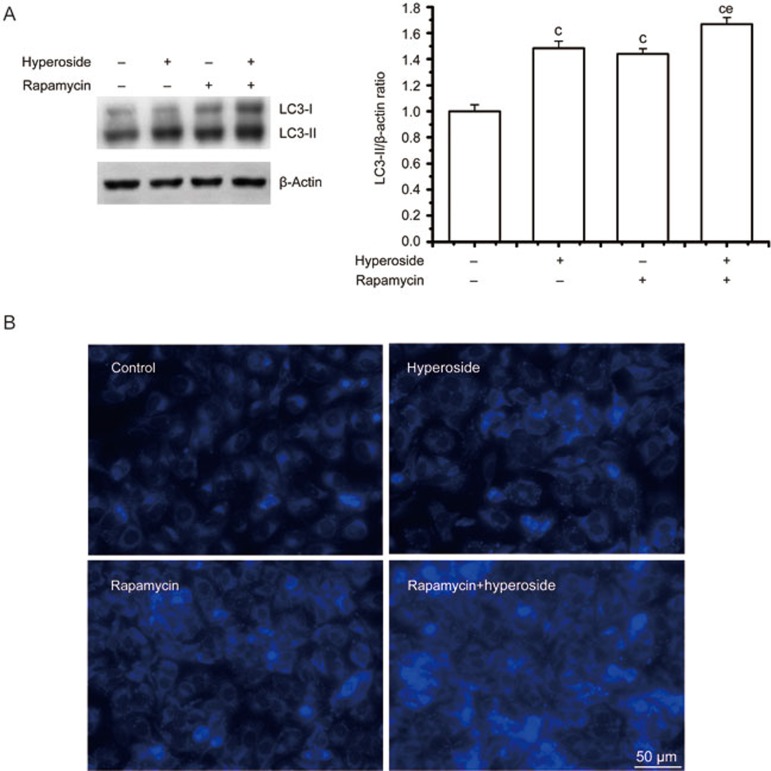
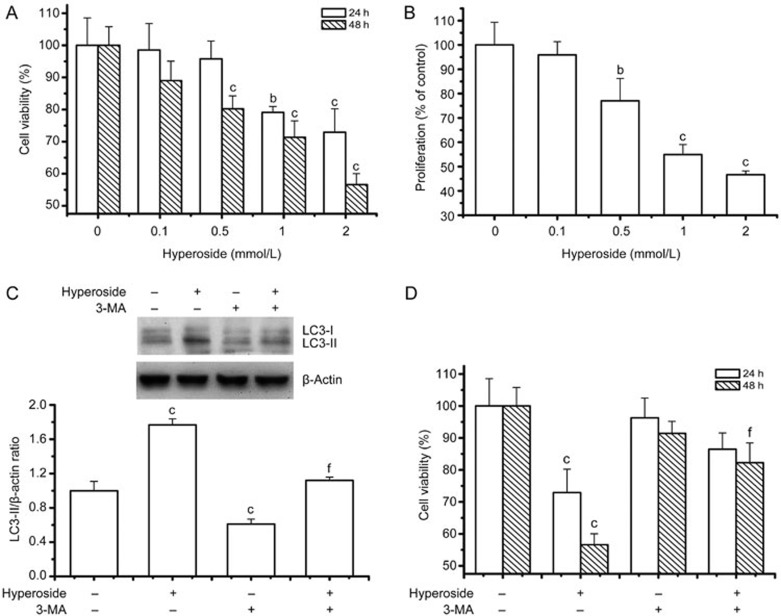
Results: Hyperoside (0.5, 1, 2 mmol/L) dose-dependently increased the expression of LC3-II and autophagosome numbers in A549 cells, but had no such effects in BEAS-2B cells. Moreover, hyperoside dose-dependently inhibited the phosphorylation of Akt, mTOR, p70S6K and 4E-BP1, but increased the phosphorylation of ERK1/2 in A549 cells. Insulin (200 nmol/L) markedly enhanced the phosphorylation of Akt and decreased LC3-II expression in A549 cells, which were reversed by pretreatment with hyperoside, whereas the MEK1/2 inhibitor U0126 (20 μmol/L) did not blocked hyperoside-induced LC3-II expression. Finally, hyperoside dose-dependently suppressed the cell viability and induced apoptosis in A549 cells, which were significantly attenuated by pretreatment with the autophagy inhibitor 3-methyladenine (2.5 mmol/L).

Conclusion: Hyperoside induces both autophagy and apoptosis in human non-small cell lung cancer cells in vitro. The autophagy is induced through inhibiting the Akt/mTOR/p70S6K signal pathways, which contributes to anticancer actions of hyperoside.


Figures

Figure 1
Figure 1
Hyperoside induces autophagy in human non-small cell lung cancer cell lines A549. (A) Conversions of LC3-Ι to LC3-II were determined by Western blotting with an antibody against LC3A/B after A549 cells were treated with various concentrations of hyperoside for 48 h. β-Actin was a loading control. The bar chart shows semiquantitative analysis of LC3-II levels relative to actin using three independent experiments. (B) A549 cells treated with 2 mmol/L hyperoside for 6–48 h were analyzed by Western blotting with antibodies against LC3 A/B and β-actin. The bar chart shows semiquantitative analysis of LC3-II levels relative to actin using three independent experiments. (C) Monodansycadaverine (MDC) staining. A549 cells treated with hyperoside (2 mmol/L) for 48 h were incubated with MDC (0.05 mmol/L) for 20 min and observed under a fluorescence microscope. Inserts are high magnification micrographs of the boxed regions (scale bar, 10 μm). (D) A549 cells treated with various concentrations of hyperoside for 48 h were analyzed by immunoblotting with antibodies against p62 and β-actin. The bar chart shows semiquantitative analysis of p62 levels relative to actin using three independent experiments. (E) A549 cells transfected with GFP-LC3 expression vector for 4 h were subsequently treated with hyperoside (2 mmol/L) for 48 h. The GFP-LC3 dots induced by hyperoside in A549 cells were observed with a confocal microscope. (F) A549 cells treated with 2 mmol/L hyperoside for 48 h were stained with antibodies against LC3A/B. They were analyzed with confocal microscopy. Inserts are high magnification micrographs of the boxed regions (scale bar, 10 μm). The data are expressed as the mean±SEM of 3 independent experiments. cP<0.01 compared with the control group.
Figure 2
Figure 2
Hyperoside induced autophagic flux in a human non-small cell lung cancer cell line. (A) A549 cells treated with hyperoside (2 mmol/L) with or without E64d (10 μg/mL) and pepstatin A (10 μg/mL) were analyzed by immunoblotting with antibodies against LC3A/B and β-actin. The bar chart shows semiquantitative analysis of LC3 levels relative to β-actin using three independent experiments. (B) A549 cells transfected with GFP-LC3 expression vector for 24 h were treated with (2 mmol/L) hyperoside for 48 h. Conversions of GFP-LC3 and endogenous LC3 were determined by Western blotting. β-Actin was a loading control. The data are expressed as the mean±SEM of 3 independent experiments. cP<0.01 compared with the control group. eP<0.05 compared with the E64d and pepstatin A group.
Figure 3
Figure 3
Hyperoside inhibits the Akt/mTOR/p70S6 signaling pathway and activates ERK1/2 signaling in A549 cells. A549 cells treated with hyperoside (0.5, 1, and 2 mmol/L) for 24 h were analyzed by Western blotting against phospho-p70S6K (Thr389) and total p70S6K (A), phospho-4E-BP1 (Thr37/46) and total 4E-BP1 (B), phospho-mTOR (Ser2448) and total mTOR (C), phospho-Akt (Ser473) and total Akt (D), and phospho-ERK1/2 and total ERK1/2 (E). β-Actin was a loading control. Group data showing normalized phosphorylated or total kinases to β-Actin were determined in each group of three experiments. (F) A549 cells treated with 2 mmol/L hyperoside for 6, 12, or 24 h were analyzed by immunoblotting for levels of phospho-mTOR and phospho-p70S6K. β-actin was a loading control. The data are expressed as the mean±SEM of 3 independent experiments. bP<0.05, cP<0.01 compared with the control group.
Figure 4
Figure 4
Hyperoside-induced autophagy is dependent on the PI3K/Akt/mTOR pathway. (A and B) A549 cells treated with hyperoside (2 mmol/L) for 4 h followed by treatment with or without 200 nmol/L insulin for 30 min were analyzed by Western blotting against phospho-Akt (A) or LC3A/B (B). Group data showing normalized phosphorylated Akt or LC3-II to β-actin were determined in each group of three experiments. The data are expressed as the mean±SEM. cP<0.01 compared with the control group. fP<0.01 compared with insulin group. (C and D) A549 cells treated with hyperoside (2 mmol/L), 30 μmol/L triciribine, or hyperoside (2 mmol/L) with 30 μmol/L triciribine for 12 h were analyzed by immunoblotting against phospho-Akt (C) or LC3A/B (D). Group data showing normalized phosphorylated Akt or LC3-II to β-actin were determined in each group of three experiments. The data are expressed as the mean±SEM. bP<0.05, cP<0.01 compared with the control group. fp<0.01 compared with triciribine group. (E and F) A549 cells treated with 2 mmol/L hyperoside with or without 20 μmol/L U0126 for 12 h were analyzed by immunoblotting using antibodies against phospho-ERK (E) or LC3A/B (F). Group data showing normalized phosphorylated ERK or LC3A/B to β-actin were determined in each group of three experiments. The data are expressed as the mean±SEM. cP<0.01 compared with the control group. fP<0.01 compared with hyperoside group.
Figure 5
Figure 5
Rapamycin treatment with hyperoside shows an enhancement of autophagy. (A) A549 cells treated with rapamycin (1 μmol/L) with or without 2 mmol/L hyperoside for 48 h were analyzed by Western blotting with antibodies against LC3A/B and β-actin. The bar chart shows the LC3-II/actin ratio using three independent experiments. The data are expressed as the mean±SEM of 3 independent experiments. cP<0.01 compared with the control group. eP<0.05 compared with the single treatment of hyperoside. (B) A549 cells treated with hyperoside (2 mmol/L) with or without rapamycin (1 μmol/L) for 48 h were incubated with MDC (0.05 mmol/L) for 20 min and observed under a fluorescence microscope.
Figure 6
Figure 6
Autophagy is involved in hyperoside-induced A549 cell death. (A) A549 cells (5×10³ cells/well in 96-well plate) were treated with different concentrations of hyperoside (0.1, 0.5, 1, and 2 mmol/L) for 24 h or 48 h. Cell viability was analyzed by the MTT assay. (B) After A549 cells (5×10³ cells/well in 96-well plate) were treated with different concentrations of hyperoside (0.1, 0.5, 1, and 2 mmol/L) for 48 h, cell proliferation was measured using the BrdU incorporation assay. (C and D) A549 cells were pretreated with 2.5 mmol/L 3-MA for 1 h before the addition of 2 mmol/L hyperoside for an additional incubation of 24 or 48 h. Cellular proteins of the 48 h treatment sample were lysed and subjected to Western blot analysis with an anti-LC3A/B antibody. The bar chart showed LC3-II/β-actin ratio using three independent experiments (C). Cell viability was analyzed by the MTT assay (D). The data are expressed as the mean±SEM of 3 independent experiments. bP<0.05, cP<0.01 compared with the control group. fP<0.01 compared with the single treatment with hyperoside (2 mmol/L).
Figure 7
Figure 7
Inhibition of autophagy reduced hyperoside-induced apoptotic cell death. (A) A549 cells were treated with hyperoside (0.5, 1 or 2 mmol/L) for 48 h and analyzed with immunoblotting for levels of caspase-3 and cleaved caspase-3. The bar chart shows semiquantitative analysis of caspase-3 or cleaved caspase-3 to β-actin using three independent experiments. (B) A549 cells were treated with hyperoside (0.5, 1 or 2 mmol/L) for 48 h and analyzed with immunoblotting for cleaved PARP. The bar chart shows semiquantitative analysis of cleaved PARP. (C) A549 cells were treated with hyperoside (2 mmol/L) with or without 3-MA (2 mmol/L) for 48 h and analyzed with immunoblotting for cleaved caspase-3 and cleaved PARP. The bar chart shows cleaved caspase-3 or cleaved PARP/β-actin ratio. The data are expressed as the mean±SEM of 3 independent experiments. bP<0.05, cP<0.01 compared with the control group. fP<0.01 compared with the single treatment with hyperoside (2 mmol/L). (D) A549 cells treated with hyperoside (2 mmol/L) with or without 3-MA (2 mmol/L) for 48 h were incubated with MDC (0.05 mmol/L) for 20 min and observed under a fluorescence microscope.
Figure 8
Figure 8
Effect of hyperoside on autophagy in human bronchial epithelial cells BEAS-2B. (A) Conversions of LC3-Ι to LC3-II were determined by Western blotting with an antibody against LC3A/B after BEAS-2B cells were treated with various concentrations of hyperoside for 48 h. β-actin was a loading control. The bar chart shows semiquantitative analysis of LC3-II levels relative to β-actin using three independent experiments. The data are expressed as the mean±SEM of 3 independent experiments. (B) BEAS-2B cells treated with hyperoside (2 mmol/L) for 48 h were incubated with MDC (0.05 mmol/L) for 20 min and observed under a fluorescence microscope.

Similar articles

Cited by

References

    1. Yuan J, Horvitz HR. A first insight into the molecular mechanisms of apoptosis. Cell 2004; 116: S53–6, 1 p following S59. - PubMed
    1. Nicholson DW, Ali A, Thornberry NA, Vaillancourt JP, Ding CK, Gallant M, et al. Identification and inhibition of the ICE/CED-3 protease necessary for mammalian apoptosis. Nature 1995; 376: 37–43. - PubMed
    1. Farias A, Cabrerizo M, Re V, Glatstein N, Pisano B, Spinsanti L, et al. Molecular identification of human enteroviruses in children with neurological infections from the central region of Argentina. Arch Virol 2011; 156: 129–33. - PubMed
    1. Liang XH, Jackson S, Seaman M, Brown K, Kempkes B, Hibshoosh H, et al. Induction of autophagy and inhibition of tumorigenesis by beclin 1. Nature 1999; 402: 672–6. - PubMed
    1. Eisenberg-Lerner A, Bialik S, Simon HU, Kimchi A. Life and death partners: apoptosis, autophagy and the cross-talk between them. Cell Death Differ 2009; 16: 966–75. - PubMed

Publication types

MeSH terms