. 2016 Mar 7:7:10905.
doi: 10.1038/ncomms10905.

Microglial P2Y12 is necessary for synaptic plasticity in mouse visual cortex

Affiliations

Microglial P2Y12 is necessary for synaptic plasticity in mouse visual cortex

G O Sipe et al. Nat Commun. .

Abstract

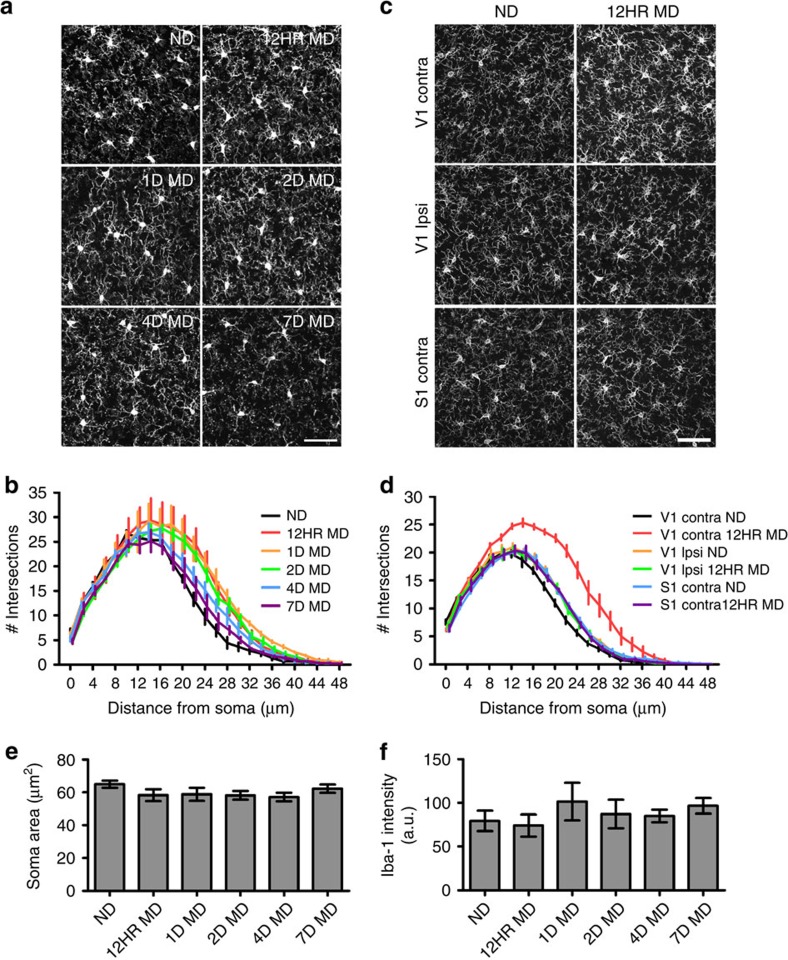
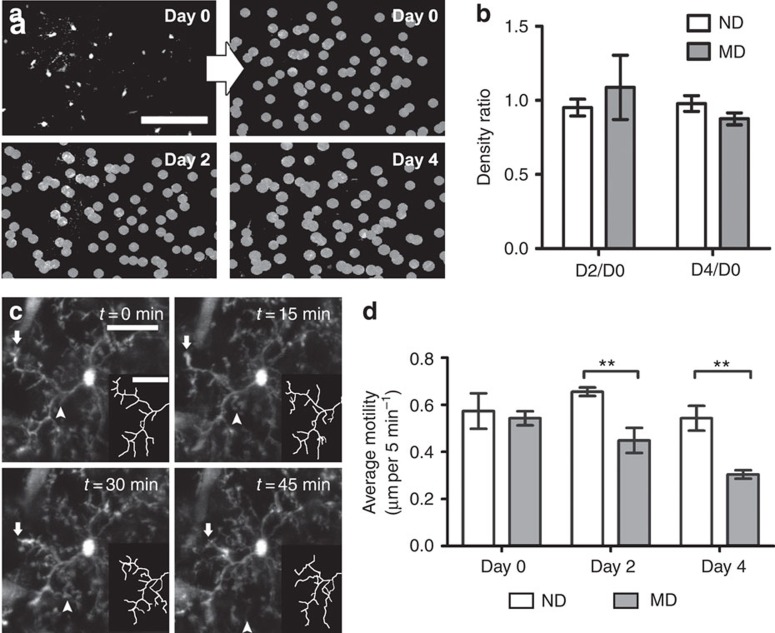
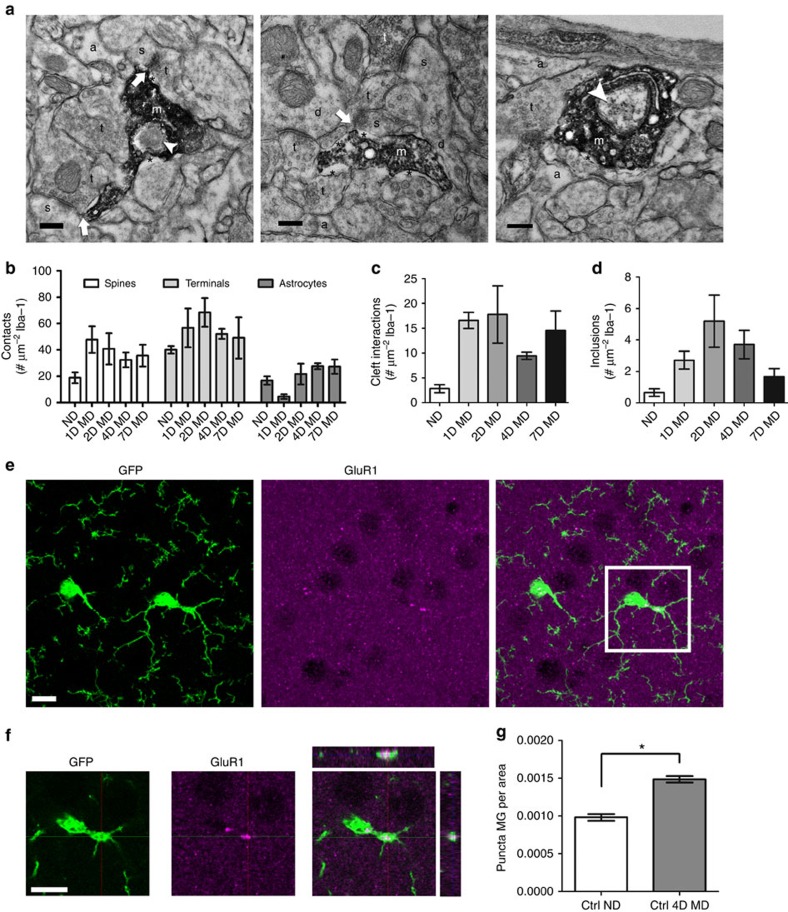
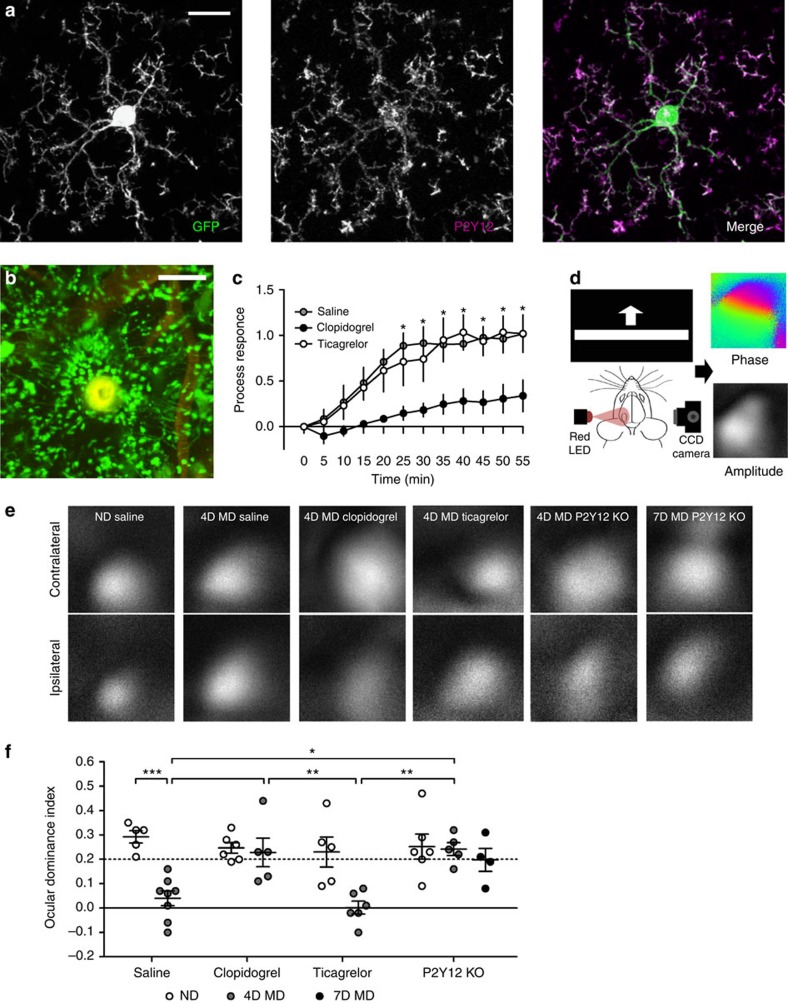
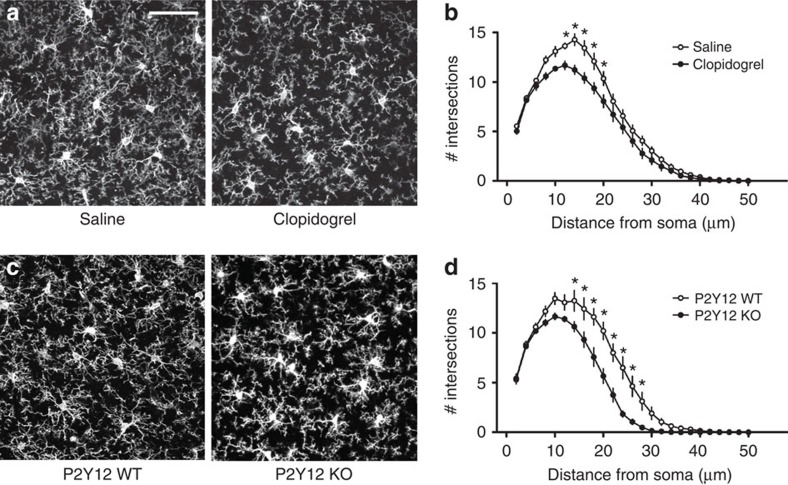
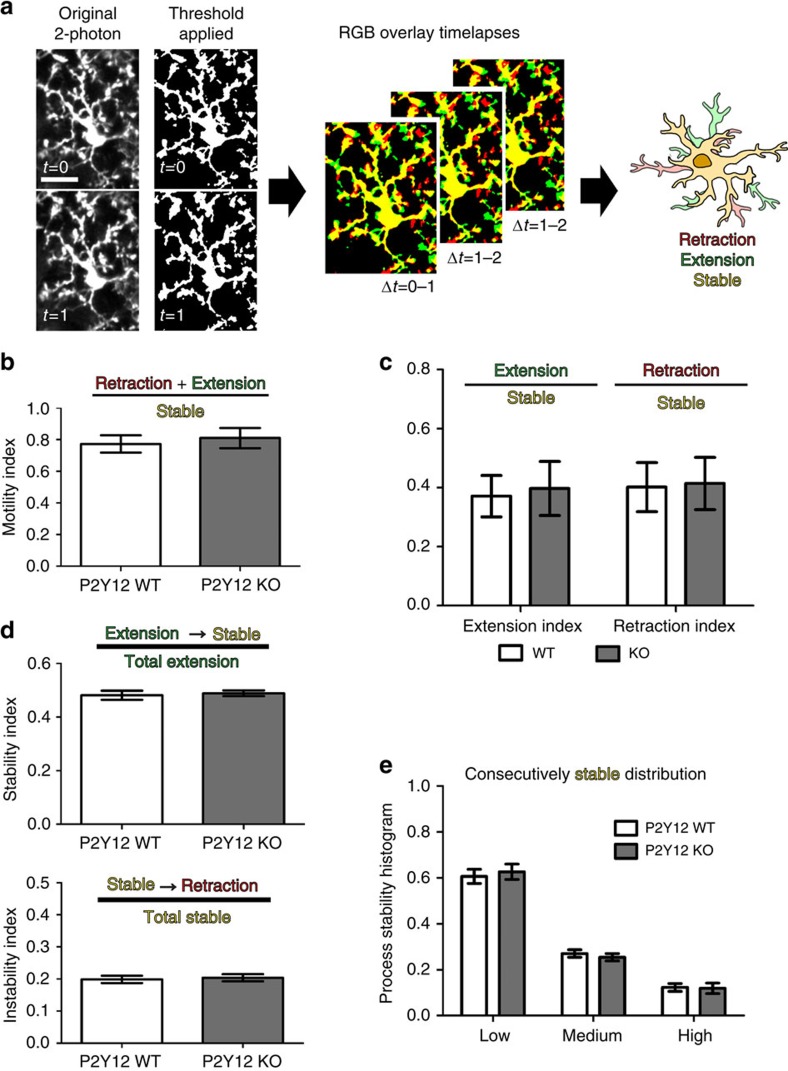
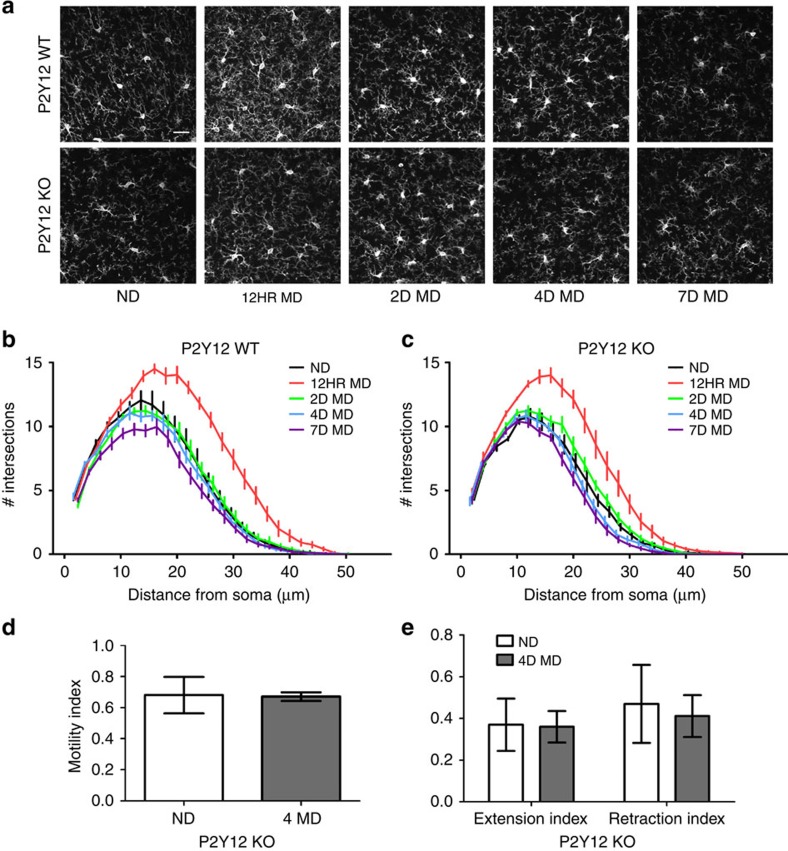
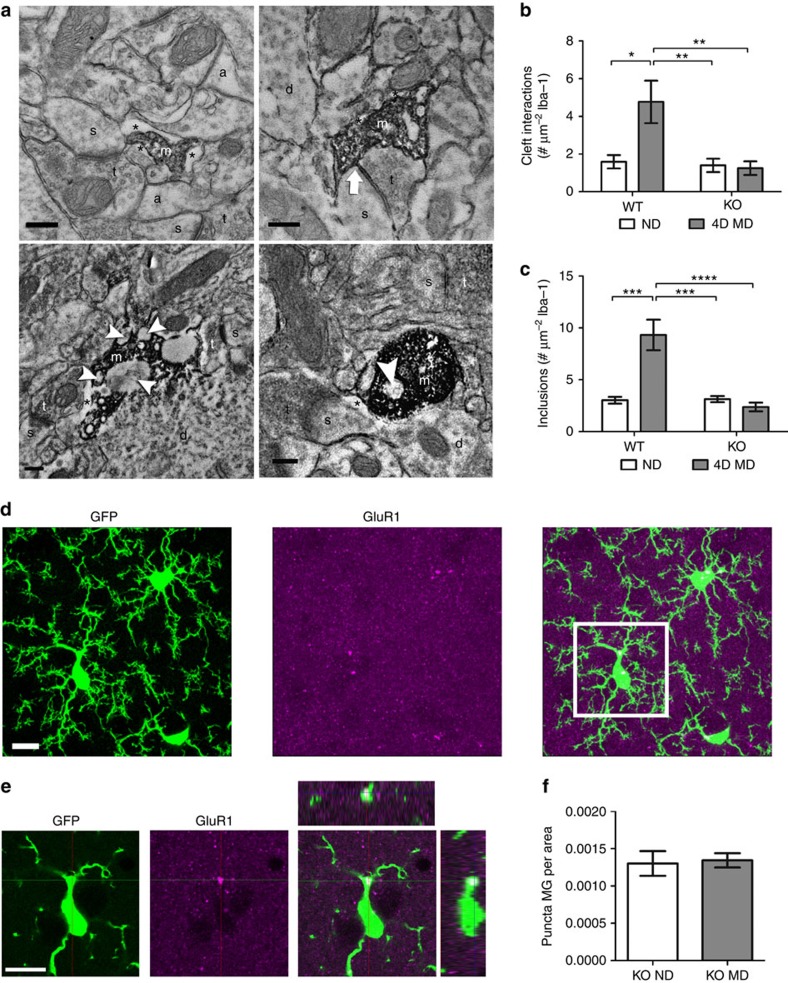
Microglia are the resident immune cells of the brain. Increasingly, they are recognized as important mediators of normal neurophysiology, particularly during early development. Here we demonstrate that microglia are critical for ocular dominance plasticity. During the visual critical period, closure of one eye elicits changes in the structure and function of connections underlying binocular responses of neurons in the visual cortex. We find that microglia respond to monocular deprivation during the critical period, altering their morphology, motility and phagocytic behaviour as well as interactions with synapses. To explore the underlying mechanism, we focused on the P2Y12 purinergic receptor, which is selectively expressed in non-activated microglia and mediates process motility during early injury responses. We find that disrupting this receptor alters the microglial response to monocular deprivation and abrogates ocular dominance plasticity. These results suggest that microglia actively contribute to experience-dependent plasticity in the adolescent brain.


Figures

Figure 1
Figure 1. Rapid morphological changes of microglia during MD.
(a) Images showing Iba-1 immunoreactive microglia in fixed sections of binocular visual cortex at different times following MD (MD, monocular deprivation; ND, non-deprived). (b) Sholl analysis of microglia at different time points following MD. Note the hyper-ramification occurring following 12 h of contralateral eye closure (n=3–4, two-way ANOVA, P<0.0001, F(5,40)=26.25; see Supplementary Table 1—for Holm-Sidak post hoc comparisons. Error bars were offset slightly between conditions for presentation purposes). (c) Images showing Iba-1 immunoreactive microglia in binocular visual cortex both contralateral and ipsilateral to the deprived eye, as well as primary somatosensory cortex contralateral to the deprived eye within the same animals in ND and 12 h MD conditions (note that this is a separate animal cohort from that shown in a,b,e,f). (d) Hyper-ramification is restricted to the contralateral binocular visual cortex (n=4–6, two-way ANOVA, P<0.0001, F(1,150)=379.9; see Supplementary Table 2 for Holm-Sidak post hoc comparisons. Error bars were offset slightly between conditions for presentation purposes). Scale bars, 50 μm. Soma size ((e) one-way ANOVA, P>0.05, F(5,59)=1.194) and somatic Iba-1 expression ((f) Kruskal–Wallis one-way ANOVA, P>0.05, H(5)=4.635) were not different at any time point after deprivation. Graphs show mean±s.e.m.
Figure 2
Figure 2. Microglial process motility changes after MD.
(a) Example images showing microglia in binocular visual cortex chronically imaged in vivo. Microglial cell bodies were marked in images taken at 0, 2 and 4 days to compare microglial density over time in ND and deprived (MD) mice (mice of the MD group were deprived at the end of the Day 0 imaging session). Scale bar, 100 μm. (b). Quantification of microglial density as a ratio between the density observed after 2 or 4 days (D2, D4, respectively) and the density observed on day 0 (D0) in the same animal. No significant change in microglial density was observed (n=4–8 per group, Student's t-tests, P>0.05; D2/D0: t(12)=0.6946, D4/D0: t(8)=1.565). (c) Images showing time-lapse imaging of microglial motility in the binocular visual cortex. Insets show traced portions of the microglial arbor. Notice the retraction (arrow) and extension (arrowhead) of processes on the timescale of minutes. Scale bar, 25 μm. (d) Quantification of microglial motility (including retraction and extension of processes) on Days 0, 2 and 4 in the same animals (n=5 per group). Microglia were less motile in contralateral binocular visual cortex following 2 and 4 days of MD (two-way ANOVA, P<0.001; F(1,24)=17.67; Holm-Sidak post hoc, **P<0.01; Day(0): t(24)=0.472; Day(2): t(24)=3.16; Day (4): t(24)=3.65). Graphs show mean±s.e.m.
Figure 3
Figure 3. Microglial interactions with synaptic elements are altered by MD.
(a) Representative electron micrographs of Iba-1-immunoreactive microglial processes in contralateral binocular visual cortex from 4D MD animals (a, perisynaptic astrocytic process; d, dendrite; m, microglial process; s, dendritic spine; t, axon terminal; *, extracellular space; arrow, cleft contact; arrowhead, inclusion). Scale bars, 0.2 μm. (b) No statistically significant difference was observed in the number of microglial contacts with dendritic spines, axon terminals or astrocytic processes (n=3; two-way ANOVA; P=0.14 for condition main effect; F(4,30)=1.861). (c,d) The number of microglial interactions with synaptic clefts (c) and the number of microglial inclusions (d) increase following MD (n=3; one-way ANOVA; P=0.0464; F(4,10)=3.578 (c); P=0.0421; F(4,10)=3.712 (d); no statistically significant effect was observed with post hoc analysis). (e) Images showing GFP (left panel), GluA1 immunoreactivity (middle panel) and a merge of the two (right panel) in fixed sections of contralateral binocular visual cortex of CX3CR1-GFP animals. (f) A single confocal z-plane image of the boxed area shown in e, showing internalization of GluA1-immunoreactive puncta by microglia (rightmost panel). Scale bars, 10 μm (e,f). (g) The number of internalized GluA1 puncta per unit of microglial area is increased after 4 days of MD (n=4,5; Student's t-test, P<0.0001, t(7)=7.920). Graphs show mean±s.e.m.
Figure 4
Figure 4. Microglial P2Y12 is necessary for ODP.
(a) Confocal image showing immunoreactivity for P2Y12 (middle panel) in cortical microglia (left panel) from CX3CR1GFP/+ mice (merge in right panel; P2Y12: magenta; GFP: green). Note high P2Y12 expression on the membranes of distal microglial processes. Scale bar, 10 μm. (b) In vivo two-photon image showing the microglial response 30 min following a laser-induced injury in a saline-injected mouse. The vasculature was labelled using a retro-orbital injection of 4% tetramethylrhodamine dextran (shown in red) to ensure that the blood–brain barrier was not compromised during laser injury. Scale bar, 50 μm. (c) Quantification showing a statistically significant reduction in process targeting to the injury site in clopidogrel- but not ticagrelor-treated mice (n=3 per group, two-way ANOVA; F(1,48)=122.0; P<0.05; Holm-Sidak post hoc). (d) Schematic showing the intrinsic optical signal-imaging apparatus used in our study (left panel). Cortical responses to visual stimuli (a moving vertical bar presented on a monitor 30 cm in front of the mouse) were recorded as changes in the reflectivity of 700-nm light. This allowed the collection of phase maps (top right panel) that indicate retinotopy, and amplitude maps (bottom right panel) that indicate the strength of the cortical response. Amplitude maps obtained from stimulation of each eye independently were used to compute ocular dominance. (e) Representative amplitude maps obtained from contralateral and ipsilateral eye stimulations under different conditions. (f) Quantification of ocular dominance index shows robust shifts after MD in saline- and ticagrelor-treated mice, but no shift is observed in clopidogrel-treated and P2Y12 KO animals (n=5–7 per group; two-way ANOVA; F(1,28)=7.93; P<0.05; Holm-Sidak post hoc). Graphs show mean±s.e.m.
Figure 5
Figure 5. P2Y12 disruption reduces baseline microglial ramification.
(a) Representative confocal images of microglia in the binocular visual cortex from saline and clopidogrel-treated animals. Scale bar, 50 μm. (b) Sholl analysis shows a reduction in ramification after clopidogrel treatment (n=5 per group, two-way ANOVA; P<0.05; F(1,8)=7.729). (c) Representative confocal images of microglia in P2Y12 WT and KO binocular visual cortex. (d) Microglia in P2Y12 KOs exhibit less ramification than in WT (n=4–5 per group, two-way ANOVA; F(1,7)=15.87; P<0.01; Holm-Sidak post hoc). Graphs show mean±s.e.m.
Figure 6
Figure 6. P2Y12 disruption does not affect basal microglial process motility.
(a) Schematic showing the analysis of time-lapse in vivo images for microglial motility. Images are first thresholded to remove background. Consecutive images are pseudocoloured in red or green and overlayed. Yellow pixels in the overlay images are stable between the two time points, green pixels represent newly extended processes and red pixels indicate retraction. This process is repeated for all consecutive time points during the imaging session (1 h). Scale bar, 20 μm. (be) In binocular visual cortex, no statistically significant differences were found between P2Y12 WT and KO microglia in basal motility (b), extensions and retraction indices (c), stabilization of newly extended processes and destabilization of stable processes (d) or overall process stability (n=8 per group, Student's t-test; t(14)=0.4466 (b); t(14)=0.64 and t(14)=0.29 (c); t(14)=0.3786 and t(14)=0.3132 (d), two-way ANOVA, F=0.3044; P>0.05 (e)). Graphs show mean±s.e.m.
Figure 7
Figure 7. P2Y12 disruption reduces hyper-ramification during MD.
(a) Representative confocal images showing microglia in contralateral binocular visual cortex of P2Y12 WT and KO mice before and after MD of different durations. Scale bar, 25 μm. (b) Sholl analysis confirms that microglia in P2Y12 WT animals hyper-ramify following 12 h of MD (two-way ANOVA; F(4,25)=15.21; P<0.0001). (c) Ramification also occurred after 12 h of MD in P2Y12 KOs (two-way ANOVA, F(4,25)=18.83; P<0.0001), although to a smaller extent than in P2Y12 WTs. See Supplementary Table 2 for post hoc statistical comparisons. Neither microglial motility (d) nor retraction and extension indices (e) are altered by 4D MD in P2Y12 KO mice (Student's t-test, P>0.05, t(7)=0.074 (d), t(7)=0.56, t(7)=0.14, respectively (e)). Graphs show mean±s.e.m.
Figure 8
Figure 8. P2Y12 is necessary for microglial responses during MD.
(a) Electron micrographs of Iba-1-immunoreactive microglial processes (a, astrocytic process; d, dendrite; m, microglial process; s, dendritic spine; t, terminal; *, extracellular space; arrow, cleft contact; arrowhead, inclusion) observed in P2Y12 WT (top images) and P2Y12 KO (bottom images) animals. Scale bars, 0.2 μm. (b) Quantification of microglial contacts with synaptic clefts showed significantly elevated cleft interactions following 4D MD in P2Y12 WT but not P2Y12 KO mice (n=5, P<0.05, F(1,16)=6.676; two-way ANOVA, Holm-Sidak post hoc). (c) The number of microglial inclusions was also increased in P2Y12 WT animals following deprivation but not in P2Y12 KOs (n=5, P<0.001, F (1, 16)=19.39; two-way ANOVA, Holm-Sidak post hoc). (d) Images showing GFP (left panel), GluA1 immunoreactivity (middle panel) and a merge of the two (right panel) in fixed sections of contralateral binocular visual cortex of CX3CR1-GFP/P2Y12 KO animals. (e) A single confocal z-plane image of the boxed area shown in d showing internalization of GluA1-immunoreactive puncta by microglia (rightmost panel). Scale bars, 10 μm (d,e). (f) The number of internalized GluA1 puncta per unit of microglial area does not change after 4 days of MD in P2Y12 KO mice (n=3,4, Student's t-test, t(5)=0.2373, P>0.05). Graphs show mean±s.e.m.

References

    1. Kettenmann H., Hanisch U. K., Noda M. & Verkhratsky A. Physiology of microglia. Physiol. Rev. 91, 461–553 (2011). - PubMed
    1. Davalos D. et al. ATP mediates rapid microglial response to local brain injury in vivo. Nat. Neurosci. 8, 752–758 (2005). - PubMed
    1. Nimmerjahn A., Kirchhoff F. & Helmchen F. Resting microglial cells are highly dynamic surveillants of brain parenchyma in vivo. Science 308, 1314–1318 (2005). - PubMed
    1. Schafer D. P. et al. Microglia sculpt postnatal neural circuits in an activity and complement-dependent manner. Neuron 74, 691–705 (2012). - PMC - PubMed
    1. Zhan Y. et al. Deficient neuron-microglia signaling results in impaired functional brain connectivity and social behavior. Nat. Neurosci. 17, 400–406 (2014). - PubMed

Publication types

Substances