. 2016 May;186(5):1114-27.
doi: 10.1016/j.ajpath.2015.12.017. Epub 2016 Mar 3.

Myocardial Galectin-3 Expression Is Associated with Remodeling of the Pressure-Overloaded Heart and May Delay the Hypertrophic Response without Affecting Survival, Dysfunction, and Cardiac Fibrosis

Affiliations

Myocardial Galectin-3 Expression Is Associated with Remodeling of the Pressure-Overloaded Heart and May Delay the Hypertrophic Response without Affecting Survival, Dysfunction, and Cardiac Fibrosis

Olga Frunza et al. Am J Pathol. 2016 May.

Abstract

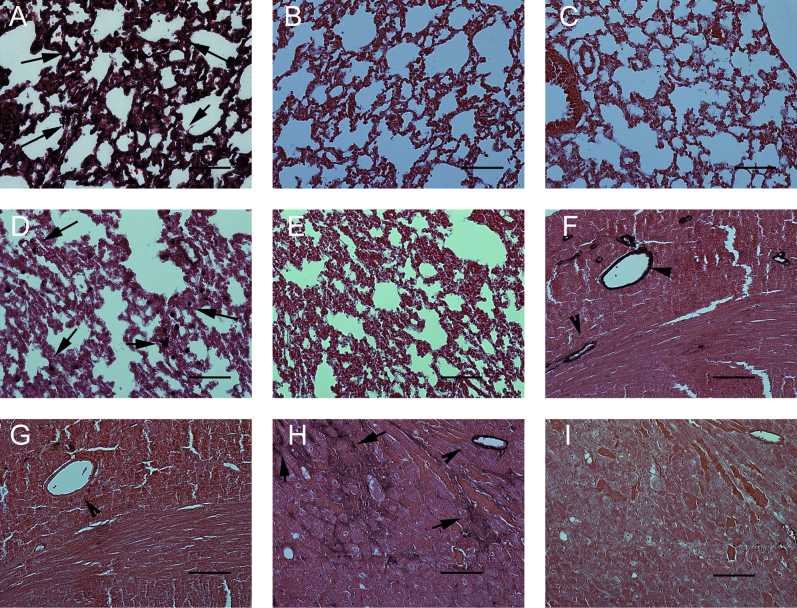
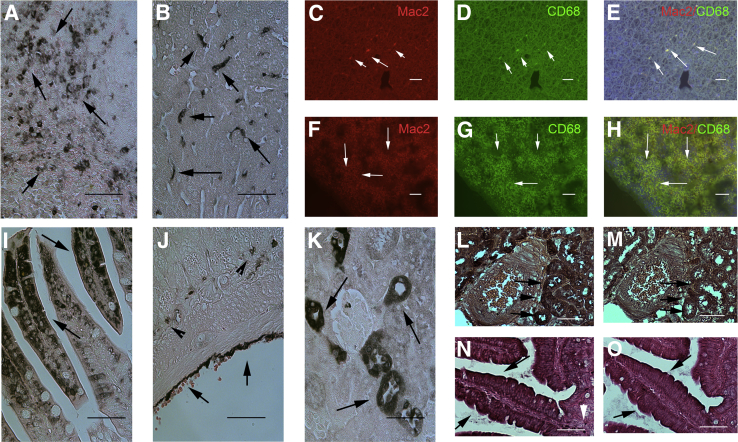
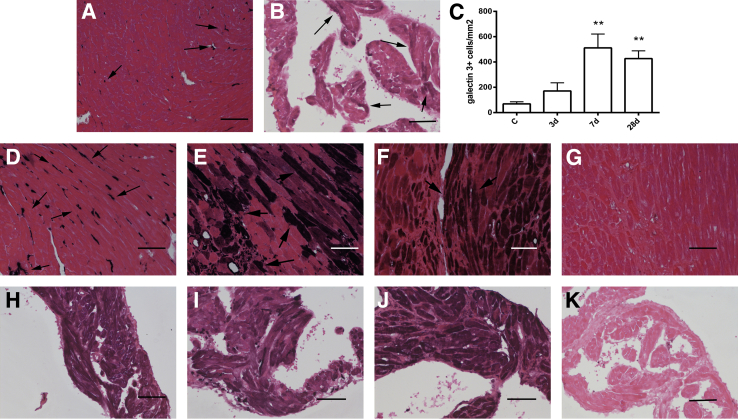
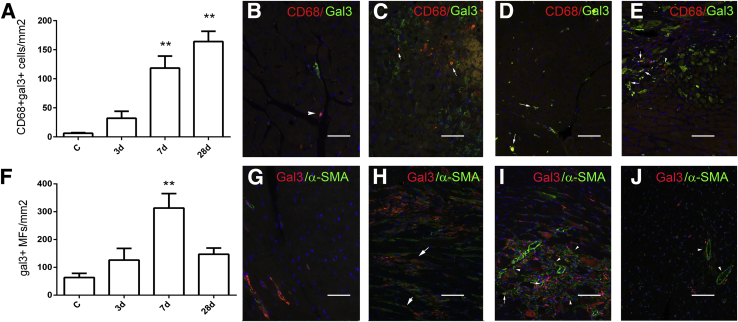
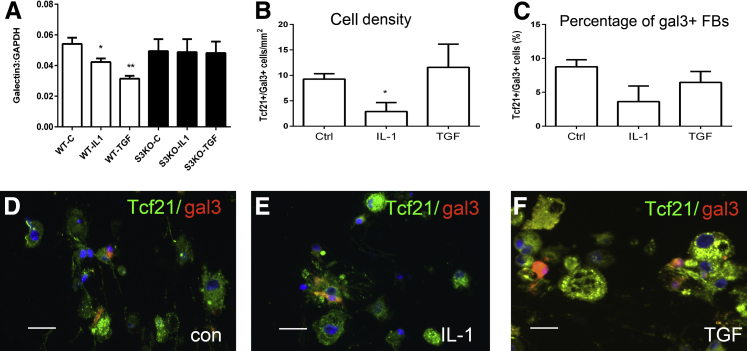
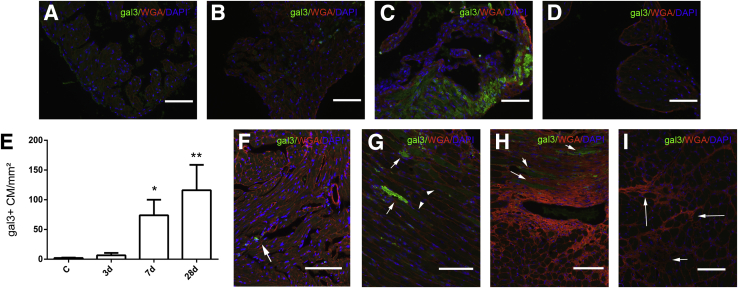
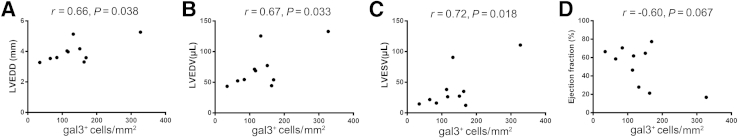
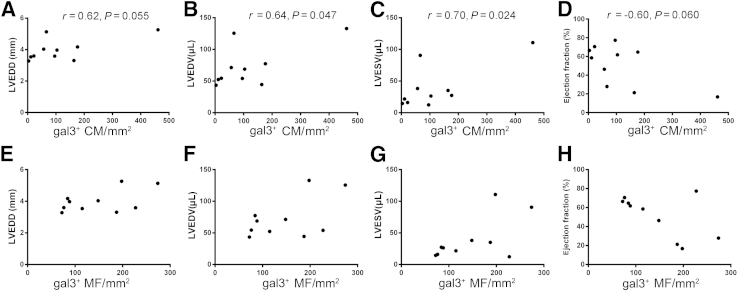
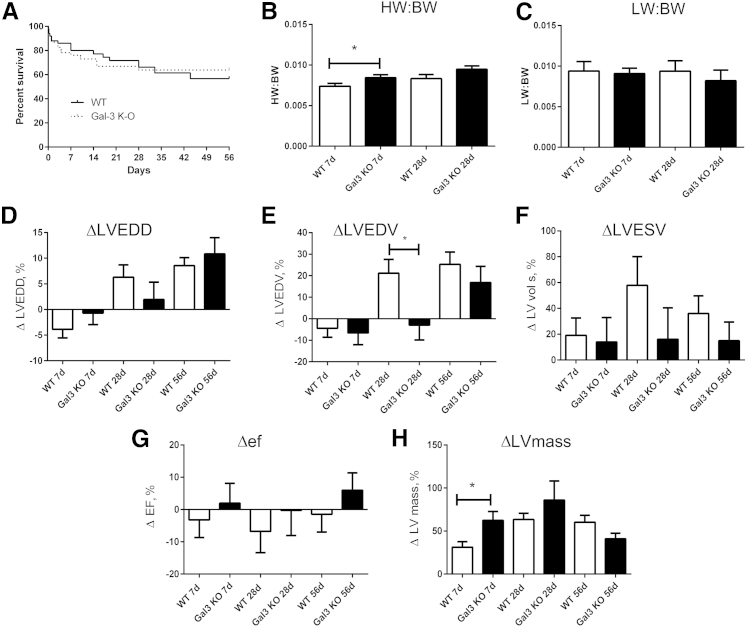
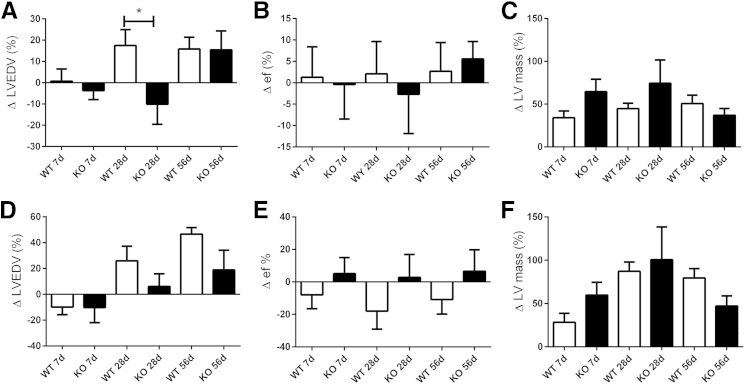
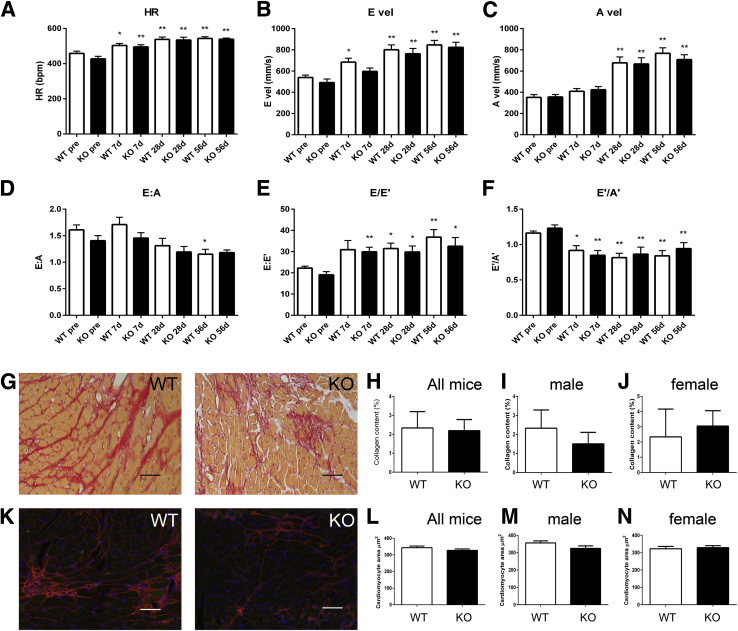
The β-galactoside-binding animal lectin galectin-3 is predominantly expressed by activated macrophages and is a promising biomarker for patients with heart failure. Galectin-3 regulates inflammatory and fibrotic responses; however, its role in cardiac remodeling remains unclear. We hypothesized that galectin-3 may be up-regulated in the pressure-overloaded myocardium and regulate hypertrophy and fibrosis. In normal mouse myocardium, galectin-3 was constitutively expressed in macrophages and was localized in atrial but not ventricular cardiomyocytes. In a mouse model of transverse aortic constriction, galectin-3 expression was markedly up-regulated in the pressure-overloaded myocardium. Early up-regulation of galectin-3 was localized in subpopulations of macrophages and myofibroblasts; however, after 7 to 28 days of transverse aortic constriction, a subset of cardiomyocytes in fibrotic areas contained large amounts of galectin-3. In vitro, cytokine stimulation suppressed galectin-3 synthesis by macrophages and cardiac fibroblasts. Correlation studies revealed that cardiomyocyte- but not macrophage-specific galectin-3 localization was associated with adverse remodeling and dysfunction. Galectin-3 knockout mice exhibited accelerated cardiac hypertrophy after 7 days of pressure overload, whereas female galectin-3 knockouts had delayed dilation after 28 days of transverse aortic constriction. However, galectin-3 loss did not affect survival, systolic and diastolic dysfunction, cardiac fibrosis, and cardiomyocyte hypertrophy in the pressure-overloaded heart. Despite its potential role as a prognostic biomarker, galectin-3 is not a critical modulator of cardiac fibrosis but may delay the hypertrophic response.


Figures

Supplemental Figure S1
Validation of the antibodies to galectin-3 (AC), CD68 (D and E), and α-SMA in mouse tissues. The Mac2 antibody was used for galectin-3 immunohistochemistry. Mac-2 intensely stains abundant cells with macrophage morphology (arrows) in lung tissue harvested from pressure-overloaded mice (after 7 days of TAC). B: Omission of the primary antibody shows no staining. A section from the lung of a galectin-3 KO mouse after 7 days of TAC shows no staining, confirming the specificity of the antibody for galectin-3. D: CD68 staining identifies numerous cells in control mouse lung. E: Omission of the primary antibody shows no staining. F: α-SMA staining in control heart labels vascular smooth muscle cells (arrowheads). G: Omission of the primary antibody shows no staining. H: In the pressure-overloaded myocardium, α-SMA staining labels both vascular smooth muscle cells (arrowhead) and interstitial myofibroblasts (arrows). I: Omission of the primary antibody shows no staining. Counterstained with eosin. Scale bar = 50 μm. KO, knockout; TAC, transverse aortic constriction; α-SMA, α-smooth muscle actin.
Figure 1
Figure 1
Galectin-3 immunohistochemistry in normal mouse tissues. A and B: In the mouse spleen (A) and liver (B), galectin-3 localizes in cells with morphologic characteristics of macrophages (arrows). CH: Dual immunofluorescence for the anti–galectin-3 antibody Mac2 and CD68 localizes galectin-3 in liver (CE) and spleen (FH) macrophages (white arrows). I and J: However, in the bowel, galectin-3 staining also localizes in epithelial cells of the bowel lumen (Iarrows) and the serosa (J, arrows). Arrowheads show galectin-3+ cells with macrophage morphology in the bowel connective tissue. K: In the kidney, galectin-3 staining is noted in tubular epithelial cells (arrows). LO: Serial section staining of sections from the mouse kidney (L and M) and bowel (N and O), localize galectin-3 immunoreactivity (L and N, arrows) in pancytokeratin+ epithelial cells (M and O, arrows). Counterstained with eosin. Scale bar = 60 μm.
Figure 2
Figure 2
Galectin-3 up-regulation in the pressure-overloaded myocardium. A: In normal adult mouse left ventricle, galectin-3 localizes in interstitial cells with morphologic characteristics of macrophages (arrows). Ventricular cardiomyocytes do not express galectin-3. B: In control mouse atria, cardiomyocytes exhibit low-level galectin-3 immunoreactivity (arrows). C: The density of galectin-3+ cells in the left ventricular myocardium was markedly increased after pressure overload after 7 to 28 days of TAC. D: After 3 days of TAC, galectin-3 staining predominantly localizes in interstitial cells with morphologic characteristics of macrophages (arrows). E and F: After 7 to 28 days of TAC, intense galectin-3 staining also localizes in a subset of cardiomyocytes adjacent to areas of fibrosis (arrows). G: A section from a galectin-3 null animal after 28 days of TAC serves as a negative control, showing no galectin-3 staining, thus indicating the specificity of Mac2 immunohistochemistry for galectin-3. HJ: Atrial cardiomyocytes exhibit increased galectin-3 staining after 3 days (H), 7 days (I), and 28 days (J) of TAC. K: Galectin-3 null mice show no galectin-3 immunoreactivity after 28 days of TAC, confirming the specificity of immunohistochemical staining. Counterstained with eosin. Data are expressed as means ± SEM. n = 4 to 10 per group. **P < 0.01 versus control. Scale bar = 60 μm. C, control; TAC, transverse aortic constriction.
Figure 3
Figure 3
The pressure-overloaded myocardium is infiltrated by gal3–expressing macrophages and MFs. Dual immunofluorescence for CD68 and gal3 was used to identify gal3+ macrophages. A: The number of macrophages expressing gal3 markedly increases after 7 to 28 days of TAC. BE: Representative images show dual staining for gal3 and CD68 in the control heart (B) and in the remodeling myocardium after 3 days (C), 7 days (D), and 28 days (E) of TAC, identifying gal3+ macrophages (arrows). Gal3 macrophages are also noted (arrowheads). F: The density of gal3+ MFs also increases in the pressure-overloaded myocardium, peaking after 7 days of TAC. GJ: Representative images show dual staining for gal3 and α-SMA in control myocardium (G) and in the remodeling heart after 3 days (H), 7 days (I), and 28 days (J) of TAC. Gal3+ MFs were identified as interstitial spindle-shaped cells expressing α-SMA (arrows). Many gal3 MFs are also noted (arrowheads). J: After 28 days of TAC, the number of gal3+ MFs significantly decreases. Vascular smooth muscle cells did not exhibit galectin-3 expression (arrowheads). Data are expressed as means ± SEM. n = 4 to 10. **P < 0.01 versus control. C, control; gal3, galectin-3; MF, myofibroblast; TAC, transverse aortic constriction.
Figure 4
Figure 4
Regulation of gal3 in macrophages and FBs. A: The effect of cytokine stimulation on gal3 mRNA synthesis by mouse macrophages was assessed with the use of quantitative real-time PCR. Splenic mouse macrophages show high constitutive expression of gal3. IL-1β and TGF-β1 suppress macrophage gal3 synthesis. IL-1β and TGF-β1 do not affect gal3 synthesis in macrophages harvested from S3KO mice, suggesting that the down-modulatory effects of the cytokines depend on Smad signaling. B and C: Dual immunofluorescence for gal33 and the FB marker Tcf21 was used to assess the effects of cytokines on gal3 expression in cardiac FBs cultured in collagen pads. A small percentage of control Tcf21+ cardiac FBs exhibit gal3 expression. IL-1β decreases the density of gal3+/Tcf21+ FBs. TGF-β1 stimulation has no effects on the number and percentage of gal3+ cells. DF: Representative images show gal33 expression by Tcf21+ FBs in control (D), IL-1β (E), and TGF-β–stimulated (F) cells. Data are expressed as means ± SEM. n = 9 to 12 (A); n = 3 (B–and C). *P < 0.05, **P < 0.01 versus Ctrl. Scale bar = 20 μm. C, control; Ctrl, control; FB, fibroblast;gal3, galectin-3; S3KO, Smad3 knockout; Tcf21, transcription factor 21; TGF, transforming growth factor; WT, wild-type.
Figure 5
Figure 5
Gal3 localization in atrial and ventricular CMs after pressure overload. Dual immunofluorescence for gal3 (green) and WGA lectin (red) was used to identify gal3+ CMs. AC: In normal atria, CMs show low-level gal3 immunoreactivity (A) that is markedly increased after 7 to 28 days of TAC (B and C). D: Atrial tissue from a gal3 KO animal after 28 days of TAC serves as a negative control. E: In the ventricular myocardium, density of gal3+ CMs markedly increases after 7 to 28 days of TAC. F: In normal ventricular myocardium, gal3 staining localizes in non-CMs (arrow). G and H: After 7 (G) and 28 days (H) of TAC, a subset of CMs adjacent to fibrotic areas exhibits strong gal3 immunoreactivity (arrows), while other CMs have weaker staining for gal3 (arrowheads). I: No gal3 immunostaining is noted in gal3 KO mice after 28 days of TAC, despite the presence of fibrosis (arrows). Data are expressed as means ± SEM. *P < 0.05, **P < 0.01 versus control. Scale bar = 60 μm. C, control; CM, cardiomyocyte; gal3, galectin-3; KO, knockout; TAC, transverse aortic constriction; WGA, wheat germ agglutinin.
Figure 6
Figure 6
Ventricular density of gal3+ cells is associated with cardiac remodeling after 28 days of TAC. AC: Correlation studies reveal statistically significant associations between the density of gal3+ cells and LVEDD (A), LVEDV (B), and LVESV (C). D: A trend was found toward an inverse correlation between the density of gal3+ cells and ejection fraction that does not reach statistical significance. n = 10. Gal3, galectin-3; LVEDD, left ventricular end-diastolic diameter; LVEDV, left ventricular end-diastolic volume; LVESD, left ventricular end-systolic diameter; LVESV, left ventricular end-systolic volume; TAC, transverse aortic constriction.
Figure 7
Figure 7
Ventricular density of gal3+ CMs is associated with adverse remodeling after 28 days of TAC. AD: A statistically significant correlation was found between the density of gal3+ CMs and left ventricular volumes (B, LVEDV; C, LVESV). Moreover, a trend was found toward a positive correlation between the density of gal3+ CMs and LVEDD (A) and a trend was found toward a negative correlation between the density of gal3+ CMs and ejection fraction (D). EH: Associations between the density of gal3+ MFs and remodeling-associated variables are weaker and do not reach statistical significance. No significant associations were found between the density of gal3+ macrophages and cardiac remodeling. n = 10. CM, cardiomyocyte; gal3, galectin-3; LVEDD, left ventricular end-diastolic diameter; LVEDV, left ventricular end-diastolic volume; LVESV, left ventricular end-systolic volume; MF, myofibroblast; TAC, transverse aortic constriction.
Figure 8
Figure 8
Gak3 deficiency accelerates hypertrophy and delays chamber dilation without affecting survival and systolic dysfunction after pressure overload. A: WT and gal3 KO mice have comparable survival curves after pressure overload. B: The HW/BW is significantly higher in gal3 KO mice after 7 days of TAC. A trend was found toward increased HW/BW after 28 days of TAC that does not reach statistical significance. C: LW/BW is comparable between groups. D: Gal3 loss does not affect ΔLVEDD after 7 to 56 days of TAC. E: ΔLVEDV is significantly lower in gal3 KO mice after 28 days of TAC. F and G: No significant differences were found in ΔLVESV and ΔEF. H: After 7 days of TAC, gal3 KO mice exhibit an accentuated increase in LV mass, suggesting accelerated hypertrophy. However, after 28 days of TAC LV mass is comparable between WT and gal3 KO mice. Data are expressed as means ± SEM. n = 50 WT, n = 46 KO (A); n = 10 to 11 per group (B); n = 37 WT mice, n = 30 KO mice at 7 days (H); n = 25 WT mice, n = 18 KO mice at 28 days (H); n = 13 WT mice, n = 10 mice at 56 days (H). *P < 0.05 versus WT. gal3, galectin-3; HW/BW, heart weight-to-body weight ratio; KO, knockout; LV, left ventricular; LW/BW, lung weight-to-body weight ratio; TAC, transverse aortic constriction; WT, wild-type; ΔEF, change in ejection fraction; ΔLVEDD, change in left ventricular end-diastolic diameter; ΔLVEDV, change in left ventricular end-diastolic volume; ΔLVESD, change in left ventricular end-systolic diameter; ΔLVESV, change in left ventricular end-systolic volume.
Figure 9
Figure 9
Sex-specific effects of galectin-3 absence on the pressure-overloaded heart. Galectin-3 loss delays dilation in female (A), but not in male (D) mice, increasing the ΔLVEDV after 28 days of TAC. Galectin-3 loss does not affect Δef in female (B) or male (E) mice. In both female (C) and male (F) mice, galectin-3 loss is associated with a trend toward increased ΔLV mass after 7 days of TAC that does not reach statistical significance. Variables were measured by echocardiography. Data are expressed as means ± SEM. n = 19 female WT mice, n = 17 female KO mice at 7 days; n = 14 WT female mice, n = 10 female KO mice at 28 days; n = 9 female WT mice, n = 6 female KO mice at 56 days; n = 18 male WT mice, n = 13 male KO mice at 7 days; n = 11 male WT mice, n = 8 male KO mice at 28 days; n = 4 male WT mice, n = 4 male KO mice at 56 days. *P < 0.05. KO, knockout; TAC, transverse aortic constriction; WT, wild-type; Δef, change in ejection fraction; ΔLV, change in left ventricular; ΔLVEDV, change in left ventricular end-diastolic volume; ΔLVESD, change in left ventricular end-systolic diameter; ΔLVESV, change in left ventricular end-systolic volume.
Figure 10
Figure 10
Galectin-3 loss does not affect diastolic dysfunction, fibrosis, and cardiomyocyte hypertrophy in the pressure-overloaded myocardium. AF: Doppler echocardiography and tissue Doppler imaging shows that galectin-3 absence does not affect diastolic function. TAC increases (A) and peak E (B) and A (C) velocities in both WT and galectin-3 KO mice. The E/A ratio is significantly reduced in WT mice after 56 days of TAC (D). The E/E′ ratio, a sensitive indicator of diastolic dysfunction, increases after TAC in both WT and galectin-3 KO mice (E), whereas the E′/A′ ratio is reduced (F). Galectin-3 loss has no effects on indicators of diastolic dysfunction. GJ: Sirius red staining was used to label collagen fibers in WT and galectin-3 KO hearts after 28 days of TAC. No statistically significant difference was noted between WT and KO mice (H) in both male and female groups. KN: Cardiomyocyte size was assessed in sections stained for WGA lectin. Cardiomyocyte size was comparable in WT and galectin-3 KO mice after 28 days of TAC (L), in both male and female mice. Data are expressed as means ± SEM. n = 10 to 16 per group (AF); n = 9 to 10 per group (KN). *P < 0.05, **P < 0.01 versus corresponding pre. Scale bar = 60 μm. Bpm, beats per minute; HR, heart rate; KO, knockout; TAC, transverse aortic constriction; WT, wild-type.

Comment in

  • Galectin-3, Cardiac Function, and Fibrosis.
    Meijers WC, López-Andrés N, de Boer RA. Meijers WC, et al. Am J Pathol. 2016 Aug;186(8):2232-2234. doi: 10.1016/j.ajpath.2016.05.002. Epub 2016 Jul 20. Am J Pathol. 2016. PMID: 27461364

References

    1. Sato S., Hughes R.C. Regulation of secretion and surface expression of Mac-2, a galactoside-binding protein of macrophages. J Biol Chem. 1994;269:4424–4430. - PubMed
    1. Liu F.T., Hsu D.K., Zuberi R.I., Kuwabara I., Chi E.Y., Henderson W.R., Jr. Expression and function of galectin-3, a beta-galactoside-binding lectin, in human monocytes and macrophages. Am J Pathol. 1995;147:1016–1028. - PMC - PubMed
    1. Kaltner H., Seyrek K., Heck A., Sinowatz F., Gabius H.J. Galectin-1 and galectin-3 in fetal development of bovine respiratory and digestive tracts. Comparison of cell type-specific expression profiles and subcellular localization. Cell Tissue Res. 2002;307:35–46. - PubMed
    1. Neidhart M., Zaucke F., von Knoch R., Jungel A., Michel B.A., Gay R.E., Gay S. Galectin-3 is induced in rheumatoid arthritis synovial fibroblasts after adhesion to cartilage oligomeric matrix protein. Ann Rheum Dis. 2005;64:419–424. - PMC - PubMed
    1. Rao S.P., Wang Z., Zuberi R.I., Sikora L., Bahaie N.S., Zuraw B.L., Liu F.T., Sriramarao P. Galectin-3 functions as an adhesion molecule to support eosinophil rolling and adhesion under conditions of flow. J Immunol. 2007;179:7800–7807. - PubMed

Publication types

MeSH terms

LinkOut - more resources