. 2016 Mar 16;89(6):1291-1304.
doi: 10.1016/j.neuron.2016.01.041. Epub 2016 Mar 3.

A New Population of Parvocellular Oxytocin Neurons Controlling Magnocellular Neuron Activity and Inflammatory Pain Processing

Affiliations

A New Population of Parvocellular Oxytocin Neurons Controlling Magnocellular Neuron Activity and Inflammatory Pain Processing

Marina Eliava et al. Neuron. .

Abstract

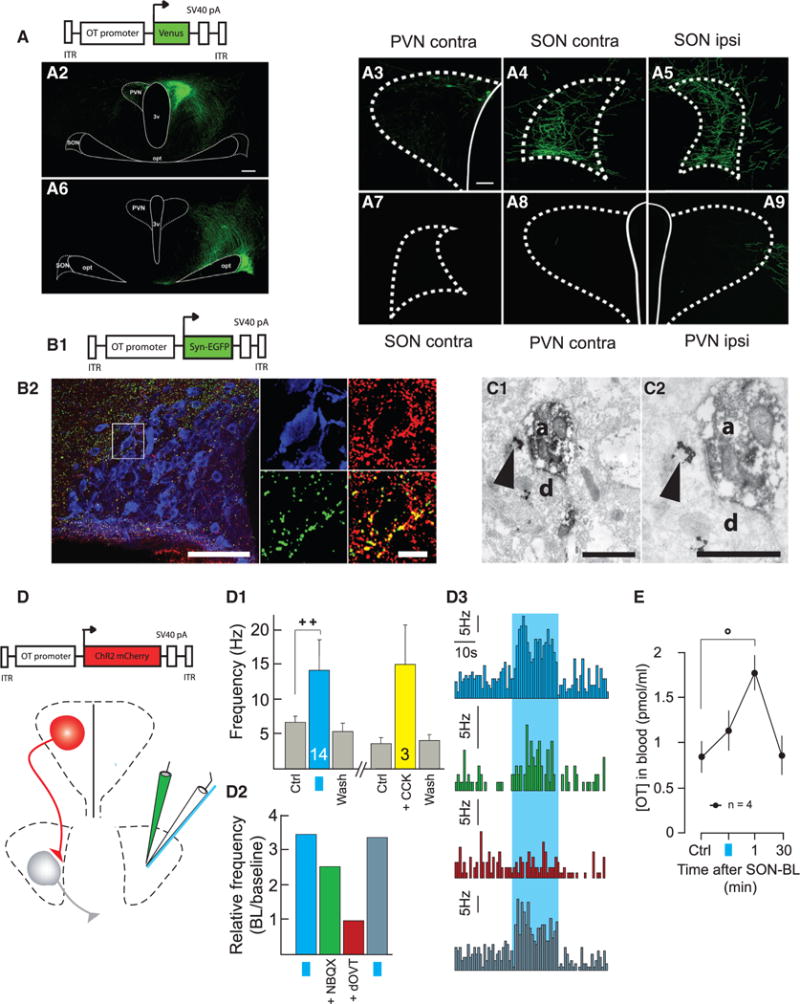
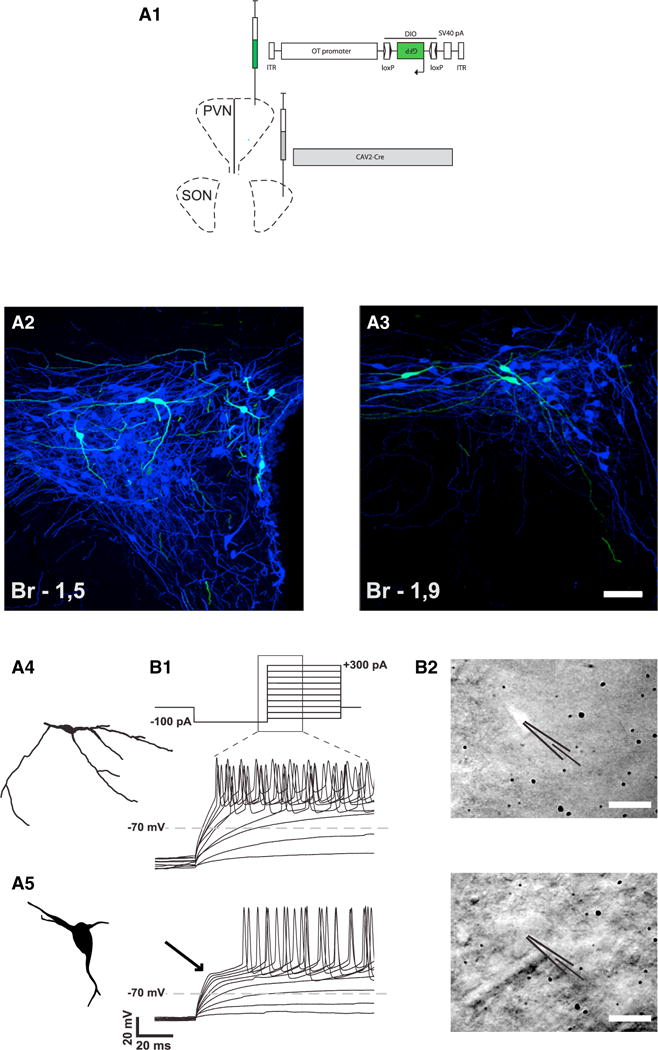
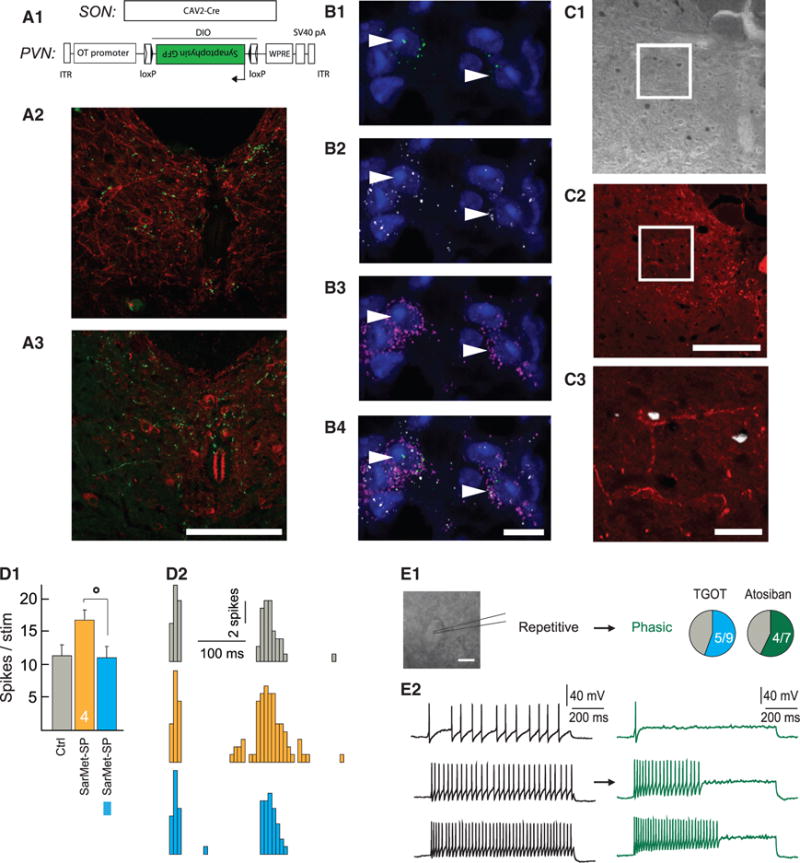
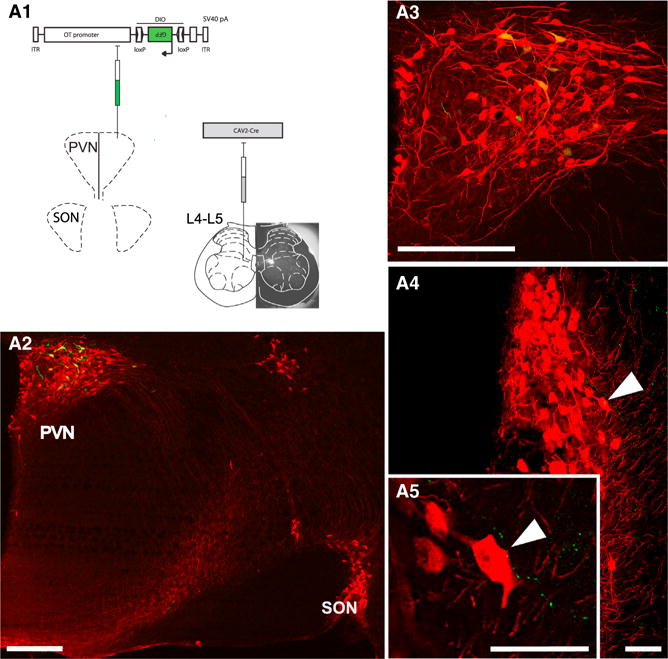
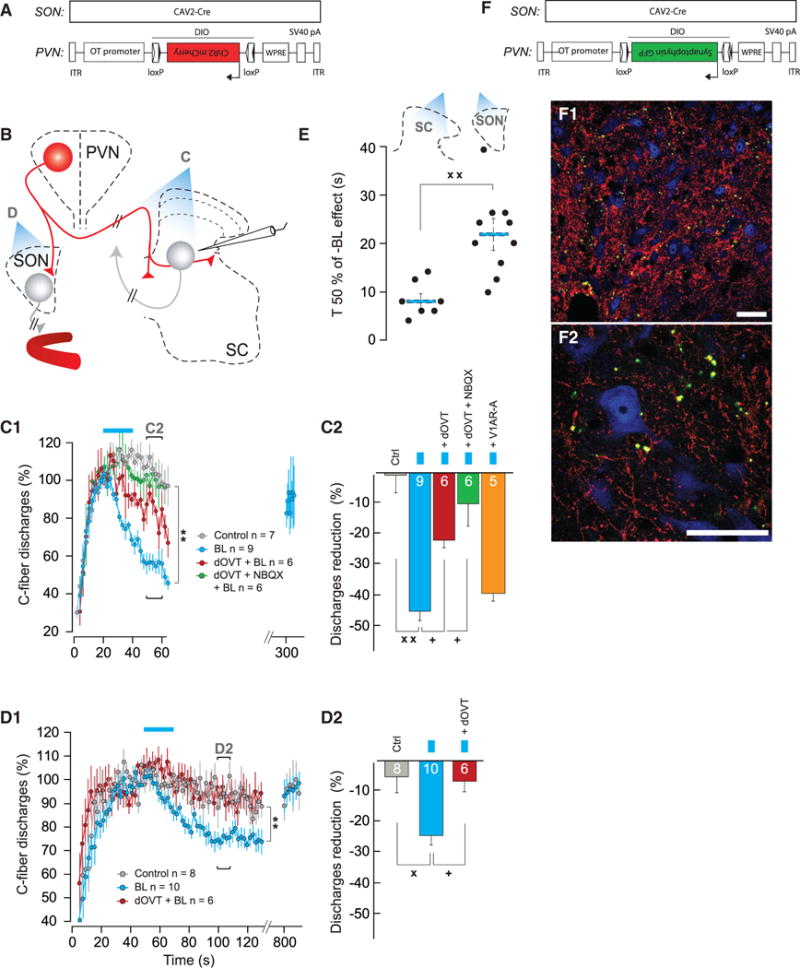
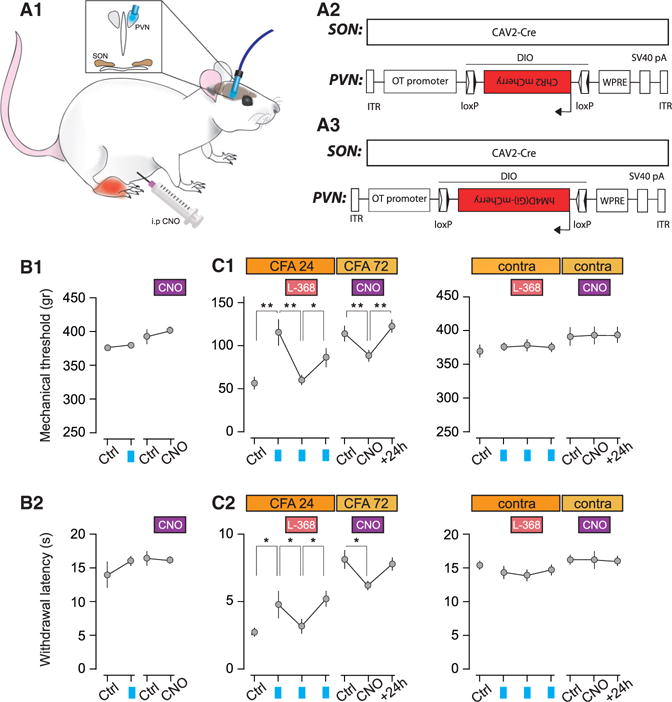
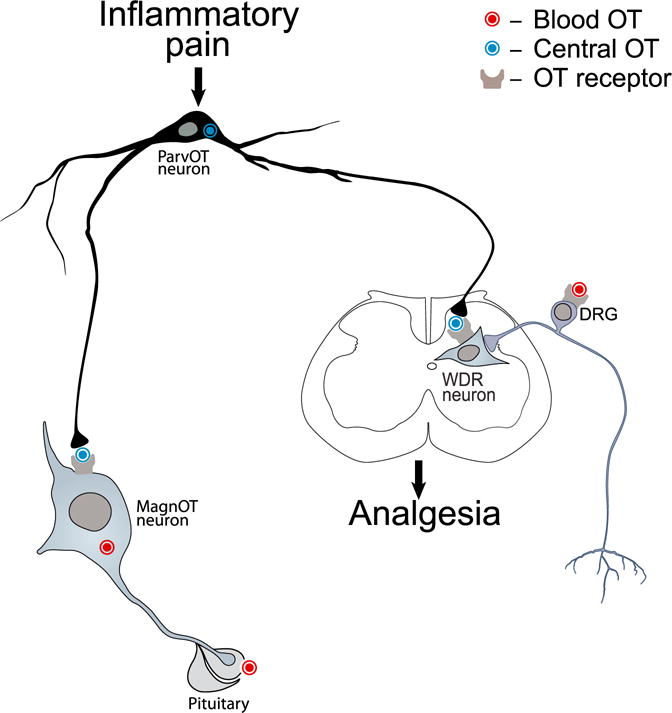
Oxytocin (OT) is a neuropeptide elaborated by the hypothalamic paraventricular (PVN) and supraoptic (SON) nuclei. Magnocellular OT neurons of these nuclei innervate numerous forebrain regions and release OT into the blood from the posterior pituitary. The PVN also harbors parvocellular OT cells that project to the brainstem and spinal cord, but their function has not been directly assessed. Here, we identified a subset of approximately 30 parvocellular OT neurons, with collateral projections onto magnocellular OT neurons and neurons of deep layers of the spinal cord. Evoked OT release from these OT neurons suppresses nociception and promotes analgesia in an animal model of inflammatory pain. Our findings identify a new population of OT neurons that modulates nociception in a two tier process: (1) directly by release of OT from axons onto sensory spinal cord neurons and inhibiting their activity and (2) indirectly by stimulating OT release from SON neurons into the periphery.


Figures

Figure 1
Figure 1. Anatomical and Functional Connectivity between OT Neurons of the PVN and SON
(A) OT projections from PVN to SON. (A1) Scheme of the viral vector used to infect PVN neurons. (A2–A9) PVN OT neurons infected with cell-type specific viral vector project Venus-positive axons to contralateral PVN (A3) and to contra- and ipsilateral SON (A4 and A5). OT neurons of the SON (A6) do not project Venus axons to contralateral SON (A7) or PVN (A8) and only marginally enter the external border of ipsilateral PVN (A9). The scale bars represent 200 μm (left) and 50 μm (right). (B) OT axon terminals contain vGluT2. (B1) Scheme of viral vector. (B2) GFP-positive terminals in the area of the SON (left). In the magnified inset (right), the OT neuron (blue) is surrounded by GFP terminals, which also contain vGlut2 (red). Both of the immunosignals overlap (yellow) in virtually all of the terminals. The scale bars represent 100 μm (left) and 25 μm (right). (C–C2) Electron microscopy OT axon terminals (Venus visualized as diaminobenzidine [DAB] endproduct, OT, as a silver-gold-intensified DAB) form asymmetric synapses on OT-ir dendrite within the SON. The OT-immunoreactivity (clusters of silver particles, arrows) are shown in the presynaptic axon (a) terminal and postsynaptic dendrite (d) at lower (C1) and higher magnifications (C2). The scale bar represents 0.5 μm. (D) Scheme of the viral vector and setup of in vivo electrophysiological recordings (white pipette) in SON, together with SON-BL stimulation (blue fiber) and drug infusion (green pipette). (D1–D3) Functional connection between PVN and SON OT neurons. (D1) Average spike frequencies of SON OT neurons before (Ctrl), after either SON-BL (n = 14, blue bar) or systemic injection of CCK (n = 3, yellow bar), and after washout effect (Wash). (D2) Relative frequency increase induced by SON-BL in control condition (blue bar), after infusion of NBQX (1 μM, 0.5 μl; green bar), after additional infusion of dOVT (1 μM, 0.5 μl; red bar), and after 30 min washout of the drugs (dark blue bar). (D3) Histograms of the frequency rates recorded under conditions described in (D2). (E) Effect of unilateral SON-BL effect on OT blood concentration at the end of SON-BL, 1 min and 30 min after (n = 4). All results are expressed as average ± SEM. The statistical significances: ++ p < 0.01 and Wilcoxon’s test. (°p < 0.05, Friedman’s test followed by Dunn post hoc test) The blue squares represent 20 s BL stimulation at 30 Hz with 10 ms pulses of BL stimulation.
Figure 2
Figure 2. Anatomical and Electrophysiological Characteristics of PVN OT Neurons Projecting to the SON
(A) Identification of a subset of OT neurons projecting from PVN to SON. (A1) Scheme showing the injection of viruses in the SON and PVN. (A2 and A3) Defined subset of back-labeled OT neurons (green) in dorso-caudal PVN displays consistent morphology: small oval somas (12 to 20 μm in diameter) with predominantly longer horizontal axes. The scale bar represents 50 μm in (A2) and 50 μm in (A3). (A4 and A5) The morphology of these cells is clearly distinct from the typical magnocellular neurons with large cell bodies and less branching processes (A5). (B) Functional differentiation of this subset of PVN OT neurons. (B1) Current steps protocol starting from a hyperpolarizing current chosen to reach −100 mV (here 100 pA) followed by progressively more depolarizing current injections (upper trace). The representative changes in membrane potential for the parvOT and magnOT PVN neurons during the part of the current steps as indicated by the zoomed area are shown (lower traces). The ParvOT neurons (middle trace) do not display the transient outward rectification specific for the magnOT neurons (lower trace, arrow). (B2) Photographs of a GFP-fluorescent parvOT neuron (upper) in the PVN (labeled by injection of CAV2-Cre into the SON and OT-DIO-GFP AAV in the PVN) and in the same area a typical magnOT neuron (lower) as indicated by the patch pipettes. The scale bars represent 20 μm.
Figure 3
Figure 3. ParvOT Neurons Project to SC and Innervate NK1R/OTR WDR Neurons in Deep Laminae
(A) ParvOT projections to the SC. (A1) Scheme of the viruses injected into the SON and PVN. (A2) Detection of synaptophysin-GFP containing terminals (green) in close proximity to NK1R-positive neurons (red) in SC deep laminae. (A3) Synaptophysin-GFP terminals locate close to OTR-positive neurons of deep laminae. The scale bars represents 500 μm in (A2) and 500 μm in (A3). (B–B4) Colocalization of NK1R and OTR mRNAs in the same neurons of SC deep laminae. Immunofluorescent in situ hybridization revealed the presence of OTR mRNA (green dots; B1 and B4) and NK1R mRNA (white dots; B2 and B4) in the same neurons, which were visualized by detection of vGlut1/2/3 mRNAs in their somas (pink/violet dots; B3 and B4). The nuclei of cells were stained by DAPI. The arrow heads point NK1R/OTR double positive neurons. The scale bars represent 10 μm. (C–C3) NK1R-positive SC neurons start to express c-Fos after intraplantar injection of capsaicin in the hindpaw. The c-Fos signal (DAB) was detected in deep laminae of SC (C1), where the NK1R (red) were located (C2). The digital overlay of the two signals demonstrates localization of c-Fos in the NK1R-postive neuron (C3). The scale bars represent 500 μm in (C1) and (C2) and 50 μm in (C3). (D) WDR C-fiber evoked spikes in response to a series of isolated hindpaw stimulations in control condition (Ctrl), during application of the specific agonist of NK1R SarMet-SP (orange), and during SarMet-SP paired with BL (blue). (D1) Average of C-fiber evoked spikes (n = 5). (D2) Representative traces. (E) Discharge profile of putative WDR recorded in current clamp applying a protocol of depolarizing current injections before (black) and after bath application of 1 μM TGOT (blue, n = 9) or 1 μM Atosiban (green, n = 7). (E1) Proportion of putative WDR neurons discharge pattern changed from repetitive to phasic after TGOT or Atosiban bath application. (E2) Example response of putative WDR neuron to 20 pA (top), 40 pA (middle), and 60 pA (bottom) current injection before (black) and after (green) Atosiban bath application. The scale bar represents in (E1) 30 μm. All results are expressed as average ± SEM. The statistical significance: °p < 0.05, Friedman’s test followed by Dunn post hoc test.
Figure 4
Figure 4. ParvOT-MagnOT-SC Anatomical Unit
(A) Scheme of viruses injected into the SC and PVN. The actual SC injection site (fluorescent latex bead accumulation) is shown as an insert underlying SC drawing. (A2–A5) PVN parvocellular cells back-labeled from SC (green). The GFP-positive cell bodies were found in the caudal portion of the PVN and always colocalized OT (red) (A3, magnification from A2). Fibers, projecting from back-labeled PVN OT neurons to SON (arrow in A4, more caudal to A2) GFP-expressing varicouse axons in close proximity to cell bodies and dendrites of SON mag-noOT neurons (high magnification in A5) are shown. The scale bars represent 500 μm in (A2) and (A3) and 75 μm in (A4) and (A5).
Figure 5
Figure 5. Stimulation of ParvOT PVN Axons in SON and SC Modulates Responses of WDR Neurons
(A) Viruses injected into the SON and PVN. (B) Scheme of the experimental procedures. (C) Effect of SC-BL on WDR-C discharges. (C1) Time course of WDR-C in control condition (n = 7), when shining SC-BL alone (n = 9), after local dOVT application (n = 6), or local dOVT + NBQX application (n = 6). (C2) Average discharge reduction of WDR-C on Ctrl (n = 7), when shining SC-BL alone (n = 9), after local dOVT application (n = 6), local dOVT + NBQX application (n = 6), or local V1AR-A application (n = 5). The statistical significance of drug modulation of the SON-BL effect was assessed by comparing the effect of SON-BL on the same neuron before and after drug injection. (D) Effect of SON-BL on WDR-discharges. (D1) Time course of WDR-C in control condition (n = 8), measured 30 s after shining SON-BL (as indicated in C1) alone (n = 10), or after systemic dOVT systemic injection (n = 6). (D2) Average discharge reduction of WDR-C on Ctrl (n = 8), when shining SON-BL alone (n = 10), or after systemic dOVT injection (n = 6). The statistical significance of dOVT modulation of the SON-BL effect was assessed by comparing the effect of SON-BL on the same neuron before and after dOVT injection (n = 6). (E) Comparison between individual (black dots) and average T 50% (blue bar) effect of SON-BL (n = 10) and SC-BL (n = 7) on recorded WDR. (F) Viruses injected into the SON and PVN. (F1 and F2) Axonal terminals containing synaptophysin-GFP fusion protein in proximity to SC L5 neurons. (F1) Overview of fiber distribution within SC: VGluT2 (red), synaptophysin-GFP (green), and NeuN (blue). (F2) A zoom-in shows the green signal (green) largely overlaps with the VGluT2 signal (red) in terminals surrounding cell bodies. The scale bars represent 50 μm in (F1) and (F2). All results are expressed as average ± SEM. The statistical significance: °p < 0.05, Friedman with Dunn post hoc test; + p < 0.05, ++ p < 0.01, and Wilcoxon’s test; xx p < 0.01 and Kruskal and Wallis test; and ** p < 0.01 BL versus Control, two-way ANOVA.
Figure 6
Figure 6. Activation/Inhibition of ParvOT PVN Neurons Modulates Mechanical Threshold and Thermal Hot Latency in Animals Subjected to Complete Adjuvant Injection
(A–A3) Scheme of the experimental procedure. The CAV2-Cre was injected in the SON and Cre-responding virus driving either (A2) ChR2 or (A3) hM4Di to achieve the expression of respective proteins in OT neurons of the PVN. (B–B2) Mechanical thresholds and (B2) thermal hot latencies of naive animals before and after PVN-BL (ChR2, n = 6 and CNO, n = 10). (C–C2) Mechanical thresholds and (C2) thermal hot latencies of the CFA-injected hindpaw (left graphs) and the contralateral hindpaw (right graphs). The effect of PVN-BL was assessed before, right after i.p. injection of OTR antagonist L-368,899 (1 mg/kg), and after its washout (n = 6). The effect of CNO (3 mg/kg) was measured 1 hr after i.p. injection and its 24 hr washout (n = 10). All results are expressed as average ± SEM. The statistical significance: * p < 0.05, ** p < 0.01, and one-way ANOVA followed by Tukey’s multiple comparison post hoc test.
Figure 7
Figure 7. The Role of the Novel Type of ParvOT Neurons in Coordinating Central and Peripheral OT Release to Promote Analgesia
We hypothesize that pain stimulates the identified subset of parvOT PVN neurons, which simultaneously release OT in the SON and SC, exerting respectively delayed and longer lasting and immediate and shorter lasting analgesia. The peripheral analgesic effect of OT is likely mediated by its action on BBB-free sensory neurons of the DRG.

References

    1. Armstrong WE, Warach S, Hatton GI, McNeill TH. Subnuclei in the rat hypothalamic paraventricular nucleus: a cytoarchitectural, horseradish peroxidase and immunocytochemical analysis. Neuroscience. 1980;5:1931–1958. - PubMed
    1. Atasoy D, Betley JN, Su HH, Sternson SM. Deconstruction of a neural circuit for hunger. Nature. 2012;488:172–177. - PMC - PubMed
    1. Bargmann W, Scharrer E. The site of origin of the hormones of the posterior pituitary. Am Sci. 1951;39:255–259. - PubMed
    1. Belin V, Moos F. Paired recordings from supraoptic and paraventricular oxytocin cells in suckled rats: recruitment and synchronization. J Physiol. 1986;377:369–390. - PMC - PubMed
    1. Belin V, Moos F, Richard P. Synchronization of oxytocin cells in the hypothalamic paraventricular and supraoptic nuclei in suckled rats: direct proof with paired extracellular recordings. Exp Brain Res. 1984;57:201–203. - PubMed

Publication types

MeSH terms