. 2016 Mar 16;89(6):1223-1236.
doi: 10.1016/j.neuron.2016.02.004. Epub 2016 Mar 3.

The Complete Genome Sequences, Unique Mutational Spectra, and Developmental Potency of Adult Neurons Revealed by Cloning

Affiliations

The Complete Genome Sequences, Unique Mutational Spectra, and Developmental Potency of Adult Neurons Revealed by Cloning

Jennifer L Hazen et al. Neuron. .

Abstract

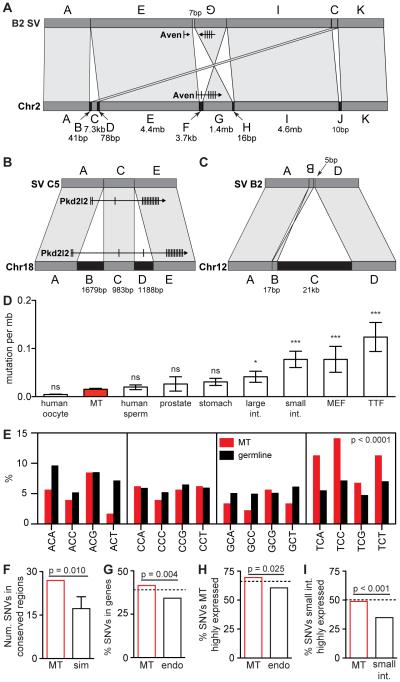
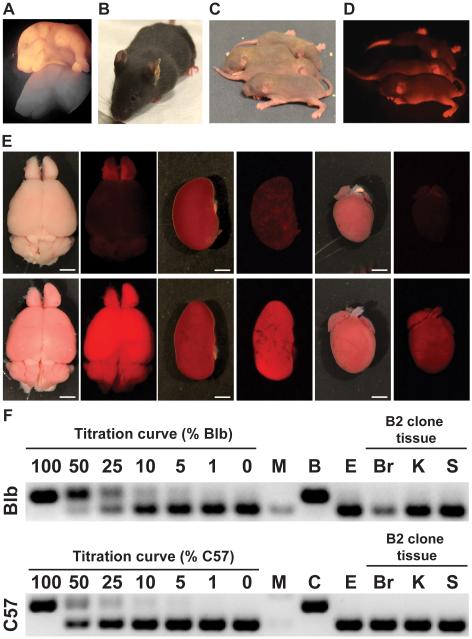
Somatic mutation in neurons is linked to neurologic disease and implicated in cell-type diversification. However, the origin, extent, and patterns of genomic mutation in neurons remain unknown. We established a nuclear transfer method to clonally amplify the genomes of neurons from adult mice for whole-genome sequencing. Comprehensive mutation detection and independent validation revealed that individual neurons harbor ∼100 unique mutations from all classes but lack recurrent rearrangements. Most neurons contain at least one gene-disrupting mutation and rare (0-2) mobile element insertions. The frequency and gene bias of neuronal mutations differ from other lineages, potentially due to novel mechanisms governing postmitotic mutation. Fertile mice were cloned from several neurons, establishing the compatibility of mutated adult neuronal genomes with reprogramming to pluripotency and development.


Figures

Figure 1
Figure 1. Genetic labeling of mitral and tufted (MT) neurons
(A) Donor animals carry one Pcdh21/Cre allele (top) and one copy of the Ai9 Cre reporter transgene (middle). Cre expression in MT neurons excises the STOP cassette within the Ai9 transgene, resulting in specific tdTomato expression and genetic labeling of MT neurons (bottom). (B) Schematic representation of the MT neuron localization and morphology within the olfactory bulb. MT neurons in the mitral and tufted cell layer, as well as external tufted cells send their dendrites into spherical structures known as glomeruli, where they synapse with olfactory sensory neurons. (C-G) Immunostaining of Pcdh21/Cre-Ai9 mouse olfactory bulb sections for markers of MT neurons, glia and dividing cells. Blue, DAPI nuclear stain; red, endogenous tdTomato fluorescence; green, antibody staining for (C) MT neuron marker Tbr2 (D) dividing cell marker Ki67 (E) microglia marker Iba1 (F) oligodendrocyte marker Olig2 (G) astrocyte and olfactory ensheathing cell marker S100b. (H) Quantification of the absence of co-expression of tdTomato with glial and dividing cell markers. DP: double positive for tdTomato and glial/dividing cell maker. Scale bar in C, 15 µ. Scale bars in D-G 100 µ.
Figure 2
Figure 2. MCNT-ES cells and their whole genome sequences
(A) Dissociated MT neuron shown with injection pipette. (B) tdTomato positive blastocysts generated from MT neurons. (C) tdTomato positive MCNT-ES cells. (D) Schematic of Pcdh21/Cre-Ai9 donor animals and the MCNT-ES cell lines and control tissues sequenced from each animal. (E) Representative PCR subclone validation for two structural variants (SVs). PCR primers flank the SV breakpoint, and are diagnostic for the presence of the SV mutation. The top SV is somatic, indicated by its presence in all early passage subclones. The bottom SV likely arose during culture or reprogramming, as it is present in only some subclones. Images are cropped to the region of diagnostic band size. M, molecular weight. +, Positive control. –, Negative control. (F) and (G) Observed mutations (black/red bars) and estimated mutational burden based on the false negative rate (FNR; colored plus white bars). For SVs, observed and predicted values for breakpoints are plotted. Scale bar in A, 25 µ. Scale bar in B, 50 µ. Scale bar in C, 100µ. See Figures S1 and S2, and Tables S1 and S2.
Figure 3
Figure 3. Mutational features of MT neuron genomes
(A-C) Complex genomic rearrangements (CGRs) observed in MT neurons. Bottom bar represents wild type, top bar represents mutated configuration. (A) In a chromothripsis like CGR on chromosome 2 in line B2, fragment C is transposed downstream, fragment F is deleted, removing an exon from Aven, and fragment G is inverted, impacting many Aven exons. Small deletions are present at each breakpoint (arrows), and a 7bp insertion is present at the junction between E and G. (B) A CGR on chromosome 18 in line C5 involves two deletions within 3kb. One deletes exon 4 of the Pkd2l2 gene. (C) A 21kb deletion on chromosome 12 in line B2 is comprised of fragment B, a 17bp inversion and a 5bp insertion of unknown origin. (D) Total number of SNVs normalized by the length of the mouse or human diploid or haploid genome. Mean and SEM are plotted. (E) Percent of C→T conversions within each 3 bp context for MT neuron SNVs and germline SNPs. MT neuron SNVs occur significantly more often in the TpCpN context (~44% vs. ~25%, p<0.0001, Fisher’s Exact Test). (F) The number of MT neuron SNVs appearing in evolutionarily conserved regions of the genome is significantly higher than expected by chance (27 actual vs. ~17 simulated, standard deviation shown on graph = ~4, p = 0.010, Monte Carlo). (G) Percent of total MT neuron and endodermal SNVs that fall in genes. SNVs in MT neurons are enriched in genes relative to endodermal SNVs (p = 0.004, Fisher’s Exact Test). The dashed line indicates the percentage of the genome that falls into genes. (H) SNVs found in MT neurons are not depleted in highly expressed genes (top 50%) and are enriched in these genes compared to SNVs found in endodermal cell types (p = 0.025, Fisher’s Exact Test). (I) In contrast, small intestine SNVs are depleted in their own highly expressed genes relative to chance (p = 2.2 × 10⁻¹⁶, Poisson Test). Small intestine SNVs are also depleted in highly expressed genes relative to MT neuron SNVs (p = 7.06 × 10⁻⁴, Fisher’s Exact Test). Dotted lines in H and I demonstrate the percent of each transcriptome length that falls within highly expressed genes and represents random chance. MEF, mouse embryonic fibroblast. TTF, tail tip fibroblast. Sim, simulated. Endo, endodermal. See also Figures S3-S4, and Table S9.
Figure 4
Figure 4. Mice derived from MT neurons
(A) Newborn and (B) adult clones generated from MCNT-ES cells. (C) Standard and (D) fluorescence images of offspring of MCNT-mice. Transmission of the tdTomato transgene demonstrates MCNT-ES cells can generate functional germ cells. (E) Alternating standard and fluorescence images of brain, kidney, and heart dissected from Pcdh21/Cre-Ai9 control mice (top row) and MCNT-mice (bottom row). Organs from MCNT-mice exhibit normal morphology and uniform tdTomato expression. (F) Sample microsatellite PCR assay for tetraploid cell contribution to MCNT-mice. Band size distinguishes B2 derived cells from the tetraploid host strains C57 (C57BL/6J-Tyrc-2J) and Blb (Balb/cByJ). DNA titration curve demonstrates 5% detection limit. Analysis of DNA from B2 clone tissues exhibits no detectable tetraploid host DNA. M, molecular weight. E, B2 ES cell DNA. Br, brain. K, kidney. S, spleen. See also Figure S5.

Comment in

References

    1. Ajioka I, Martins RAP, Bayazitov IT, Donovan S, Johnson DA, Frase S, Cicero SA, Boyd K, Zakharenko SS, Dyer MA. Differentiated Horizontal Interneurons Clonally Expand to Form Metastatic Retinoblastoma in Mice. Cell. 2007;131:378–390. - PMC - PubMed
    1. Alexandrov LB, Nik-Zainal S, Wedge DC, Aparicio SAJR, Behjati S, Biankin AV, Bignell GR, Bolli N, Borg A, Borresen-Dale A-L, et al. Signatures of mutational processes in human cancer. Nature. 2013;500:415–421. - PMC - PubMed
    1. Baillie JK, Barnett MW, Upton KR, Gerhardt DJ, Richmond TA, De Sapio F, Brennan PM, Rizzu P, Smith S, Fell M, et al. Somatic retrotransposition alters the genetic landscape of the human brain. Nature. 2011;479:534–537. - PMC - PubMed
    1. Beale RCL, Petersen-Mahrt SK, Watt IN, Harris RS, Rada C, Neuberger MS. Comparison of the Differential Context-dependence of DNA Deamination by APOBEC Enzymes: Correlation with Mutation Spectra in Vivo. Journal of Molecular Biology. 2004;337:585–596. - PubMed
    1. Behjati S, Huch M, van Boxtel R, Karthaus W, Wedge DC, Tamuri AU, Martincorena I, Petljak M, Alexandrov LB, Gundem G, et al. Genome sequencing of normal cells reveals developmental lineages and mutational processes. Nature. 2014;513:422–425. - PMC - PubMed

Publication types

MeSH terms

LinkOut - more resources