. 2016 Mar 7:5:e13665.
doi: 10.7554/eLife.13665.

Midbrain dopamine neurons compute inferred and cached value prediction errors in a common framework

Affiliations

Midbrain dopamine neurons compute inferred and cached value prediction errors in a common framework

Brian F Sadacca et al. Elife. .

Abstract

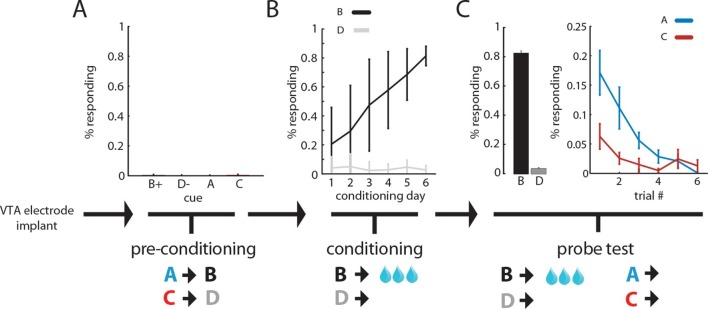
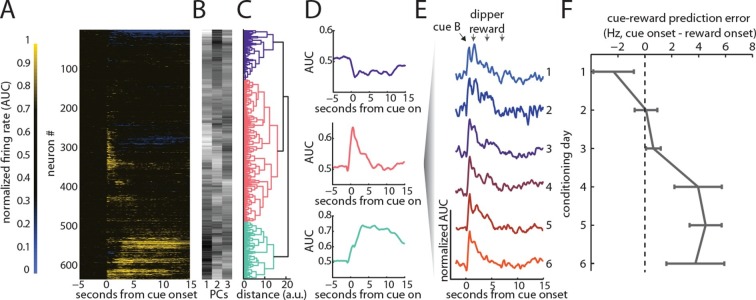
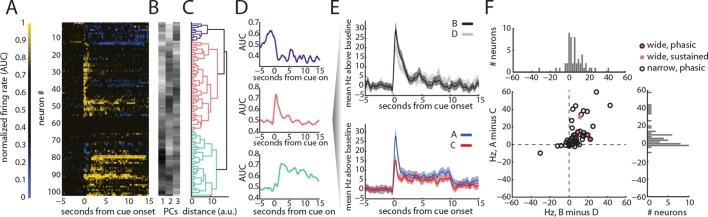
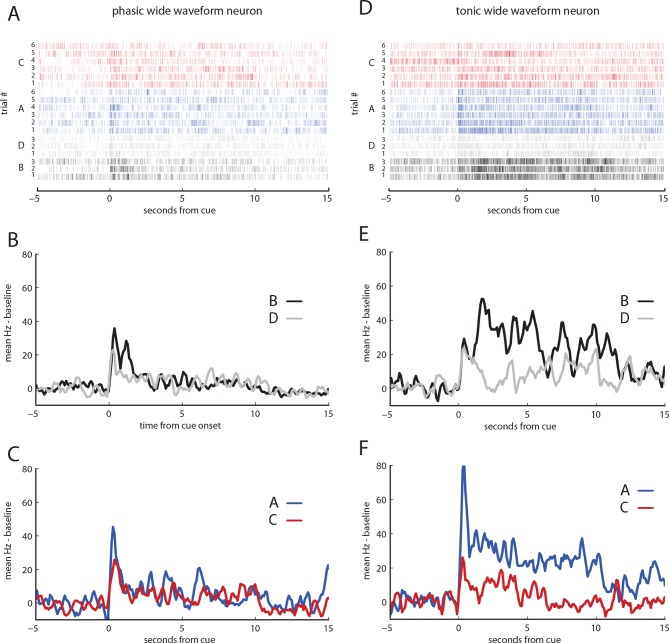
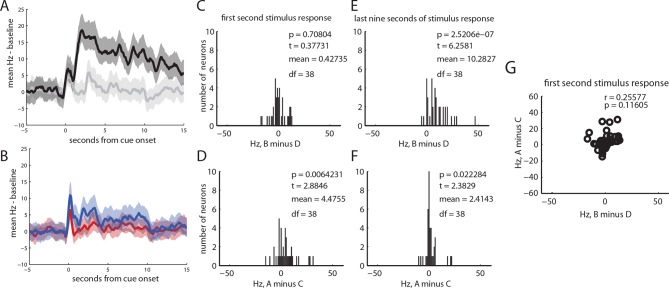
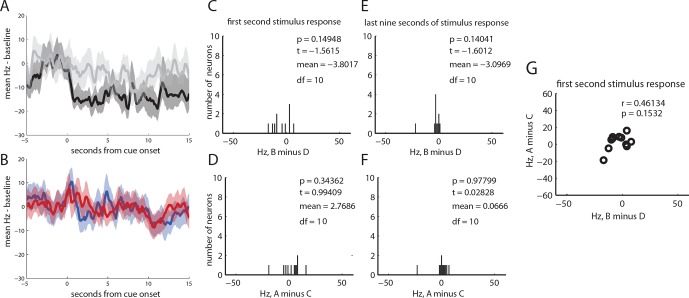
Midbrain dopamine neurons have been proposed to signal reward prediction errors as defined in temporal difference (TD) learning algorithms. While these models have been extremely powerful in interpreting dopamine activity, they typically do not use value derived through inference in computing errors. This is important because much real world behavior - and thus many opportunities for error-driven learning - is based on such predictions. Here, we show that error-signaling rat dopamine neurons respond to the inferred, model-based value of cues that have not been paired with reward and do so in the same framework as they track the putative cached value of cues previously paired with reward. This suggests that dopamine neurons access a wider variety of information than contemplated by standard TD models and that, while their firing conforms to predictions of TD models in some cases, they may not be restricted to signaling errors from TD predictions.

Keywords: dopamine; neuroscience; prediction error; rat; single unit.


Conflict of interest statement

The authors declare that no competing interests exist.

Figures

Figure 1.
Figure 1.. Rats infer the value of cues during sensory preconditioning.
Panels illustrate the task design and show the percentage of time spent in the food cup during presentation of the cues during each of the three phases of training. In the 'preconditioning' phase (A) rats learn to associate auditory cues in the absence of reinforcement; during this phase there is minimal food cup responding (ANOVA, F (3, 55) = 0.7, p = 0.52). In subsequent 'conditioning' (B), rats learn to associate one of the cues (B) with reward; conditioned responding at the food cup during B increases across sessions (ANOVA, main effect of cue: F (1, 163) = 280.1, p<0.001, main effect of session: F (5, 163) = 9.7, interaction: F (5, 163) = 10.81, p<0.001). In a final 'probe' test (C), rats are presented with each of the 4 auditory cues; conditioned responding at the food cup is maintained to B and is also now evident during presentation of A, the cue that had been paired with B in the preconditioning phase (ANOVA, main effect of cue: F (1, 167) = 8.7, p<0.001, main effect of trial: F (5, 167) = 6.08, p<0.001, interaction: F (5, 167) = 2.07, p=0.07). DOI: http://dx.doi.org/10.7554/eLife.13665.003
Figure 2.
Figure 2.. VTA dopamine neurons exhibit firing to a reward-paired cue that is consistent with TD error signaling.
We recorded 632 neurons across all days of conditioning and the final reminder session. (A) Normalized responses (AUC) are displayed for each neuron, sorted by the classification algorithm applied by Cohen, Uchida and colleagues (Cohen et al., 2012). The first three principal components (PCs) were extracted, to find the major modes of this population’s response (B), then hierarchical agglomerative clustering was used on those PCs to identify similar neural responses; groups identified are highlighted in color (C); The mean group response of each of the populations identified are displayed (D); in accordance with previous results (Cohen et al., 2012) we found populations undergoing sustained excitation, phasic excitation, and sustained inhibition. Consistent with identification as putative dopamine neurons, the average (AUC) response to cue B from the phasic group on each day of conditioning exhibited a peak response that was highest to reward early in conditioning and migrated to earlier cue onset across conditioning (E–F, r(302) = 0.24, p<0.01). This change in firing is in accordance with signaling of a TD error. DOI: http://dx.doi.org/10.7554/eLife.13665.004
Figure 3.
Figure 3.. VTA dopamine neurons exhibit firing to a pre-conditioned cue that is not consistent with TD error signaling.
We recorded 102 neurons during the probe test. AUC normalized neural responses were classified with a hierarchical clustering as in Figure 2 (A–D) in order to identify putative dopamine neurons (n = 52). In addition, we also identified 4 neurons based on traditional waveform criteria. While the classified putative dopamine neurons showed firing to all cues, they exhibited the largest responses at the onset of B, the reward-paired cue (significantly above responding to D, t (51) = 4.40, p<0.001), and to A, the cue that had been paired with B in the preconditioning phase (significantly above responding to control cue C, t (51) = 5.02, p<0.001) (E–F). Further, the activity elicited by these two cues was strongly correlated (F), suggesting that dopamine neurons code errors elicited by these two types of cues in a common framework (correlation between B–D and A–C, r (50) = 0.63, p<0.001). DOI: http://dx.doi.org/10.7554/eLife.13665.005
Figure 3—figure supplement 1.
Figure 3—figure supplement 1.. Neural responses from phasic and tonic wide-waveform neurons.
(A) raster plot of 18 trials of cue responses, resorted according to cue, for phasic responding wide waveform neuron. (B) baseline subtracted mean responses of panel (A) for cues B and D. (C) baseline subtracted mean responses to of panel (A) for cues A and C (D) raster plot of 18 trials of cue responses, resorted according to cue, for tonic excited wide waveform neuron. (E) baseline subtracted mean responses of panel (D) for cues B and D. (F) baseline subtracted mean responses to of panel D for cues A and C. DOI: http://dx.doi.org/10.7554/eLife.13665.006
Figure 3—figure supplement 2.
Figure 3—figure supplement 2.. Neural responses from 39 neurons classified as tonically excited by cue B.
(A) baseline subtracted, mean responses of all neurons to cues B and D, +/- SEM (B) baseline subtracted, mean responses of all neurons to cues A and C, +/- SEM (C) histogram of differences in neural responding to cached value (B-D) for all tonically excited neurons for the first second of cue response; there was no significant difference (t (38) = 0.37, p = 0.71) between responses to cue B and D (D) histogram of differences in neural responding to inferred value (A–C) for all tonically excited neurons for the first second of cue response; there was a significant difference between early responses to cue A and C (t (38) = 2.9, p<0.01), (E) histogram of differences in neural responding to cached value (B–D) for all tonically excited neurons for the final nine seconds of cue response; neurons fired significantly more to cue B than D (t (38)= 6.3, p>0.001) (F) histogram of differences in neural responding to inferred value (A–C) for all tonically excited neurons for the last nine seconds of cue response; there was a smaller but significant difference between responses to cue A and C (t (38) = 2.4, p<0.05) (G) scatter of individual responses to cached vs inferred value (i.e. data from panel C vs panel D); while there was a positive relationship, the correlation was not significant (r (37) =0.26, p=0.11). DOI: http://dx.doi.org/10.7554/eLife.13665.007
Figure 3—figure supplement 3.
Figure 3—figure supplement 3.. Neural responses from 11 neurons classified as tonically inhibited by cue B.
(A) baseline subtracted, mean responses of all neurons to cues B and D, +/- SEM (B) baseline subtracted, mean responses of all neurons to cues A and C, +/- SEM (C) histogram of differences in neural responding to cached value (B–D) for all tonically inhibited neurons for the first second of cue response; there was no significant difference (t (10) = -1.56, p=0.15) between responses to cue B and D (D) histogram of differences in neural responding to inferred value (A–C) for all tonically inhibited neurons for the first second of cue response; there was no significant difference (t (10) = 0.99, p = 0.34) between responses to cue A and C. (E) histogram of differences in neural responding to cached value (B–D) for all tonically inhibited neurons for the last nine seconds of cue response; there was no significant difference (t (10) = -1.6, p = 0.14) between responses to cue B and D (F) histogram of differences in neural responding to inferred value (A–C) for all tonically inhibited neurons for the last nine second of cue response; there was no significant difference (t (10) = 0.03; p = 0.98) between responses to cue A and C (G) scatter of individual responses to cached vs inferred value (i.e. data from panel C vs panel D); while there was a positive relationship, the correlation was not significant (r (9) =0.46 p=0.15). DOI: http://dx.doi.org/10.7554/eLife.13665.008

Comment in

  • The expanding role of dopamine.
    Doll BB, Daw ND. Doll BB, et al. Elife. 2016 Apr 21;5:e15963. doi: 10.7554/eLife.15963. Elife. 2016. PMID: 27099987 Free PMC article.

References

    1. Bayer HM, Glimcher PW. Midbrain dopamine neurons encode a quantitative reward prediction error signal. Neuron. 2005;47:129–141. doi: 10.1016/j.neuron.2005.05.020. - DOI - PMC - PubMed
    1. Brogden WJ. Sensory pre-conditioning. Journal of Experimental Psychology. 1939;25:323–332. doi: 10.1037/h0058944. - DOI - PubMed
    1. Bromberg-Martin ES, Matsumoto M, Hikosaka O. Dopamine in Motivational Control: Rewarding, Aversive, and Alerting. Neuron. 2010a;68:815–834. doi: 10.1016/j.neuron.2010.11.022. - DOI - PMC - PubMed
    1. Bromberg-Martin ES, Matsumoto M, Hong S, Hikosaka O. A pallidus-habenula-dopamine pathway signals inferred stimulus values. Journal of Neurophysiology. 2010b;104:1068–1076. doi: 10.1152/jn.00158.2010. - DOI - PMC - PubMed
    1. Bush RR, Mosteller F. A mathematical model for simple learning. Psychological Review. 1951;58:313–323. doi: 10.1037/h0054388. - DOI - PubMed

Publication types

LinkOut - more resources