. 2016 Mar 7:5:e10996.
doi: 10.7554/eLife.10996.

No current evidence for widespread dosage compensation in S. cerevisiae

Affiliations

No current evidence for widespread dosage compensation in S. cerevisiae

Eduardo M Torres et al. Elife. .

Abstract

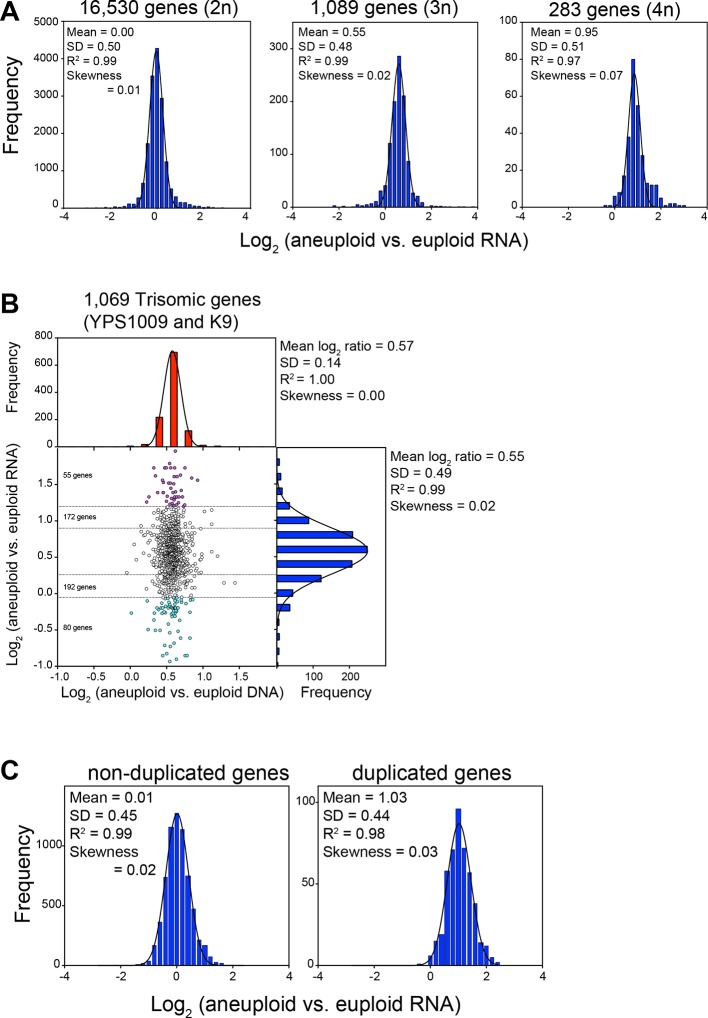
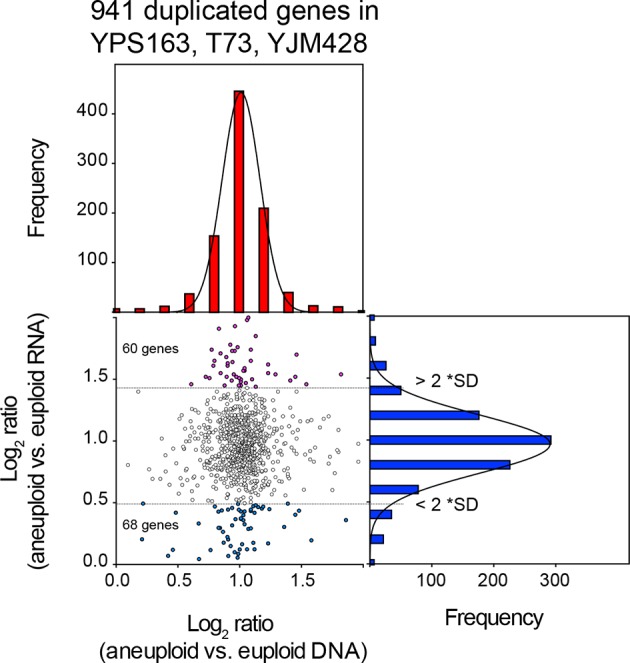
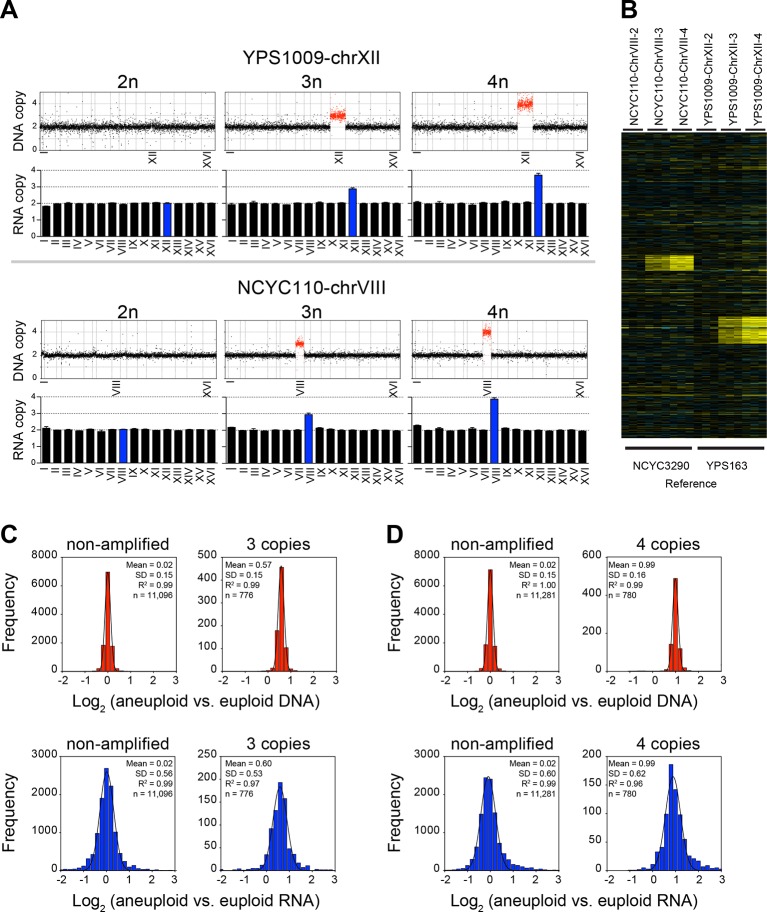
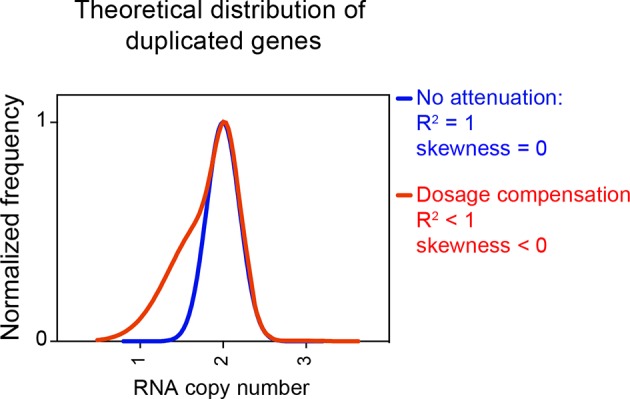
Previous studies of laboratory strains of budding yeast had shown that when gene copy number is altered experimentally, RNA levels generally scale accordingly. This is true when the copy number of individual genes or entire chromosomes is altered. In a recent study, Hose et al. (2015) reported that this tight correlation between gene copy number and RNA levels is not observed in recently isolated wild Saccharomyces cerevisiae variants. To understand the origins of this proposed difference in gene expression regulation between natural variants and laboratory strains of S. cerevisiae, we evaluated the karyotype and gene expression studies performed by Hose et al. on wild S. cerevisiae strains. In contrast to the results of Hose et al., our reexamination of their data revealed a tight correlation between gene copy number and gene expression. We conclude that widespread dosage compensation occurs neither in laboratory strains nor in natural variants of S. cerevisiae.

Keywords: S. cerevisiae; aneuploidy; cell biology; chromosomes; dosage compensation; gene expression; genes.


Conflict of interest statement

The authors declare that no competing interests exist.

Figures

Figure 1.
Figure 1.. DNA and RNA copy number of six wild S. cerevisiae strains.
(A) DNA and RNA copy number analysis of strain K9 compared to K10. Log2 ratios of aneuploid vs. euploid DNA in the order of the chromosomal location of their encoding genes are shown on the top. DNA copy number of chromosomes IX and X are shown in red. The graph below shows the average DNA copy number per chromosome. The graph below shows RNA copy number averaged per chromosome relative to K10 (n = 1). (B) DNA and RNA copy number analysis of strain YPS1009 compared to YPS163. Data are represented as in (A). Error bars represent the SD of the chromosome means from three biological replicates. Medians are identical to the means. (C) DNA and RNA copy number analysis of strain NCYC110 compared to NCYC3290. Data are represented as in (A). Error bars represent the SD of the chromosome means from three biological replicates. Medians are identical to the means. (D) DNA and RNA copy number analysis of strain YJM428 compared to YJM308. Log2 ratios of aneuploid vs. euploid DNA in the order of the chromosomal location of their encoding genes are shown on the top. DNA copy number of chromosomes XII and XVI are shown in red. Arrows indicate an amplification of part of chromosome III (red) and a loss of part of chromosome XV (green). The graph below shows the average DNA copy number per chromosome relative to strain YJM308. The graph below shows RNA copy number averaged per chromosome. Error bars represent the SD of the chromosome means from two biological replicates. Medians are identical to the means. Asterisk indicate significant deviations from the expected value as determined by a one sample t-test (p < 0.01). (E) DNA and RNA copy number analysis of strain Y2189 compared to Y2209. Data are represented as in (D). Error bars represent the SD of the chromosome means from two biological replicates. Medians are identical to the means. Asterisk indicate significant deviations from the expected value as determined by a one sample t-test (p < 0.01). Note that chromosome IV shows increased RNA copy number relative to DNA copy number. (F) DNA and RNA copy number analysis of strain K1 compared to K10. Data are represented as in (D). Asterisk indicate significant deviations from the expected value as determined by a one sample t-test (p < 0.01). Note that chromosomes I and VI exhibit an increased copy number at the DNA level but not at the RNA level. (G) Gene expression of six aneuploid strains ordered by chromosome. Experiments (columns) of two biological replicates for strains YJM428 and Y2189, three biological replicates for strains YPS1009 and NCYC110, and one experiment for strains K1 and K9 are shown. DOI: http://dx.doi.org/10.7554/eLife.10996.003
Figure 2.
Figure 2.. Karyotypes of aneuploid wild S. cerevisiae strains Y3, Y6 UC5, CBS7960, and WE372 and euploid control strains.
(A–E) Relative DNA copy of WE372 (A), Y3 (B), Y6 (C), UC5 (D), and CBS7960 (E) compared to S288C. Log2 (aneuploid vs. euploid DNA) per gene relative (top) are shown in the order of the chromosomal location of their encoding genes. DNA copy numbers of amplified chromosomes are shown in red. Bar graphs (bottom) represent the DNA copy numbers averaged per chromosome. Asterisks indicate significant deviations from expected integral value using one sample t test (p < 0.01). (FG) Relative DNA copy of K10 (F), YJM308 (G), and Y2189 (H) compared to S288C. Log2 ratio (aneuploid vs. euploid DNA) per gene are shown in the order of the chromosomal location of their encoding genes. DOI: http://dx.doi.org/10.7554/eLife.10996.004
Figure 3.
Figure 3.. RNA levels correlate with DNA copy number in wild and laboratory strains of S. cerevisiae.
(A) Histogram of the log2 ratios of the RNA copy number of genes located on euploid chromosomes (left panel, strains YPS1009, NCYC110, and K9), genes present on trisomic chromosomes (3n, middle panel, YPS1009, and K9), and genes present on tetrasomic chromosomes (right panel, NCYC110), relative to euploid controls are shown. Bin size for all histograms is log2 ratio of 0.2, medians are identical to means. Fits to a normal distribution (black line), means and goodness of fit (R2) and skewness are shown for each distribution. (B) The average log2 (aneuploid vs. euploid RNA) of triplicated genes plotted against average log2 (aneuploid vs. euploid DNA) in strains YPS1009 and K9. Histogram of the log2 ratios of the DNA copy number is shown in red (mean log2 ratio = 0.57, SD = 0.14, R2 = 1.0, skewness = 0.00). Histogram of the log2 ratios of the RNA copy number of is shown in blue (median = mean = 0.55, skewness = 0.02). Fits to a normal distribution are shown (black line). Numbers of genes that show RNA copy numbers lower or higher than 1 or 2 SD from the mean are shown (separated by dotted lines). (C) Histogram of the log2 ratios of the RNA copy number of genes located on euploid chromosomes (left panel), and genes present on duplicated chromosomes (right panel) in two disomic laboratory strains (disome V and XVI) relative to the euploid W303 control are shown. Bin size for all histograms is log2 ratio of 0.2, medians are identical to means. Fits to a normal distribution are shown (black line). Means, goodness of fit (R2) and skewness are shown for each distribution. DOI: http://dx.doi.org/10.7554/eLife.10996.005
Figure 4.
Figure 4.. DNA and RNA copy number of euploid and aneuploid isogenic wild S. cerevisiae strains.
(A) Plots for strains YPS163-chrVIII-2n, T73-chrVIII-4n, and YJM428-chrXVI-4n, represent the log2 ratio of their relative DNA copy number compared to their isogenic and euploid counterparts. DNA copy numbers are shown in the order of the chromosomal location of their encoding genes (left). DNA copy numbers of amplified chromosomes are shown in red. Bar graphs on the right represent the RNA copy numbers averaged per chromosome for aneuploid strains relative to euploid reference strains. The average RNA copies of non-amplified chromosomes are shown in black. Amplified chromosomes, as predicted by the karyotype, are shown in blue. (B) Gene expression of three aneuploid strains ordered by chromosome position. Experiments (columns) of two biological replicates are shown. (C) Histogram of the log2 ratios of the DNA (top) and RNA (bottom) copy number of genes located on euploid chromosomes (left) and genes located on duplicated chromosomes (right) relative to euploid controls are shown. Bin size for all histograms is log2 ratio of 0.2, medians are identical to means and all distributions show a skewness of 0.01. Fits to a normal distribution are shown (black line) and so are means and goodness of fit (R2) for each distribution. DOI: http://dx.doi.org/10.7554/eLife.10996.007
Figure 5.
Figure 5.. Comparison of DNA and RNA copy number distributions of strains YPS163, T73, and YJM428.
The average log2 (aneuploid vs. euploid RNA) of 941 genes located on duplicated chromosomes plotted against the average log2 (aneuploid vs. euploid DNA) in strains YPS163, T73, and YJM428. Histogram of the log2 ratios of the DNA copy number is shown in red. Histogram of the log2 ratios of the RNA copy number is shown in blue. Fits to a normal distribution are shown (black line). The number of genes that show RNA copy numbers lower or higher than 2 SD from the mean are shown (separated by dotted lines). DOI: http://dx.doi.org/10.7554/eLife.10996.008
Figure 6.
Figure 6.. RNA copy number proportionally increases with DNA copy number in aneuploid series of wild S. cerevisiae strains.
(A) Plots for strain series YPS1009-XII-2n, YPS1009-XII-3n, YPS1009-XII-4n and strain series NCYC110-chrVIII-2n, NCYC110-chrVIII-3n, NCYC110-chrVIII-4n represent the DNA copy number compared to their euploid counterparts. DNA copy numbers are shown in the order of the chromosomal location of their encoding genes. DNA copy numbers of amplified chromosomes are shown in red. Bar graphs below represent the RNA copy numbers averaged per chromosome for aneuploid strains relative to euploid reference strains. The average RNA copies of non-amplified chromosomes are shown in black. Amplified chromosomes, as predicted by the karyotype, are shown in blue. (B) Gene expression of strain series YPS1009-XII-2n, YPS1009-XII-3n, YPS1009-XII-4n, and strain series NCYC110-chrVIII-2n, NCYC110-chrVIII-3n, NCYC110-chrVIII ordered by chromosome position. Experiments (columns) of three biological replicates are shown. (C) Histogram of the log2 ratios of the DNA copy number of genes located on euploid chromosomes (top left) and genes located on trisomic chromosomes (top right) in strains YPS1009-chrXII-3n and NCYC110-chrVIII-3n relative to euploid controls are shown. Fits to a normal distribution are shown (black line). Histogram of the log2 ratios of the RNA copy number of genes located on euploid chromosomes (bottom left) and genes present on trisomic chromosomes (bottom right) in strains YPS1009-chrXII-3n and NCYC110-chrVIII-3n relative to euploid controls are shown. Fits to a normal distribution are shown (black line). (D) Histogram of the log2 ratios of the DNA copy number of genes located on euploid chromosomes (top left) and genes located on tetrasomic chromosomes (top right) in strains YPS1009-chrXII-4n and NCYC110-chrVIII-4n relative to euploid controls are shown. Fits to a normal distribution are shown (black line). Histogram of the log2 ratios of the RNA copy number of genes located on euploid chromosomes (bottom left) and genes located on tetrasomic chromosomes (bottom right) in strains YPS1009-chrXII-4n and NCYC110-chrVIII-4n relative to euploid controls are shown. Fits to a normal distribution are shown (black line). DOI: http://dx.doi.org/10.7554/eLife.10996.009
Figure 7.
Figure 7.. Theoretical distribution of RNA copy number of dosage compensated duplicated genes.
The theoretical distribution of RNA copy number of duplicated genes when no dosage compensation takes place is shown in blue. The theoretical distribution of RNA copy number of duplicated genes when 30% of the genes are dosage compensated is shown in red. The fit to a normal distribution shows negative skewness values (red). DOI: http://dx.doi.org/10.7554/eLife.10996.010
Figure 8.
Figure 8.. Evaluation of the analysis tools employed by Hose et al. (2015).
(A) RNA copy numbers averaged per chromosome of normalized RNA-seq data obtained by Hose et al. (2015). Data provided by Hose et al. (2015). (B) Standard deviations of RNA-seq data are greater than those of DNA-seq data. Histograms of DNA-seq RPKM and RNA-seq RPKM for strain K10 are shown. (C) Linear regression fits of RNA versus DNA copy number are shown for several genes identified as class 3a dosage compensated genes by Hose et al. (2015). Eight genes from chromosome XII and two genes from chromosome VIII are shown. Average log2 ratio of aneuploid vs. euploid RNA is shown. Error bars represent SD from three biological replicates. DOI: http://dx.doi.org/10.7554/eLife.10996.011

References

    1. Chikashige Y, Tsutsumi C, Okamasa K, Yamane M, Nakayama Jun-ichi, Niwa O, Haraguchi T, Hiraoka Y. Gene expression and distribution of Swi6 in partial aneuploids of the fission yeast schizosaccharomyces pombe. Cell Structure and Function. 2007;32:149–161. doi: 10.1247/csf.07036. - DOI - PubMed
    1. Dabeva MD, Warner JR. The yeast ribosomal protein L32 and its gene. The Journal of Biological Chemistry. 1987;262:16055–16059. - PubMed
    1. Dephoure N, Hwang S, O'Sullivan C, Dodgson SE, Gygi SP, Amon A, Torres EM. Quantitative proteomic analysis reveals posttranslational responses to aneuploidy in yeast. eLife. 2014;3 doi: 10.7554/eLife.03023. - DOI - PMC - PubMed
    1. Dunham MJ, Badrane H, Ferea T, Adams J, Brown PO, Rosenzweig F, Botstein D. Characteristic genome rearrangements in experimental evolution of saccharomyces cerevisiae. Proceedings of the National Academy of Sciences of the United States of America. 2002;99:16144–16149. doi: 10.1073/pnas.242624799. - DOI - PMC - PubMed
    1. Gasch AP, Spellman PT, Kao CM, Carmel-Harel O, Eisen MB, Storz G, Botstein D, Brown PO. Genomic expression programs in the response of yeast cells to environmental changes. Molecular Biology of the Cell. 2000;11:4241–4257. doi: 10.1091/mbc.11.12.4241. - DOI - PMC - PubMed

Publication types

LinkOut - more resources