Case Reports
. 2016 Feb 24:7:1-8.
doi: 10.4137/JCM.S34825. eCollection 2016.

Continuous Glucose Monitoring in Patients with Abnormal Glucose Tolerance during Pregnancy: A Case Series

Affiliations
Case Reports

Continuous Glucose Monitoring in Patients with Abnormal Glucose Tolerance during Pregnancy: A Case Series

Mie Tonoike et al. Jpn Clin Med. .

Abstract

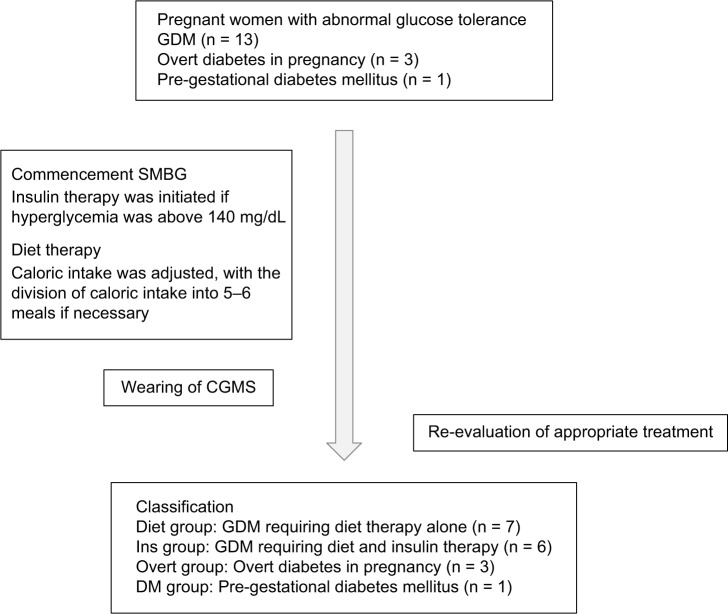
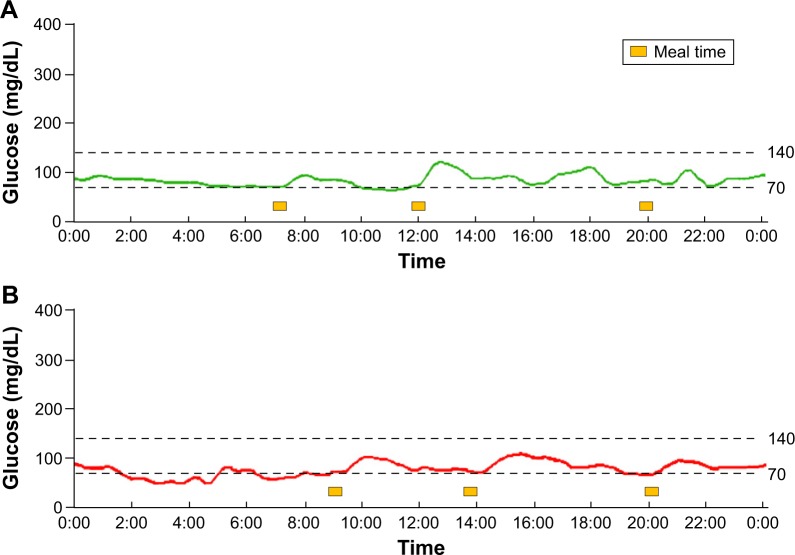
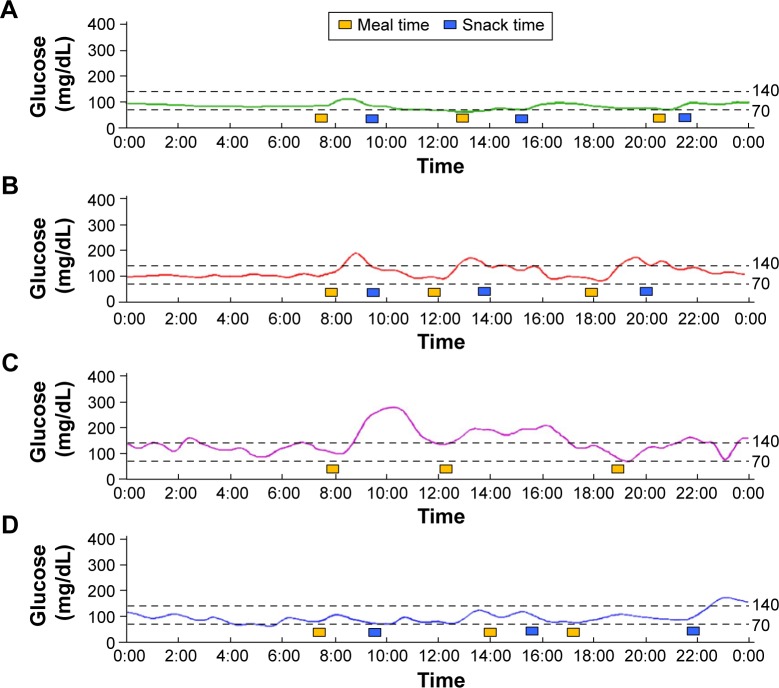
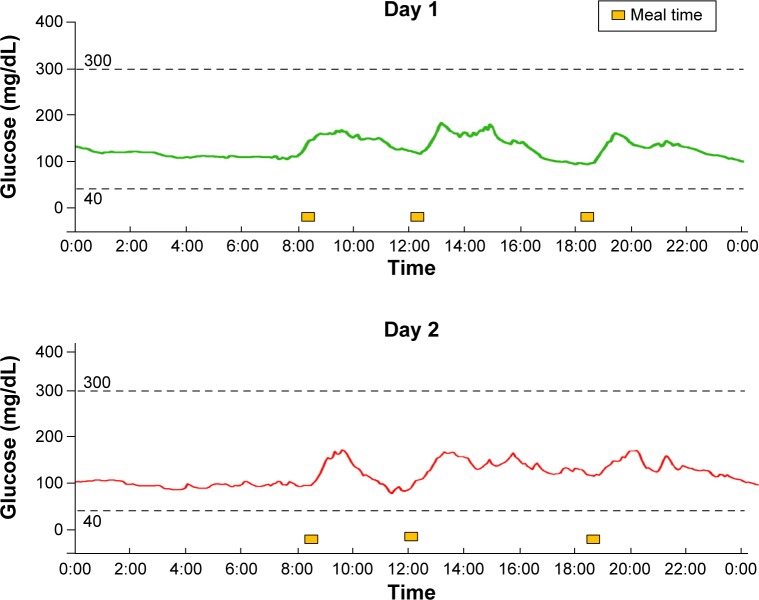
Abnormal glucose tolerance during pregnancy is associated with perinatal complications. We used continuous glucose monitoring (CGM) in pregnant women with glucose intolerance to achieve better glycemic control and to evaluate the maternal glucose fluctuations. We also used CGM in women without glucose intolerance (the control cases). Furthermore, the standard deviation (SD) and mean amplitude of glycemic excursions (MAGE) were calculated for each case. For the control cases, the glucose levels were tightly controlled within a very narrow range; however, the SD and MAGE values in pregnant women with glucose intolerance were relativity high, suggesting postprandial hyperglycemia. Our results demonstrate that pregnant women with glucose intolerance exhibited greater glucose fluctuations compared with the control cases. The use of CGM may help to improve our understanding of glycemic patterns and may have beneficial effects on perinatal glycemic control, such as the detection of postprandial hyperglycemia in pregnant women.

Keywords: continuous glucose monitoring; gestational diabetes mellitus; mean amplitude of glucose excursions; overt diabetes in pregnancy; pregestational diabetes.


Figures

Figure 1
Figure 1
Diagram of the present case series.
Figure 2
Figure 2
(A) CGM data for a nonpregnant woman with normal glucose tolerance. All the glucose levels were within a narrow range. (B) CGM data for a pregnant woman with normal glucose tolerance at 36 weeks and 5 days. The glucose levels showed an almost flat curve and were within a narrower range than those of the nonpregnant woman with normal glucose tolerance. All the glucose values, including those obtained during the postprandial period, were below 120 mg/dL, as measured using CGM.
Figure 3
Figure 3
(A) CGM data for a woman in the Diet group at 34 weeks and 3 days of pregnancy. SMBG monitoring did not reveal preprandial or postprandial hyperglycemia. CGM also showed that the glucose level remained below 140 mg/dL. This case was only treated with diet therapy, including the division of caloric intake into five to six meals. The controlled glycemic level remained within a narrow range until delivery. (B) CGM data for a woman in the Ins group at 33 weeks and 2 days of pregnancy. The CGM data were recorded after caloric restriction and the division of caloric intake into five to six meals. Postprandial hyperglycemia occasionally occurred at one hour after meals; therefore, the woman began receiving insulin injections immediately before meals. (C) CGM data for a woman in the Overt group at 31 weeks and 2 days of pregnancy. The woman had already exhibited postprandial hyperglycemia during SMBG; therefore, caloric restriction and insulin injections had been immediately initiated. The CGM data were recorded after insulin injection and diet therapy. (D) CGM data for a women in the Overt group at 34 weeks and 5 days of pregnancy. The woman had a high HbA1c level (6.7%) when she became pregnant, but her HbA1c level had decreased during her pregnancy. Therefore, she initially received dietary therapy alone. This CGM figure was recorded after dietary therapy, which included the division of caloric intake into five to six meals. Postprandial hyperglycemia was occasionally observed, but most of her glucose levels were below 140 mg/dL. This case continued to be treated with dietary therapy alone.
Figure 4
Figure 4
CGM data for a pregnant woman in the DM group. The HbA1c level of the woman was 9.8%. Soon after the detection of pregnancy, she began receiving insulin injections. The data were recorded at 36 weeks and 1 day and at 36 weeks and 2 days. Because of the adjustment to the insulin dose, excessive hyperglycemia was not observed.

References

    1. Norbert F. Banting lecture 1980. Of pregnancy and progeny. Diabetes. 1980;29:1006–1022. - PubMed
    1. Zhou J, Li H, Ran X, et al. Reference values for continuous glucose monitoring in Chinese subjects. Diabetes Care. 2009;32(7):1188–1193. - PMC - PubMed
    1. Juvenile Diabetes Research Foundation Continuous Glucose Monitoring Study Group. Fox LA, Beck RW. Variation of interstitial glucose measurements assessed by continuous glucose monitors in healthy, nondiabetic individuals. Diabetes Care. 2010;33(6):1297–1299. - PMC - PubMed
    1. Tsujino D, Nishimura R, Taki K, Miyashita Y, Morimoto A, Tajima N. Daily glucose profiles in Japanese people with normal glucose tolerance as assessed by continuous glucose monitoring. Diabetes Technol Ther. 2009;11(7):457–460. - PubMed
    1. Yariv Y, Ben-Haroush A, Chen R, Rosenn B, Hod M, Lager O. Diurnal glycemic profile in obese and normal weight nondiabetic pregnant women. Am J Obstet Gynecol. 2004;191:576–581. - PubMed

Publication types

LinkOut - more resources