. 2015 Sep 25:13:504-13.
doi: 10.1016/j.csbj.2015.09.001. eCollection 2015.

Searching for Drug Synergy in Complex Dose-Response Landscapes Using an Interaction Potency Model

Affiliations

Searching for Drug Synergy in Complex Dose-Response Landscapes Using an Interaction Potency Model

Bhagwan Yadav et al. Comput Struct Biotechnol J. .

Erratum in

Abstract

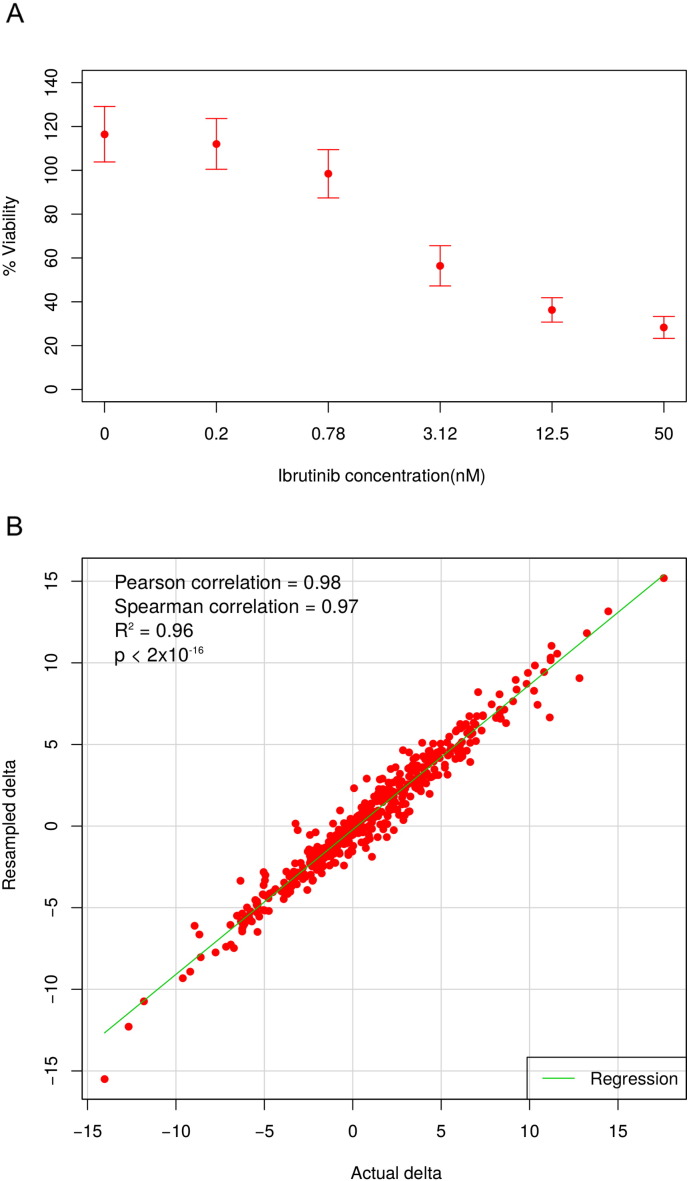
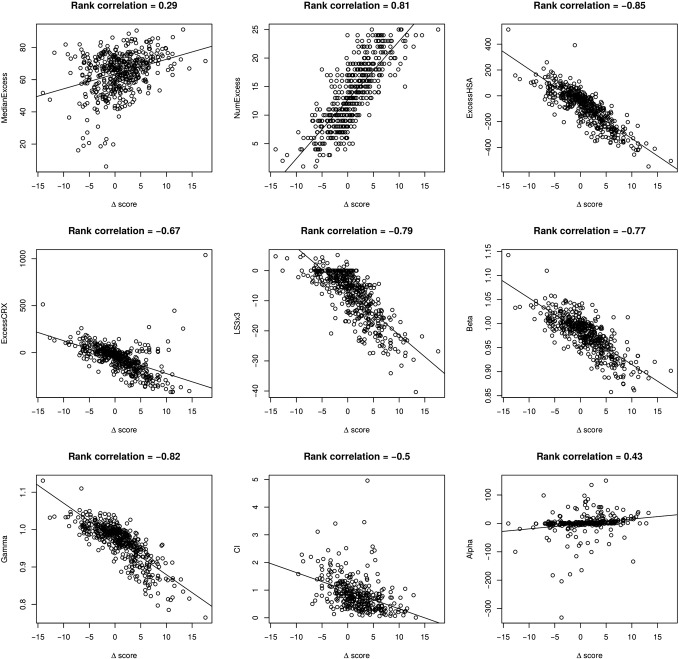
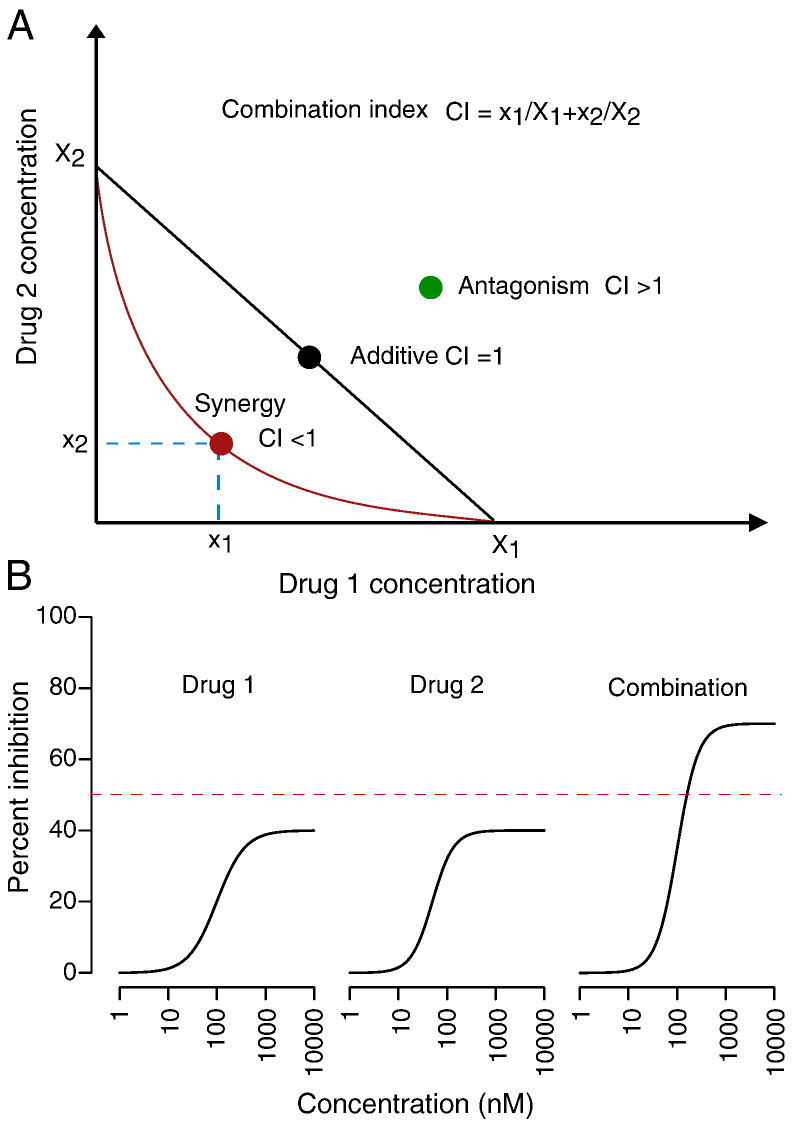
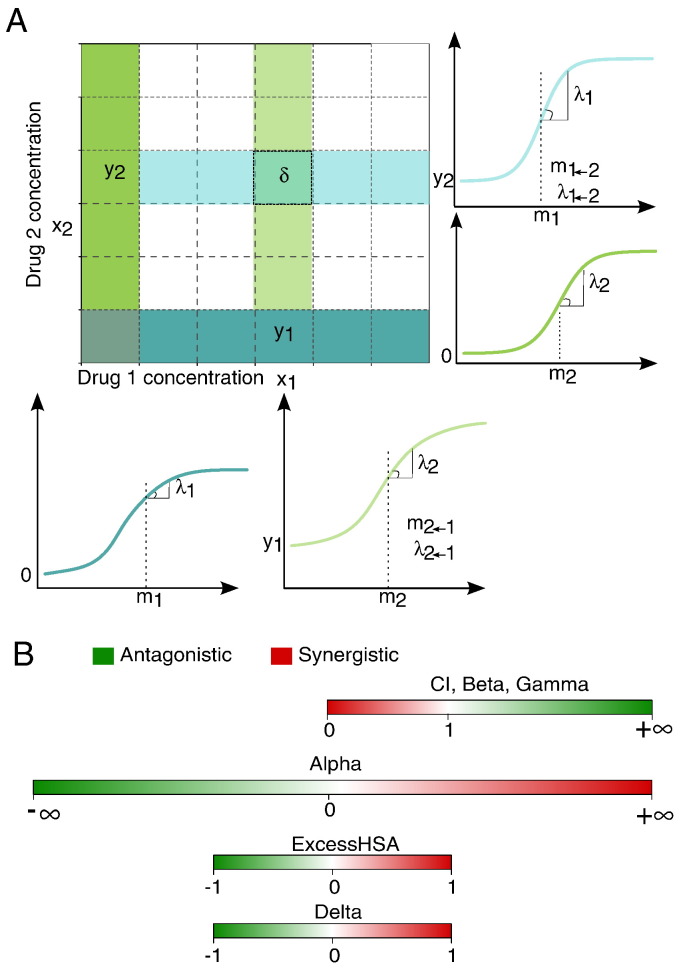
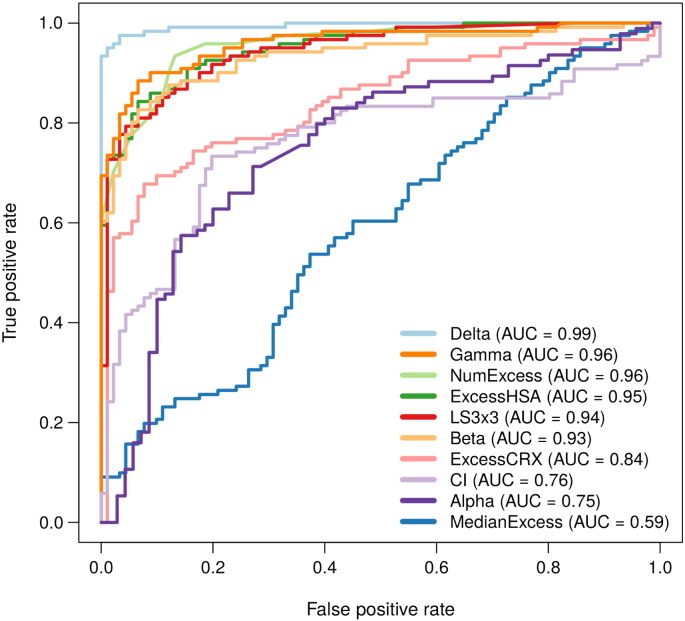
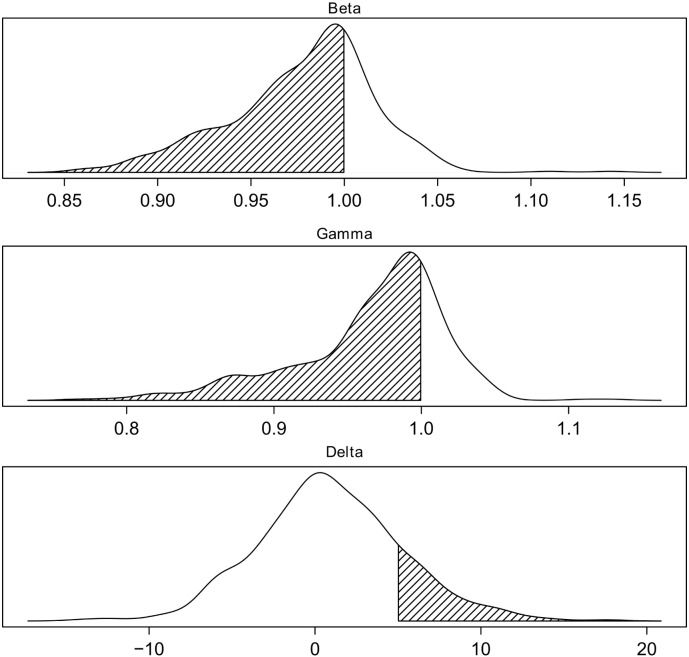
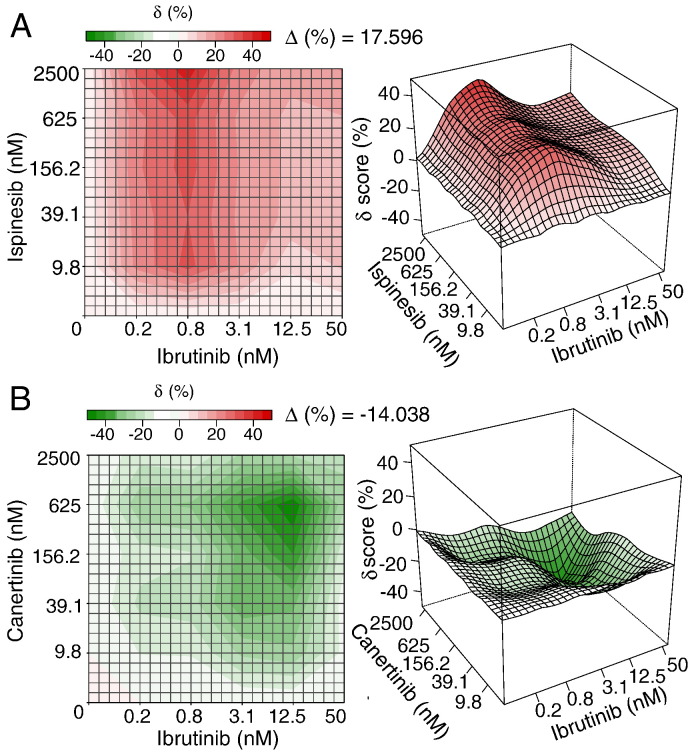
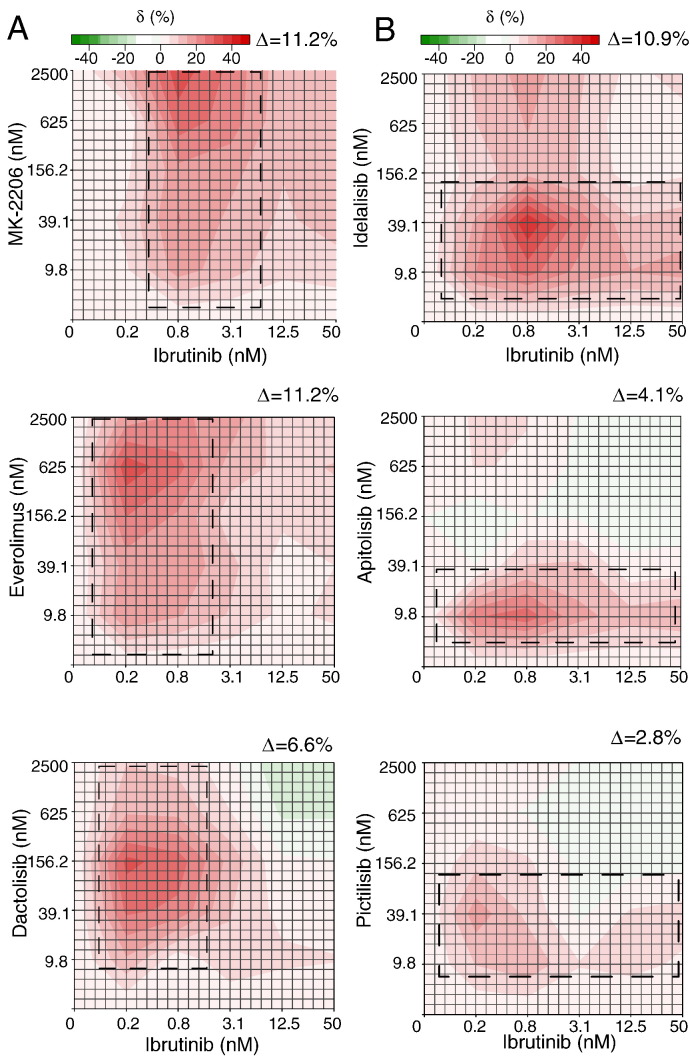
Rational design of multi-targeted drug combinations is a promising strategy to tackle the drug resistance problem for many complex disorders. A drug combination is usually classified as synergistic or antagonistic, depending on the deviation of the observed combination response from the expected effect calculated based on a reference model of non-interaction. The existing reference models were proposed originally for low-throughput drug combination experiments, which make the model assumptions often incompatible with the complex drug interaction patterns across various dose pairs that are typically observed in large-scale dose-response matrix experiments. To address these limitations, we proposed a novel reference model, named zero interaction potency (ZIP), which captures the drug interaction relationships by comparing the change in the potency of the dose-response curves between individual drugs and their combinations. We utilized a delta score to quantify the deviation from the expectation of zero interaction, and proved that a delta score value of zero implies both probabilistic independence and dose additivity. Using data from a large-scale anticancer drug combination experiment, we demonstrated empirically how the ZIP scoring approach captures the experimentally confirmed drug synergy while keeping the false positive rate at a low level. Further, rather than relying on a single parameter to assess drug interaction, we proposed the use of an interaction landscape over the full dose-response matrix to identify and quantify synergistic and antagonistic dose regions. The interaction landscape offers an increased power to differentiate between various classes of drug combinations, and may therefore provide an improved means for understanding their mechanisms of action toward clinical translation.

Keywords: Dose–response matrix; Drug combination scoring; High-throughput screening; Interaction landscape.


Figures

Supplementary Fig. 1
(A) The means and standard deviations of the cell viability in response to six concentrations of ibrutinib. (B) The consistency between the delta scores calculated using the actual data and the simulated data.
Supplementary Fig. 2
The agreement between the delta scoring and the other scoring methods. The delta scoring was highly correlated with the HSA, beta and gamma scores, but not with CI and alpha scores.
Fig. 1
Fig. 1
The concept of Combination Index (CI) based on the Loewe additivity model. (A) Loewe additivity with CI = 1 can be visualized as a straight line at a two-dimensional isobologram with the doses of drug 1 and drug 2 as coordinates. A synergistic (CI < 1) and antagonistic (CI > 1) drug combination will be positioned below and above the additivity line, respectively (adopted from [9]). (B) Loewe additivity model cannot directly assess such drug interaction in which a combination effect is higher than the achievable effect of the individual drugs, even though by intuition one would expect a clinically relevant synergy in such cases.
Fig. 2
Fig. 2
(A) Formulation of the ZIP model and the delta scoring illustrated in a dose–response matrix. To evaluate the degree of interaction at a dose combination (x1x2), the midpoint m and the shape parameter λ from the individual drug responses (the first column and the last row) as well as their combined effects at column x1 and row x2 are compared. The delta scoring considers the changes of m and λ for the dose–response curves between drug 1 alone (the bottom row) and the combination after adding x2 (row x2), as well as between drug 2 alone (the first column) and the combination after adding x1 (column x1). (B) Scale and interpretation of the drug interaction scores. Each scoring method determines a synergistic drug combination differently. The delta scoring quantifies the synergistic effects as the percentage inhibition values and thus a non-interaction will correspond to delta value of 0. Alpha and HSA also have a score of 0 for non-interaction, whereas for CI, beta and gamma scores, the reference score for non-interaction stands at 1. CI, beta and gamma scores are left-bounded at 0. The directions of the interaction scores are also different. For CI, beta and gamma, a lower score is more synergistic while for delta, alpha and HSA it is the opposite interpretation.
Fig. 3
Fig. 3
Classification accuracy of the drug interaction scoring methods. The ROC (receiver operator characteristic) curves were plotted using a visual classification of the raw drug combination data, which was blinded to the quantitative scoring methods. The area under the ROC curve (AUROC) is shown for each scoring method when classifying 112 synergistic and 91 antagonistic drug combinations. The statistical significance between the observed AUROCs can be found in Supplementary Table 2. Classification accuracy of the drug interaction scoring methods. The ROC (receiver operator characteristic) curves were plotted using a visual classification of the raw drug combination data, which was blinded to the quantitative scoring methods. The area under the ROC curve (AUROC) is shown for each scoring method when classifying 112 synergistic and 91 antagonistic drug combinations. The statistical significance between the observed AUROCs can be found in Supplementary Table 2.
Fig. 4
Fig. 4
Density plots for beta, gamma and delta scores across the full set of 466 drug combinations in the Mathews Griner data. Beta and gamma scores tend to overestimate the number of synergistic combinations (shaded areas), while delta minimizes the rate of false positives by applying a threshold of 5% response, which is the typical noise level in a large-scale drug combination experiment.
Fig. 5
Fig. 5
The top synergistic and antagonistic drug combinations identified from the Mathews Griner data. (A) The ispinesib and ibrutinib combination. (B) The canertinib and ibrutinib combination. For each combination, the interaction landscapes are shown in both 2D and 3D.δ: the excess % inhibition beyond the expectation by the ZIP model; Δ: the average δ scores over the dose–response matrix. The complete interaction landscapes for all the 466 drug combinations can be found in Supplementary Fig. 3. The top synergistic and antagonistic drug combinations identified from the Mathews Griner data. (A) The ispinesib and ibrutinib combination. (B) The canertinib and ibrutinib combination. For each combination, the interaction landscapes are shown in both 2D and 3D.δ: the excess % inhibition beyond the expectation by the ZIP model; Δ: the average δ scores over the dose–response matrix. The complete interaction landscapes for all the 466 drug combinations can be found in Supplementary Fig. 3.
Fig. 6
Fig. 6
The different interaction patterns for PI3K inhibitors and ibrutinib. (A) Ibrutinib-driven synergy is triggered by a fixed dose of ibrutinib and becomes visible at the full dose ranges for a PI3K inhibitor, highlighted as a vertical box in the interaction landscape. (B) In contrast, PI3K-driven synergy is mainly constrained within a horizontal box aligned with the dose.

References

    1. Flaherty K.T., Infante J.R., Daud A., Gonzalez R., Kefford R.F. Combined BRAF and MEK inhibition in melanoma with BRAF V600 mutations. N Engl J Med. 2012;367:1694–1703. - PMC - PubMed
    1. Fitzgerald J.B., Schoeberl B., Nielsen U.B., Sorger P.K. Systems biology and combination therapy in the quest for clinical efficacy. Nat Chem Biol. 2006;2:458–466. - PubMed
    1. Lehár J., Krueger A.S., Avery W., Heilbut A.M., Johansen L.M. Synergistic drug combinations tend to improve therapeutically relevant selectivity. Nat Biotechnol. 2009;27:659–666. - PMC - PubMed
    1. Borisy A.A., Elliott P.J., Hurst N.W., Lee M.S., Lehar J. Systematic discovery of multicomponent therapeutics. Proc Natl Acad Sci U S A. 2003;100:7977–7982. - PMC - PubMed
    1. Berenbaum M.C. What is synergy? Pharmacol Rev. 1989;41:93–141. - PubMed