

Measurement of Outflow Facility Using iPerfusion
- PMID: 26949939
- PMCID: PMC4780770
- DOI: 10.1371/journal.pone.0150694
Measurement of Outflow Facility Using iPerfusion
Abstract
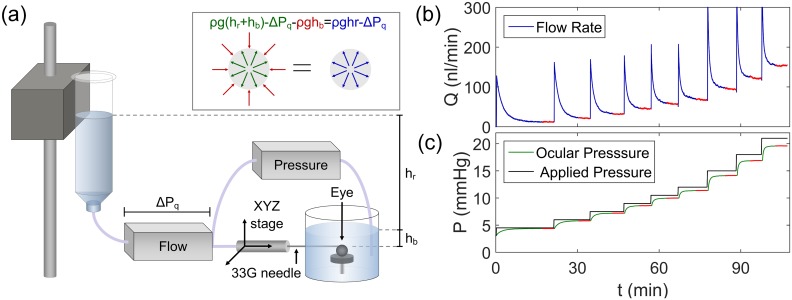
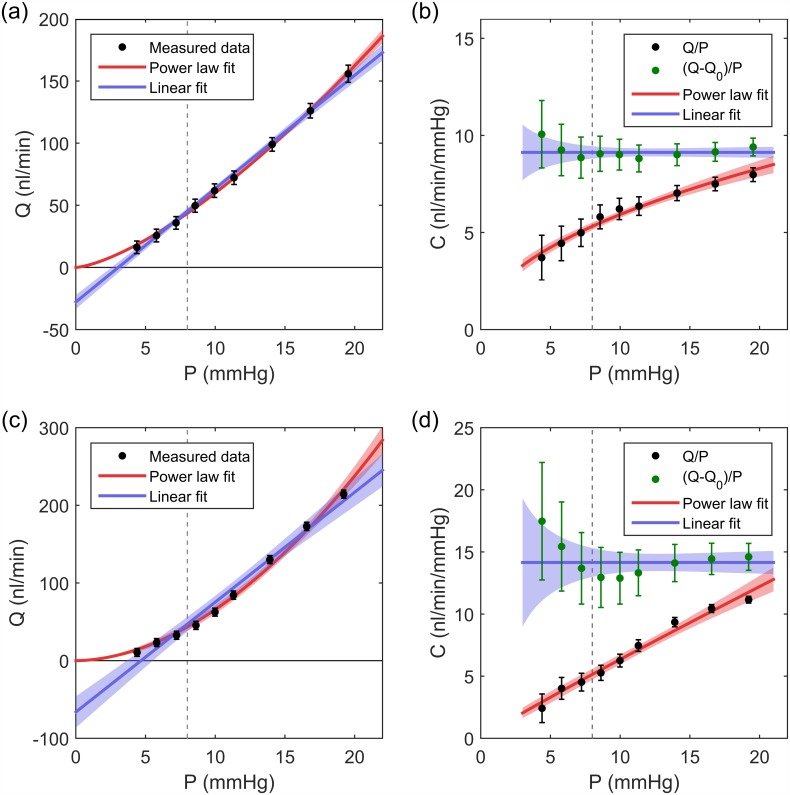
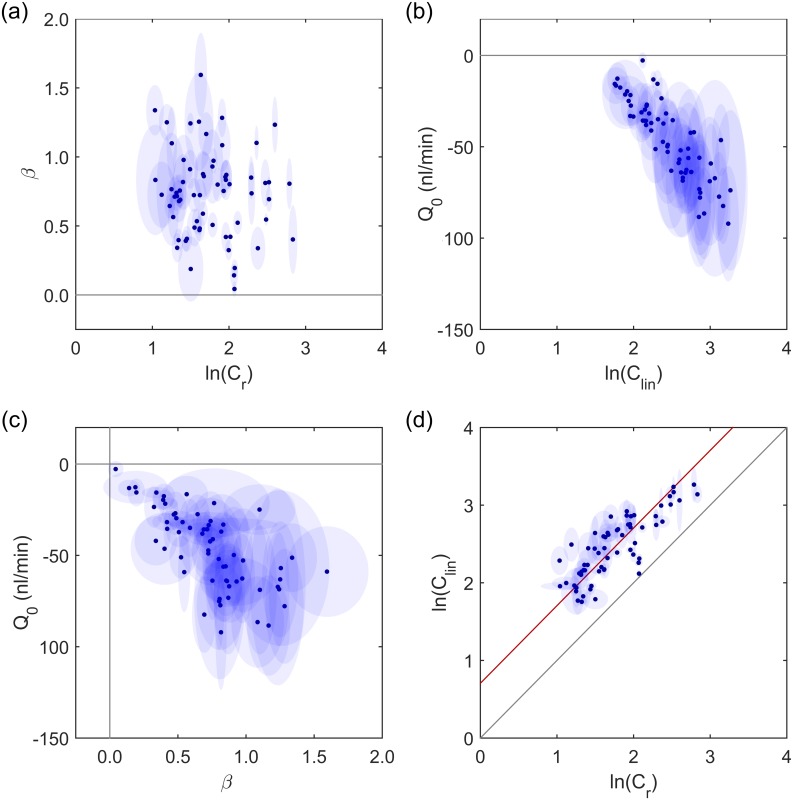
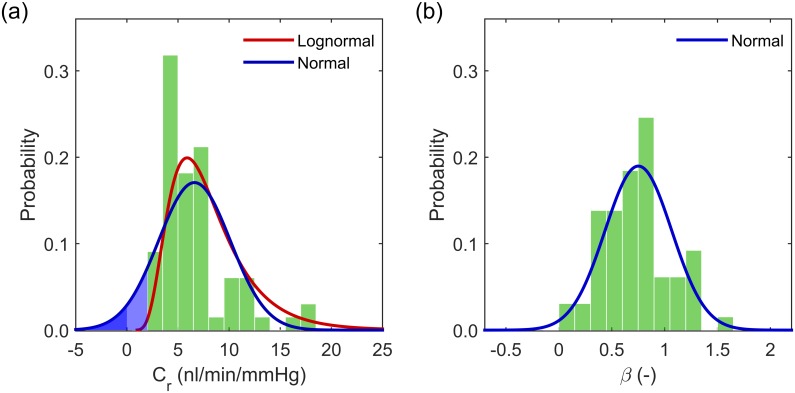
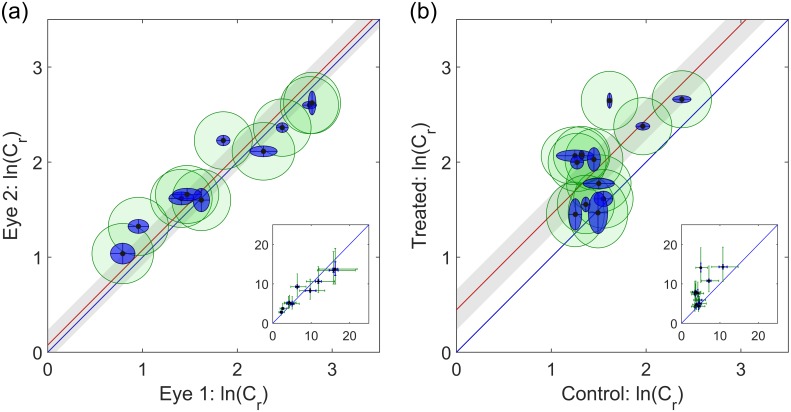
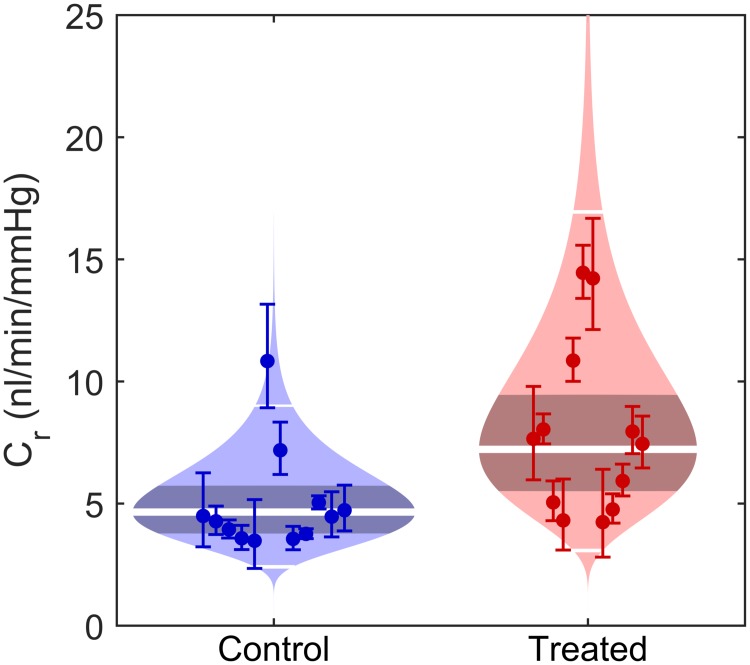
Elevated intraocular pressure (IOP) is the predominant risk factor for glaucoma, and reducing IOP is the only successful strategy to prevent further glaucomatous vision loss. IOP is determined by the balance between the rates of aqueous humour secretion and outflow, and a pathological reduction in the hydraulic conductance of outflow, known as outflow facility, is responsible for IOP elevation in glaucoma. Mouse models are often used to investigate the mechanisms controlling outflow facility, but the diminutive size of the mouse eye makes measurement of outflow technically challenging. In this study, we present a new approach to measure and analyse outflow facility using iPerfusion™, which incorporates an actuated pressure reservoir, thermal flow sensor, differential pressure measurement and an automated computerised interface. In enucleated eyes from C57BL/6J mice, the flow-pressure relationship is highly non-linear and is well represented by an empirical power law model that describes the pressure dependence of outflow facility. At zero pressure, the measured flow is indistinguishable from zero, confirming the absence of any significant pressure independent flow in enucleated eyes. Comparison with the commonly used 2-parameter linear outflow model reveals that inappropriate application of a linear fit to a non-linear flow-pressure relationship introduces considerable errors in the estimation of outflow facility and leads to the false impression of pressure-independent outflow. Data from a population of enucleated eyes from C57BL/6J mice show that outflow facility is best described by a lognormal distribution, with 6-fold variability between individuals, but with relatively tight correlation of facility between fellow eyes. iPerfusion represents a platform technology to accurately and robustly characterise the flow-pressure relationship in enucleated mouse eyes for the purpose of glaucoma research and with minor modifications, may be applied in vivo to mice, as well as to eyes from other species or different biofluidic systems.
Conflict of interest statement
Figures
Similar articles
-
Direct measurement of pressure-independent aqueous humour flow using iPerfusion.Exp Eye Res. 2017 Sep;162:129-138. doi: 10.1016/j.exer.2017.07.008. Epub 2017 Jul 16. Exp Eye Res. 2017. PMID: 28720436 Free PMC article.
-
Intracranial pressure modulates aqueous humour dynamics of the eye.J Physiol. 2020 Jan;598(2):403-413. doi: 10.1113/JP278768. Epub 2020 Jan 9. J Physiol. 2020. PMID: 31769030 Free PMC article.
-
Simulation of gravity- and pump-driven perfusion techniques for measuring outflow facility of ex vivo and in vivo eyes.PLoS One. 2023 Nov 21;18(11):e0294607. doi: 10.1371/journal.pone.0294607. eCollection 2023. PLoS One. 2023. PMID: 37988400 Free PMC article.
-
Targeting outflow facility in glaucoma management.Surv Ophthalmol. 2003 Apr;48 Suppl 1:S17-20. doi: 10.1016/s0039-6257(03)00003-1. Surv Ophthalmol. 2003. PMID: 12852430 Review.
-
[A challenge to primary open-angle glaucoma including normal-pressure. Clinical problems and their scientific solution].Nippon Ganka Gakkai Zasshi. 2012 Mar;116(3):233-67; discussion 268. Nippon Ganka Gakkai Zasshi. 2012. PMID: 22568103 Review. Japanese.
Cited by
-
Detection and characterization of tree shrew retinal venous pulsations: An animal model to study human retinal venous pulsations.Exp Eye Res. 2019 Aug;185:107689. doi: 10.1016/j.exer.2019.06.003. Epub 2019 Jun 6. Exp Eye Res. 2019. PMID: 31175860 Free PMC article.
-
Development and testing of a metabolic chamber for effluent collection during whole eye perfusions.Exp Eye Res. 2023 Nov;236:109652. doi: 10.1016/j.exer.2023.109652. Epub 2023 Sep 16. Exp Eye Res. 2023. PMID: 37717688 Free PMC article.
-
Smarce1 and Tensin 4 Are Putative Modulators of Corneoscleral Stiffness.Front Bioeng Biotechnol. 2021 Feb 5;9:596154. doi: 10.3389/fbioe.2021.596154. eCollection 2021. Front Bioeng Biotechnol. 2021. PMID: 33634081 Free PMC article.
-
Morphological and biomechanical analyses of the human healthy and glaucomatous aqueous outflow pathway: Imaging-to-modeling.Comput Methods Programs Biomed. 2023 Jun;236:107485. doi: 10.1016/j.cmpb.2023.107485. Epub 2023 Mar 16. Comput Methods Programs Biomed. 2023. PMID: 37149973 Free PMC article.
-
Aging and intraocular pressure homeostasis in mice.Aging Cell. 2024 Jul;23(7):e14160. doi: 10.1111/acel.14160. Epub 2024 Apr 2. Aging Cell. 2024. PMID: 38566432 Free PMC article.
References
Publication types
MeSH terms
Grants and funding
LinkOut - more resources
Full Text Sources
Other Literature Sources
