. 2016 Apr;19(4):596-604.
doi: 10.1038/nn.4264. Epub 2016 Mar 7.

Hypothalamic control of male aggression-seeking behavior

Affiliations

Hypothalamic control of male aggression-seeking behavior

Annegret L Falkner et al. Nat Neurosci. 2016 Apr.

Abstract

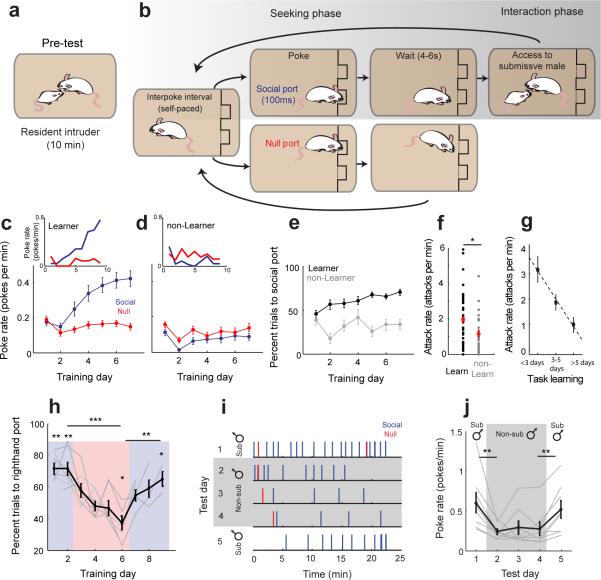
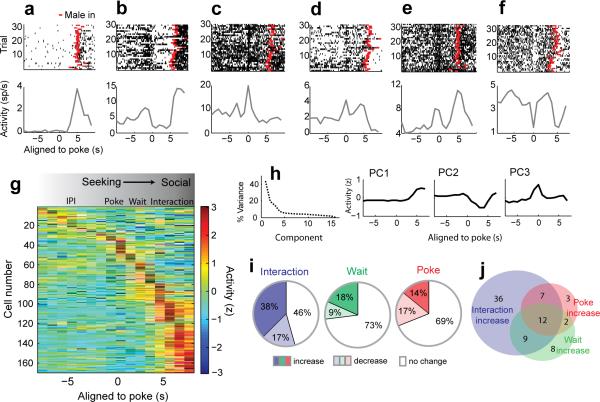
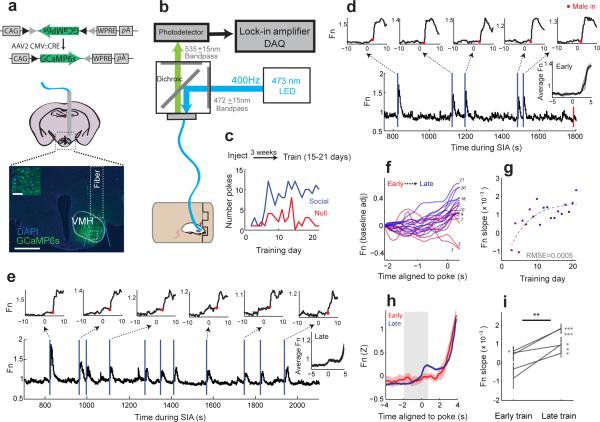
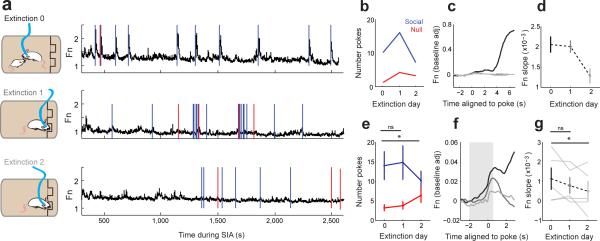
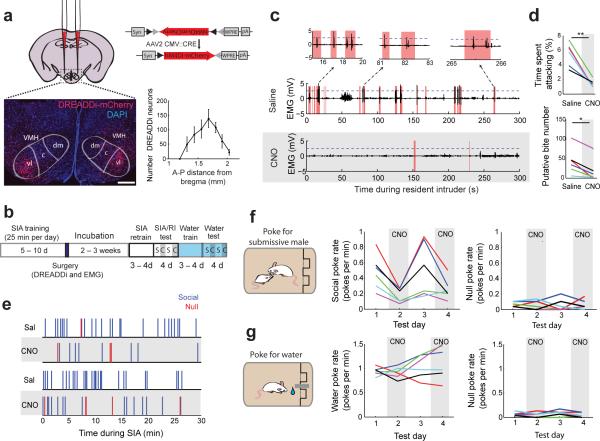
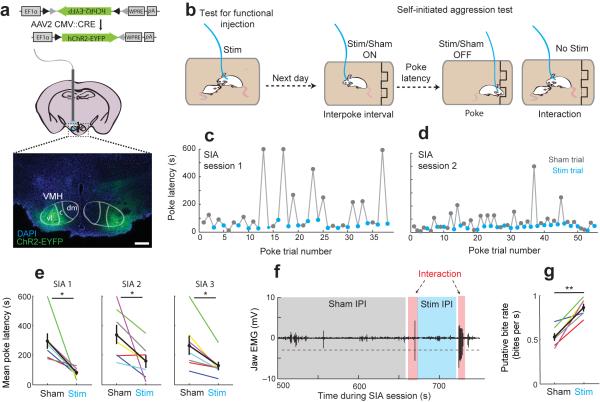
In many vertebrate species, certain individuals will seek out opportunities for aggression, even in the absence of threat-provoking cues. Although several brain areas have been implicated in the generation of attack in response to social threat, little is known about the neural mechanisms that promote self-initiated or 'voluntary' aggression-seeking when no threat is present. To explore this directly, we utilized an aggression-seeking task in which male mice self-initiated aggression trials to gain brief and repeated access to a weaker male that they could attack. In males that exhibited rapid task learning, we found that the ventrolateral part of the ventromedial hypothalamus (VMHvl), an area with a known role in attack, was essential for aggression-seeking. Using both single-unit electrophysiology and population optical recording, we found that VMHvl neurons became active during aggression-seeking and that their activity tracked changes in task learning and extinction. Inactivation of the VMHvl reduced aggression-seeking behavior, whereas optogenetic stimulation of the VMHvl accelerated moment-to-moment aggression-seeking and intensified future attack. These data demonstrate that the VMHvl can mediate both acute attack and flexible seeking actions that precede attack.


Figures

Figure 1
Figure 1
Male mice will seek opportunities to attack in the absence of threat-provoking cues. (a-b) Mice were screened for aggression using the resident-intruder paradigm (a) and then trained on the self-initiated aggression task (b) which separates the aggression seeking phase from the social interaction. (c-d) Average learning curves for all “learners” (c, N = 43/76 mice) show increased response rates for the social port (blue) across training while “non-learners” (d, N = 33/76 mice) show no increase relative to the null port (red). Insets show behavior of example learner and non-learner individuals. (e) Percent trials to social port increases for learners (black) relative to non-learners (gray) across training. (f) Learner males exhibited more aggression during the resident intruder test than non-learner males (t(67) = 2.201, *p = 0.031, unpaired t-test). (g) Comparison of aggression level exhibited during resident intruder test to speed of task learning (N = 39 learners). (h) Behavioral reversal when contingency is reversed. Blue and red show testing days where righthand and lefthand ports respectively were associated with the submissive male reinforcement (Comparison of final days of reversal, t(6) = 13.3315, ***p = 1.102×10⁻⁵; t(6) = −4.447, **p = 0.004, paired t-test. Single day comparisons for Day1: t(6) = 5.900, **p = 0.001; Day 2: t(6) = 5.077, **p = 0.002; Day 6: t(6) = −3.392, *p = 0.015; Day 9: t(6) = 2.818, *p = 0.030; t-test, N = 7 mice). (i) Behavior of a representative animal (1 of 8) during the non-submissive replacement test. Each tick represents one nosepoke. (j) Response rate across animals is reduced for a non-submissive male (t(7) = 3.548, **p = 0.009, paired t-test, N = 8 mice), and response rate recovers when access to a submissive male is resumed (t(7) = −4.167, **p = 0.004,, paired t-test, N = 8). c-h,j show mean ± s.e.m.
Figure 2
Figure 2
VMHvl neurons are modulated during aggression seeking, waiting, and interaction phases. (a–f) Raster plots (top) and PETHs (bottom) of six representative neurons (6 of 169) aligned to the time of poke initiation showing peak responses during different task phases. Red ticks indicate the introduction of the submissive male for each trial. (g) Activity matrix of the total population sorted by the peak response time for each neuron (n = 169 cells in 3 mice). (h) Variance explained (left) by the principal components of population activity matrix in (g). PC1-3 (right) explain 60% of the total variance and correspond to modulation during the interaction, wait, and poke phases. (i) Percentage of neurons with activity significantly different from activity during the IPI (n = 169, within-neuron signed rank test with FDR correction, p < 0.05, poke bin: -1s to 1s around poke, wait bin: 1s to 3s after poke, interaction bin: 0 to 3s after male introduction, IPI bin: −15 to −1s prior to poke). (j) Venn diagram of overlap between subpopulations with increased activity during interaction, wait, and poke epochs.
Figure 3
Figure 3
VMHvl population activity during aggression seeking tracks task learning. (a) Viruses expressing GCaMP6 were injected prior to training. Histology shows a representative recording site with light cone and site of magnified inset box indicated. Scale bars for image and inset are 500 μm and 100 μm. (b) Setup for fiber photometry. (c) Learning curve for representative animal (1 of 5 mice) shown in (d-g). GCaMP6 signal (Fn) during early (d) and late (e) training sessions for individual shown in (a,c). Vertical lines indicate poke times for social (blue) and null (red). Insets show single trial responses aligned to nosepokes, Red dots indicate male introduction. Right insets show mean poke aligned response ± s.e.m. (f) Poke aligned activity for all sessions for the animal shown in (c-e). Shading shows transition from early (red), to late (blue) training days. Training day numbers are shown to the left of response curves. (g) Slopes of activity shown in (f) as a function of training day. Colors are as in (f). Dotted line shows best fitting curve (RMSE = root-mean square error). (h) Population activity aligned to poke from early training trials (first 4 days, red) and late training trials (last 4 days, blue). N = 5 mice. (i) Mean response slope (−2s to 0.5s around poke, grey bar shown in h) for early and late trials (**p = 0.009, paired t-test, N = 5 mice). Error bars show mean ± s.e.m within-animal trials. (For late training slope distributions in each animal: t(41) = 9.185, p = 1.67×10⁻¹¹, n = 42 trials; t(39) = 7.2428, p = 9.97×10⁻⁹, n = 40 trials; t(41) = 2.314, p = 0.026, n=42 trials; t(37) = 2.438, p = 0.020, n = 38 trials; t(77) = 2.552, p = 0.013, n = 78 trials; t-test).
Figure 4
Figure 4
VMHvl population activity decreases during extinction. (a-b) GCaMP6 activity (a) and behavior (b) shown for final day of SIA training (Extinction day 0, top) and 2 consecutive days of extinction training for representative animal (1 of 5). Blue and red ticks represent pokes to social and null ports respectively. Animal shows behavioral perseveration on Extinction day 1 followed by a reduction in response rate on Extinction day 2. (c) Mean poke-aligned response for Extinction day 0 (black) and during extinction training (Extinction days 1-2, gray). (d) Slopes of population response during seeking (grey bar in f) for Extinction days 0-2. (e) Response to social port decreased in Extinction day 2 relative to Extinction day 0 (t(4) = 2.881, *p = 0.045, paired t-test, Extinction Day 0 vs. Extinction Day 2, N = 5 mice). (f) Averaged poke-aligned responses during Extinction days 0-2 (N = 5 mice). (g) Mean poke-aligned response slope (−2s to 0.5s around poke, grey bar f) decreases for Extinction day 2 relative to Extinction day 0 (t(4) = 3.352, *p = 0.029, paired t-test, N = 5 mice). d-e,g show mean ± s.e.m.
Figure 5
Figure 5
Reversible pharmacogenetic inactivation of VMHvl reduces aggression-seeking behavior. (a) Task trained “learner” males were injected bilaterally into the VMHvl with virally expressed DREADD Gi. Expression of DREADDi-mCherry in a representative coronal section; scale bar: 250 μm. Average number of DREADDi infected neurons in the VMHvl. Plot shows mean ± s.e.m. (b) Sequence of training, surgery, and testing. Alternating white or blue and gray bars show saline and CNO injection days respectively. (c) Representative jaw EMG traces (1 of 6 mice) for the resident-intruder test after saline (top) or CNO i.p. injection (bottom). (Red: attacks; dashed line: EMG bite threshold). (d) Reduced aggression in the resident-intruder assay (top, t(5) = 5.663, **p = 0.002, paired t-test) and fewer EMG-detected putative-bites following CNO injections compared with saline injections (bottom, *p = 0.031, Wilcoxon signed rank test, N = 6 mice ). (e) Example behavior during the SIA task following saline (white) and CNO (grey) injections (1 of 6 mice). (f) Reduced rates of poking for the social port following CNO injection (correct: F3,15 = 8.51, **p = 0.0015, repeated measures ANOVA) without significantly altering the null poke rate ( F3,15 = 0.02, p = 0.997)). (g) No reduction in poking after CNO for a water reward (water response: F3,15 = 1.663, p = 0.218, null response: F3,15 = 1.815, p = 0.188; repeated measures ANOVA). N = 6 mice for (d,f-g). Each color in (d,f-g) represents one animal.
Figure 6
Figure 6
Optogenetic stimulation of VMHvl accelerates aggression seeking by reducing poke latency. (a) Schematic of ChR2-EYFP expression and a representative histological image (below) showing the expression of ChR2-EYFP at a “functional” site (left VMHvl) and a “non functional” site (right VMHvl). Scale bar: 250 μm. (b) Animals are screened for “functional” sites by testing for stimulation evoked behavior towards a castrated male. Sites that elicit stimulation-evoked attack are considered “functional”. Animals with functional sites are stimulated during the interpoke interval of the SIA task. (c-d) Stimulation (blue) decreases trial-to-trial poke initiation latency relative to sham stimulation (gray).Representative behavior from 1 of 7 sites in 6 mice. (e) Stimulation reduces mean poke latency across days of testing (N = 7 sites, t(6) = 3.337, *p = 0.016; t(6) = 2.507, *p = 0.046; t(6) = 3.438, *p = 0.014 for each of three test sessions). (f) Representative jaw EMG trace during SIA task. Dashed line shows threshold. (g) Putative-bite rate increases following stimulation trials (t(5) = −5.451, **p = 0.003, paired t-test. N = 6 sites). e,g show mean ± s.e.m.

Comment in

  • Fight club for mice.
    Gundersen BB. Gundersen BB. Nat Neurosci. 2016 Apr;19(4):532. doi: 10.1038/nn0416-532. Nat Neurosci. 2016. PMID: 27021943 No abstract available.

References

    1. Fish EW, De Bold JF, Miczek KA. Aggressive behavior as a reinforcer in mice: activation by allopregnanolone. Psychopharmacology. 2002;163:459–466. doi:DOI 10.1007/s00213-002-1211-2. - PubMed
    1. May ME, Kennedy CH. Aggression as Positive Reinforcement in Mice under Various Ratio- and Time-Based Reinforcement Schedules. J Exp Anal Behav. 2009;91:185–196. doi:DOI 10.1901/jeab.2009.91-185. - PMC - PubMed
    1. Van Hemel PE. Aggression as a reinforcer: operant behavor in the mouse-killing rat. J Exp Anal Behav. 1972;17:237–245. - PMC - PubMed
    1. Turnbough PD, Lloyd KE. Operant responding in Siamese fighting fish (Betta splendens) as a function of schedule of reinforcement and visual reinforcers. J Exp Anal Behav. 1973;20:355–362. doi:10.1901/jeab.1973.20-355. - PMC - PubMed
    1. Azrin NH, Hutchinson RR, McLaughlin R. THE OPPORTUNITY FOR AGGRESSION AS AN OPERANT REINFORCER DURING AVERSIVE STIMULATION. J Exp Anal Behav. 1965;8:171–180. - PMC - PubMed

Publication types