. 2016 Apr;48(4):427-37.
doi: 10.1038/ng.3526. Epub 2016 Mar 7.

The spotted gar genome illuminates vertebrate evolution and facilitates human-teleost comparisons

Affiliations

The spotted gar genome illuminates vertebrate evolution and facilitates human-teleost comparisons

Ingo Braasch et al. Nat Genet. 2016 Apr.

Abstract

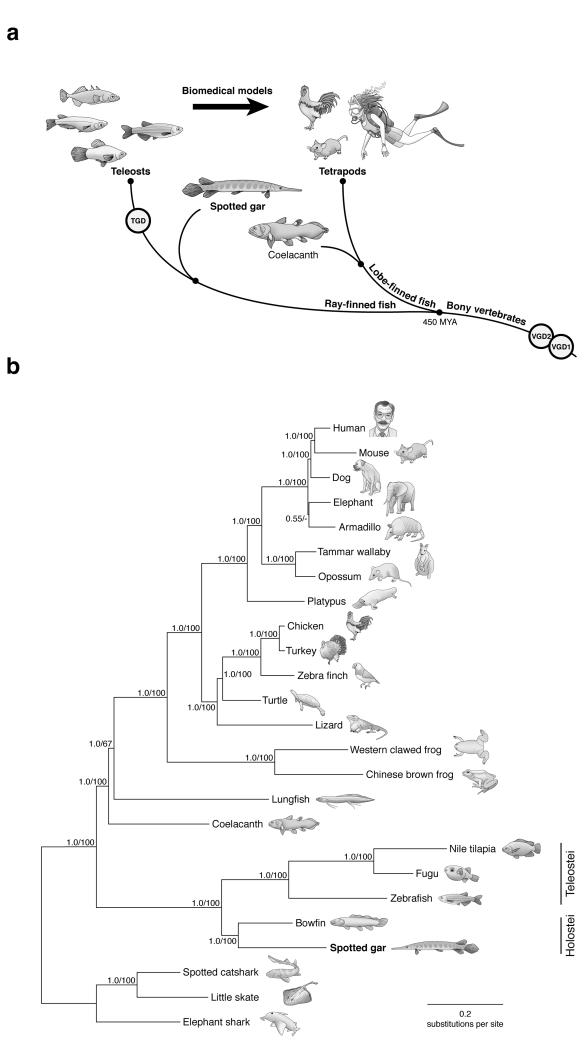
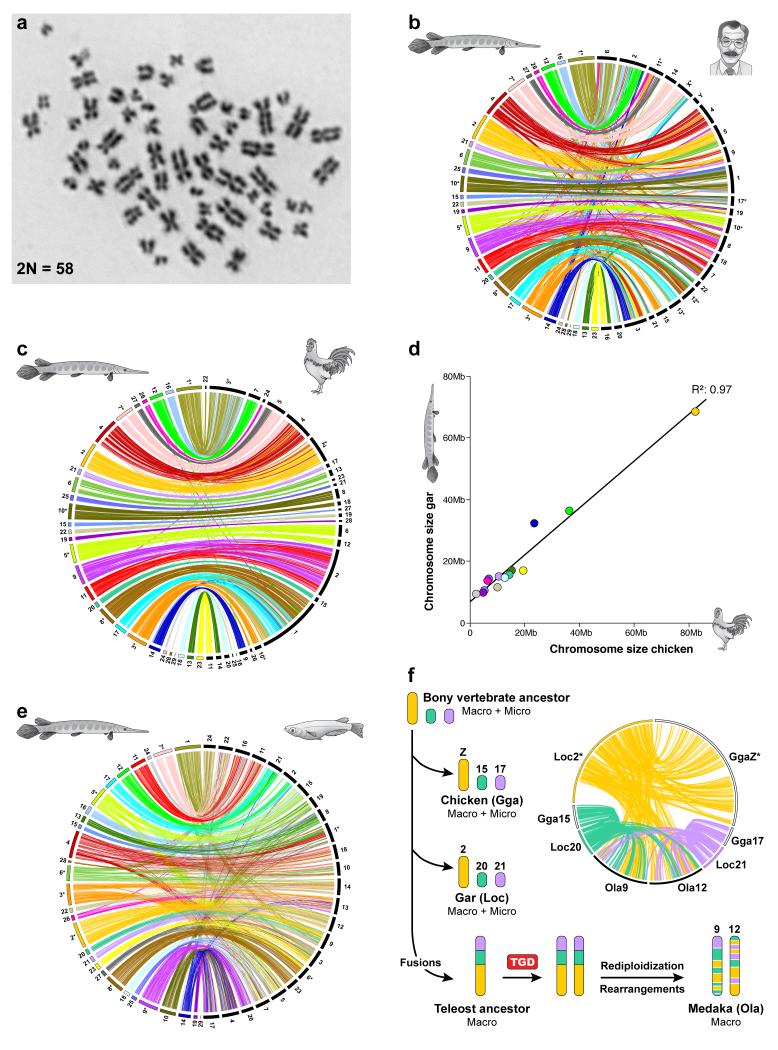
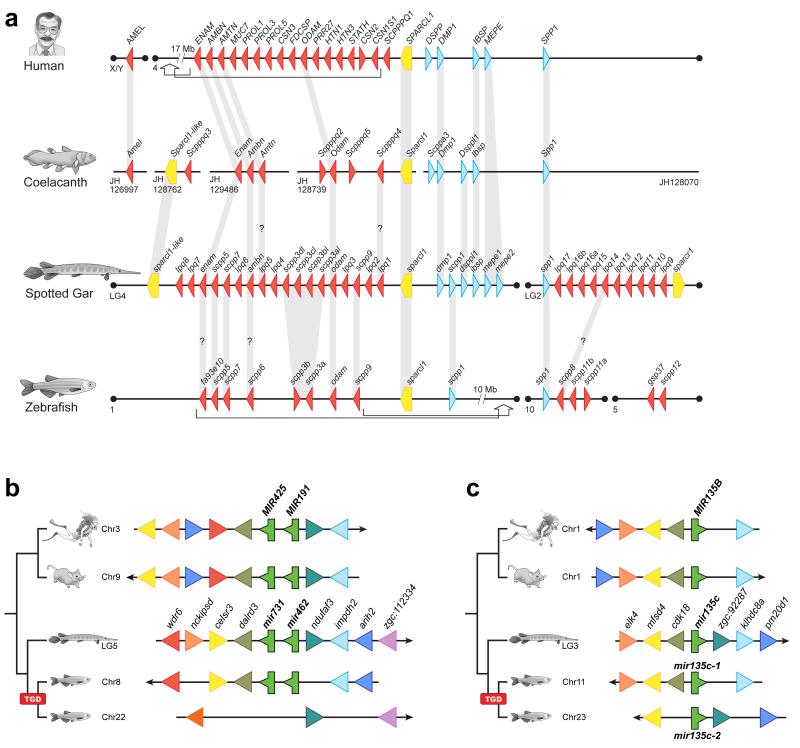
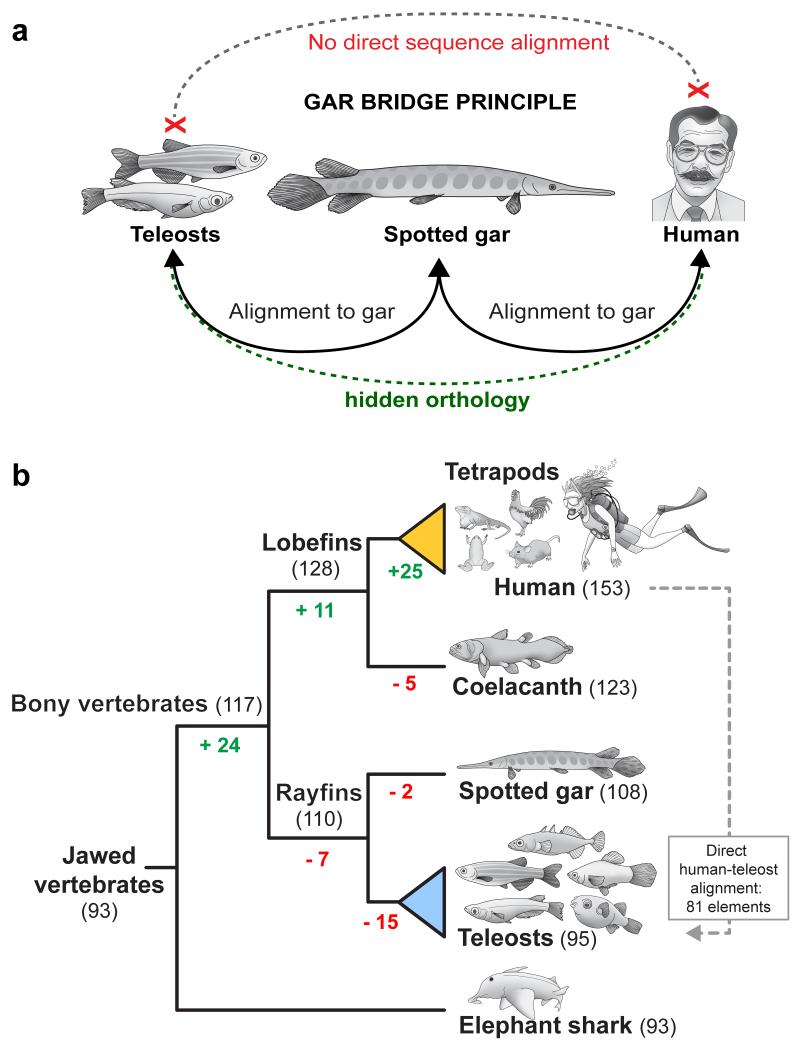
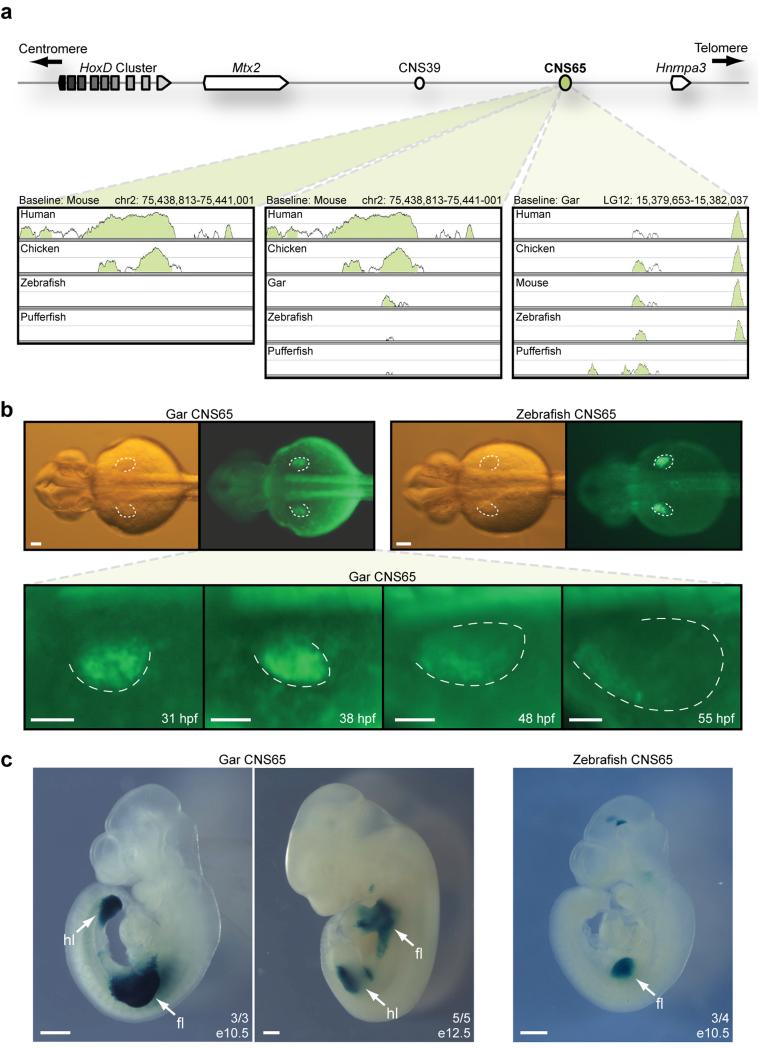
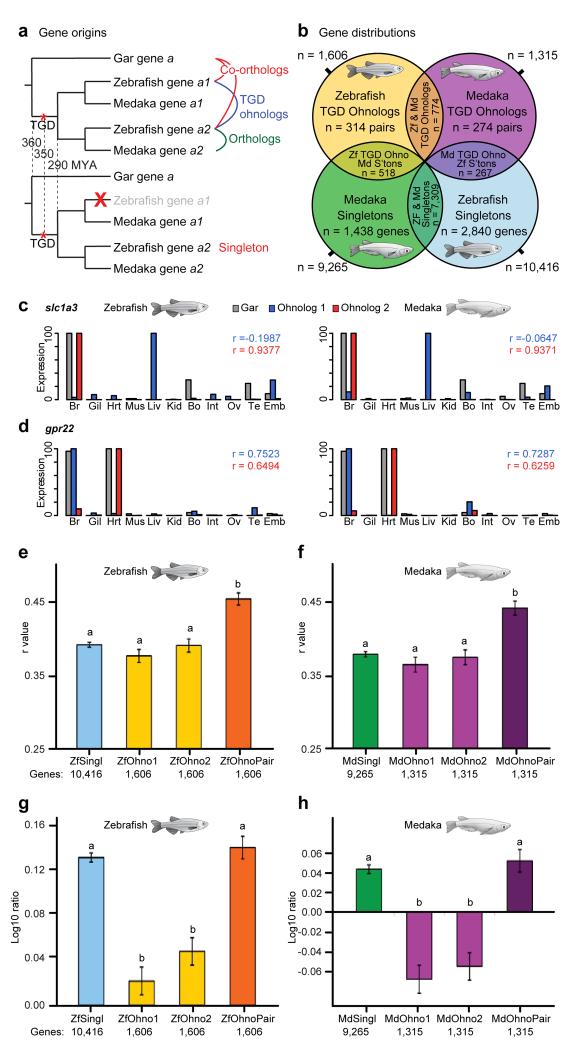
To connect human biology to fish biomedical models, we sequenced the genome of spotted gar (Lepisosteus oculatus), whose lineage diverged from teleosts before teleost genome duplication (TGD). The slowly evolving gar genome has conserved in content and size many entire chromosomes from bony vertebrate ancestors. Gar bridges teleosts to tetrapods by illuminating the evolution of immunity, mineralization and development (mediated, for example, by Hox, ParaHox and microRNA genes). Numerous conserved noncoding elements (CNEs; often cis regulatory) undetectable in direct human-teleost comparisons become apparent using gar: functional studies uncovered conserved roles for such cryptic CNEs, facilitating annotation of sequences identified in human genome-wide association studies. Transcriptomic analyses showed that the sums of expression domains and expression levels for duplicated teleost genes often approximate the patterns and levels of expression for gar genes, consistent with subfunctionalization. The gar genome provides a resource for understanding evolution after genome duplication, the origin of vertebrate genomes and the function of human regulatory sequences.


Figures

Figure 1
Figure 1. Spotted gar bridges vertebrate genomes
a) Spotted gar is a ray-finned fish that diverged from teleost fish, including the major biomedical models zebrafish, platyfish, medaka, and stickleback, before the teleost genome duplication (TGD). Gar connects teleosts to lobe-finned vertebrates, such as coelacanth and tetrapods, including human, by clarifying evolution after two earlier rounds of vertebrate genome duplication (VGD1, VGD2) that occurred before the divergence of ray-finned and lobe-finned fish 450 million years ago (MYA). b) Bayesian phylogeny inferred from an alignment of 97,794 amino acid site positions from 243 proteins with one-to-one orthology ratio from 25 jawed (gnathostome) vertebrates using PhyloBayes under the CAT+GTR+Γ4 model and rooted on cartilaginous fish. Node support is shown as posterior probability and bootstrap support from maximum likelihood analysis (Supplementary Fig. 6). The tree shows the monophyly and slow evolution of Holostei (gar plus bowfin) compared to their sister lineage, the teleosts (Teleostei). See also Supplementary File 1 and Source Dataset 1.
Figure 2
Figure 2. Spotted gar preserves ancestral genome structure
a) The spotted gar karyotype consists of macro- and microchromosomes (see Supplementary Fig. 7 for chromosome annotations). b) Circos plot showing conserved synteny of gar (colored, left) vs. human (black, right) chromosomes. c) Gar vs. chicken shows strong conservation of genomes for 450 million years and one-to-one synteny conservation for many entire chromosomes, particularly microchromosomes (e.g., Loc13 and Gga14; Loc23 and Gga11, etc.). d) Assembled chromosome lengths (in megabases, Mb) for gar and chicken chromosomes with one-to-one conserved synteny are highly correlated (R2 = 0.97). e) Gar vs. medaka shows the overall one-to-two double-conserved synteny relationship of gar to a post-TGD teleost genome (e.g., gar Loc24 and Ola16/Ola11). Gar chromosomes are displayed in a different order in d compared to b/c; asterisks indicate chromosomes inverted with respect to the arbitrarily oriented reference genomes. f) Gar-chicken-medaka comparisons illuminate karyotype evolution leading to modern teleosts. The bony vertebrate ancestor genome contained both macro- and microchromosomes, some of which remain largely conserved in chicken and gar, e.g., macrochromosome Loc2/GgaZ and microchromosomes Loc20/Gga15 and Loc21/Gga17. All three chromosomes possess double conserved synteny with medaka chromosomes Ola9 and Ola12, which is explained by chromosome fusion in the lineage leading to teleosts after divergence from gar, followed by TGD duplication of the fusion chromosome and subsequent intrachromosomal rearrangements and rediploidization. Multiple examples of such pre-TGD chromosome fusions explain the absence of microchromosomes in teleosts. See Supplementary Note 8.2 and Source Dataset 2 for details.
Figure 3
Figure 3. Gar helps connect vertebrate protein-coding and miRNA genes
a) Scpp gene arrangement in human, coelacanth, gar, and zebrafish including P/Q-rich (red) and acidic Scpp genes (blue) and Sparc-like genes (yellow) (Supplementary Note 10, ref.). Orthologies (gray vertical bars) among lobe-finned vertebrates (e.g., human, coelacanth) and teleosts (e.g., zebrafish) had previously been limited to Odam and Spp1. Gar connects lineages through orthologs of genes previously known only from either teleosts (scpp1, scpp3 genes, scpp5, scpp7, scpp9) or lobe-finned vertebrates (enam, ambn, dmp1, dsppl1, ibsp, mepe). Further putative orthologies supported by only short stretches of sequence similarity (‘?’) connect gar enam, ambn, and lpq14 with zebrafish fa93e10, scpp6, and scpp8, respectively; gar lpq1 and Scpppq4 in coelacanth; and gar lpq5 with Amtn in lobe-finned vertebrates. Arrows in human and zebrafish indicate intra-chromosomal rearrangements separating originally clustered genes into distant chromosomal locations (distance in megabases, Mb). Conserved synteny analysis of the gar scpp gene cluster on LG2 suggests that the scpp gene regions on zebrafish chromosomes 10 and 5 are derived from the TGD (Supplementary Note 10, Supplementary Fig. 26). b) The gar ‘conserved synteny bridge’ (Supplementary Note 11.2) infers that the miRNA cluster of mir731 and mir462 on gar LG4 and zebrafish chromosome 8 and a miRNA-free region on zebrafish chromosome 2 are TGD ohnologous to the mammalian Mir425-191 cluster. c) Gar newly connects through synteny zebrafish TGD ohnologs mir135c-1 and mir135c-2 with mammalian Mir135B. See Source Dataset 3 for genomic locations in a-c.
Figure 4
Figure 4. Gar provides connectivity of vertebrate regulatory elements
a) The ‘gar bridge principle’ of vertebrate CNE connectivity from human through gar to teleosts. Hidden orthology is revealed for elements that do not directly align between human and teleosts but become evident when first aligning tetrapod genomes to gar, and then aligning gar and teleost genomes. b) Connectivity analysis of 13-way whole-genome alignments reveals the evolutionary gain (green) and loss (red) of 153 human limb enhancers. Direct human-teleost orthology could only be established for 81 elements as opposed to 95 when taking gar as bridge (a). See Supplementary Notes 12.2,12.3, Supplementary Tab. 22, and Supplementary Fig. 37 for details.
Figure 5
Figure 5. Identification and functional analysis of the gar and teleost early phase HoxD enhancer CNS65
a) Schematic of the mouse HoxD telomeric gene desert, which contains enhancers CNS39 and CNS65 that drive early phase HoxD expression in limbs (upper part). Using mouse as baseline, Vista alignments of the HoxD gene desert show sequence conservation with human and chicken for CNS65, but not with teleosts (zebrafish, pufferfish) (lower part, left). An alignment including gar, however, reveals a significant peak of conservation in the gar sequence (middle). Using the identified gar CNS65 as baseline revealed CNS65 orthologs in zebrafish and pufferfish (right). b) Gar (left) and zebrafish (right) CNS65 orthologs drive robust and reproducible GFP expression in zebrafish pectoral fins at 36 hours post fertilization (hpf) (upper panel). Pectoral fin activity of gar CNS65 begins at 31 hpf, drives activity throughout the fin, and becomes deactivated around 48 hpf (lower panel). Dotted lines: distal portion of the pectoral fins. c) Gar CNS65 drives expression throughout the early mouse fore-and hindlimbs (arrows) at stage e10.5 (left). At later stages (e12.5), gar CNS65 activity is restricted to the proximal portion of the limb and absent in developing digits (middle). Zebrafish CNS65 drives reporter expression in developing mouse limbs at e10.5, but only in forelimbs (right). Number of LacZ-positive embryos showing limb signal is indicated at the bottom right; fl, forelimb, hl, hindlimb (c). Scale bars: 50 μm (b); 500 μm (c). See also Supplementary Note 12.4.
Figure 6
Figure 6. Gar illuminates gene expression evolution post-TGD
Origin (a) and distribution (b) of gar and teleost singletons or TGD ohnologs (Supplementary Note 13.1, Supplementary Tab. 23). c) Neofunctionalized ohnologs (slc1a3): novel expression in liver; d) Subfunctionalized ohnologs (gpr22): one is expressed in brain like in gar, the other in heart like in gar; r: correlation of expression profiles of each ohnolog vs. gar pattern. Supplementary Note 13.2 lists neo- and subfunctionalization criteria. e-h) Expression conservation for ohnologs or singletons in zebrafish (Zf; e, g) and medaka (Md; f, h) (Supplementary Note 13.2). e, f) Mean correlations (r values) between expression patterns of gar genes and teleost ortholog(s). Correlations of average expression levels of ohnolog-pairs to gar were greater than ohnologs alone and than singletons, showing sharing of ancestral subfunctions between the ohnolog-pair (multiple Wilcoxon Mann-Whitney tests with Bonferroni correction; alpha value 0.05 for significance). g, h) Mean Log10 ratios between expression levels of gar genes and teleost ortholog(s). Individual ohnologs compared to gar were expressed at significantly lower levels than singletons, but ohnolog-pair/gar ratios were not statistically different from singleton/gar ratios, suggesting that expression levels of ohnolog-pairs approach pre-duplication genes (multiple two-sided Student t-test with Bonferroni correction; alpha value 0.05 for significance). Error bars: standard error of the mean (s.e.m.). ‘OhnoPair’: average expression of ohnolog-pair (Supplementary Note 13.2). Br, brain; Gil, gill; Hrt, heart; Mus, muscle; Liv, liver, Kid, kidney; Bo, bone; Int, intestine; Ov, ovary; Te, testis; Emb, embryo. Source Dataset 4 contains data for Fig. 6c-h.

Comment in

  • The gar is a fish... is a bird... is a mammal?
    Parichy DM. Parichy DM. Nat Genet. 2016 Apr;48(4):344-5. doi: 10.1038/ng.3532. Nat Genet. 2016. PMID: 27023772
  • Corrigendum: The spotted gar genome illuminates vertebrate evolution and facilitates human-teleost comparisons.
    Braasch I, Gehrke AR, Smith JJ, Kawasaki K, Manousaki T, Pasquier J, Amores A, Desvignes T, Batzel P, Catchen J, Berlin AM, Campbell MS, Barrell D, Martin KJ, Mulley JF, Ravi V, Lee AP, Nakamura T, Chalopin D, Fan S, Wcisel D, Cañestro C, Sydes J, Beaudry FE, Sun Y, Hertel J, Beam MJ, Fasold M, Ishiyama M, Johnson J, Kehr S, Lara M, Letaw JH, Litman GW, Litman RT, Mikami M, Ota T, Saha NR, Williams L, Stadler PF, Wang H, Taylor JS, Fontenot Q, Ferrara A, Searle SM, Aken B, Yandell M, Schneider I, Yoder JA, Volff JN, Meyer A, Amemiya CT, Venkatesh B, Holland PW, Guiguen Y, Bobe J, Shubin NH, Di Palma F, Alfo Ldi J, Lindblad-Toh K, Postlethwait JH. Braasch I, et al. Nat Genet. 2016 May 27;48(6):700. doi: 10.1038/ng0616-700c. Nat Genet. 2016. PMID: 27230688 No abstract available.
  • Subfunctionalization versus neofunctionalization after whole-genome duplication.
    Sandve SR, Rohlfs RV, Hvidsten TR. Sandve SR, et al. Nat Genet. 2018 Jul;50(7):908-909. doi: 10.1038/s41588-018-0162-4. Nat Genet. 2018. PMID: 29955176 No abstract available.

References

    1. Nelson J S. Fishes of the world. 4th edn. John Wiley; 2006.
    1. Kettleborough RN, et al. A systematic genome-wide analysis of zebrafish protein-coding gene function. Nature. 2013;496:494–497. - PMC - PubMed
    1. Patton EE, Mathers ME, Schartl M. Generating and analyzing fish models of melanoma. Methods in cell biology. 2011;105:339–366. - PubMed
    1. Reitzel AM, et al. Genetic variation at aryl hydrocarbon receptor (AHR) loci in populations of Atlantic killifish (Fundulus heteroclitus) inhabiting polluted and reference habitats. BMC evolutionary biology. 2014;14:6. - PMC - PubMed
    1. Lee O, Green JM, Tyler CR. Transgenic fish systems and their application in ecotoxicology. Crit Rev Toxicol. 2015;45:124–141. - PubMed

Methods-only references

    1. Long WL, Ballard WW. Normal embryonic stages of the longnose gar, Lepisosteus osseus. BMC Dev Biol. 2001;1:6. - PMC - PubMed
    1. Grabherr MG, et al. Full-length transcriptome assembly from RNA-Seq data without a reference genome. Nat Biotechnol. 2011;29:644–652. - PMC - PubMed
    1. Schulz MH, Zerbino DR, Vingron M, Birney E. Oases: robust de novo RNA-seq assembly across the dynamic range of expression levels. Bioinformatics. 2012;28:1086–1092. - PMC - PubMed
    1. Wicker T, et al. A unified classification system for eukaryotic transposable elements. Nat Rev Genet. 2007;8:973–982. - PubMed
    1. Shaffer HB, et al. The western painted turtle genome, a model for the evolution of extreme physiological adaptations in a slowly evolving lineage. Genome biology. 2013;14:R28. - PMC - PubMed

Publication types