. 2016 Oct;100(4):371-9.
doi: 10.1002/cpt.367. Epub 2016 May 20.

Improved Prediction of Drug-Induced Torsades de Pointes Through Simulations of Dynamics and Machine Learning Algorithms

Affiliations

Improved Prediction of Drug-Induced Torsades de Pointes Through Simulations of Dynamics and Machine Learning Algorithms

M Cummins Lancaster et al. Clin Pharmacol Ther. 2016 Oct.

Abstract

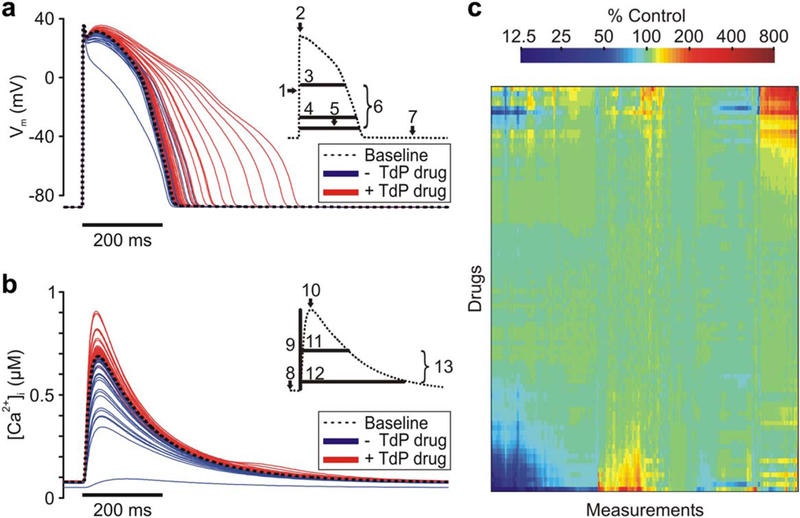
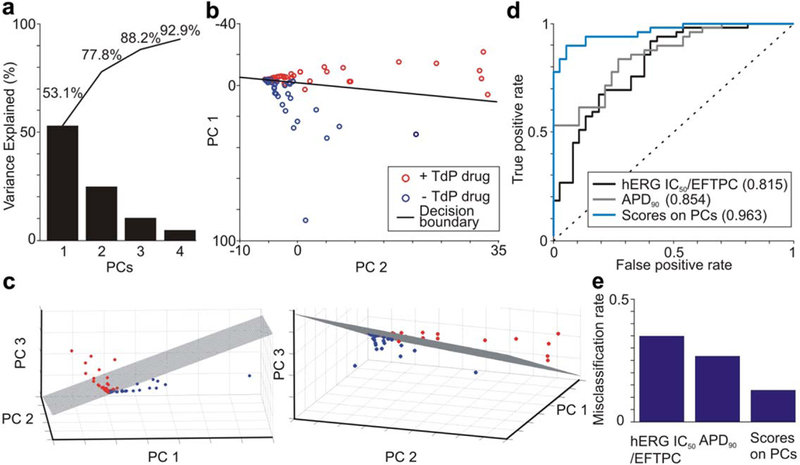
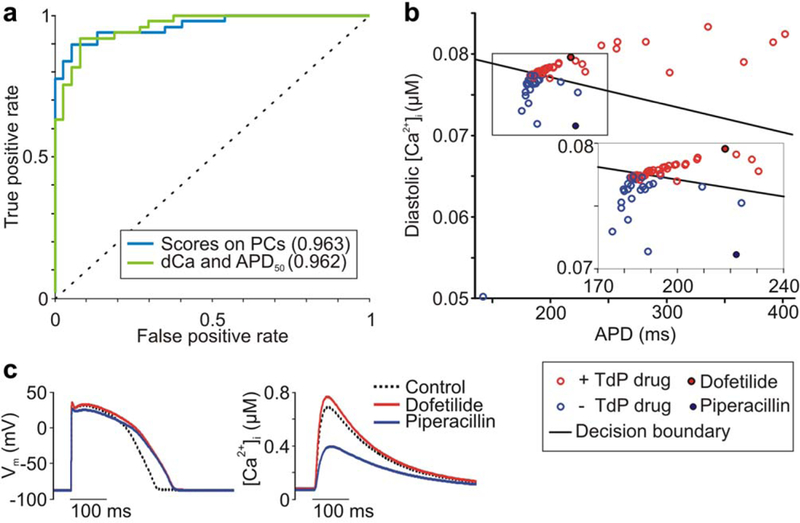
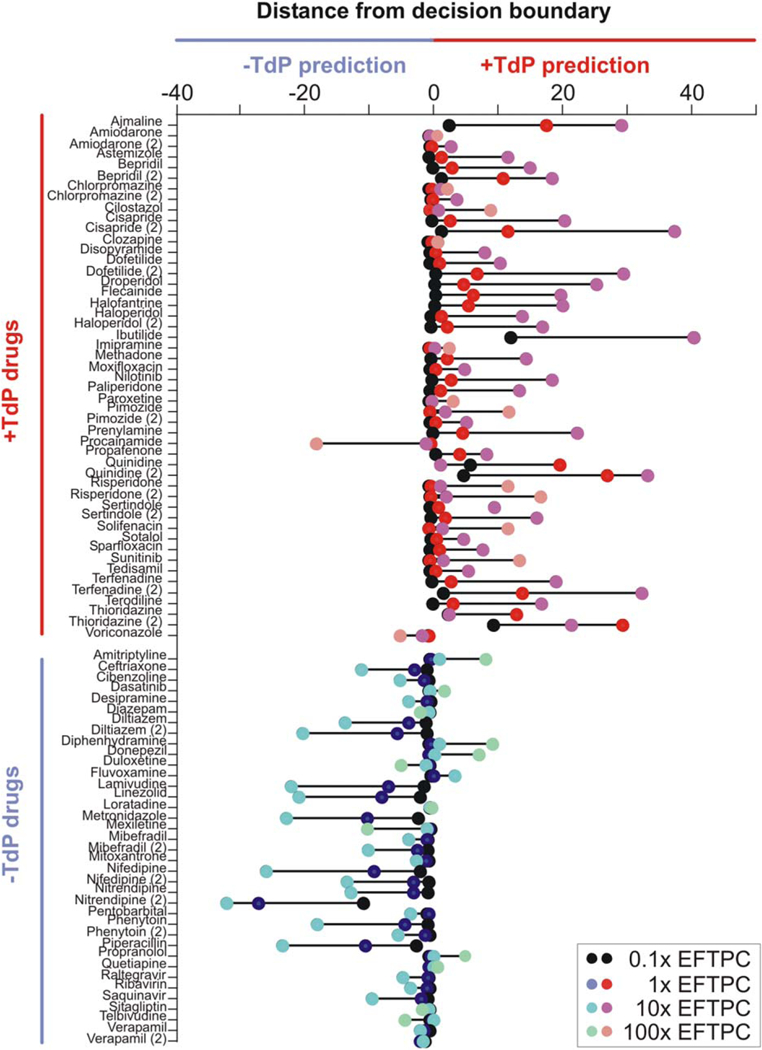
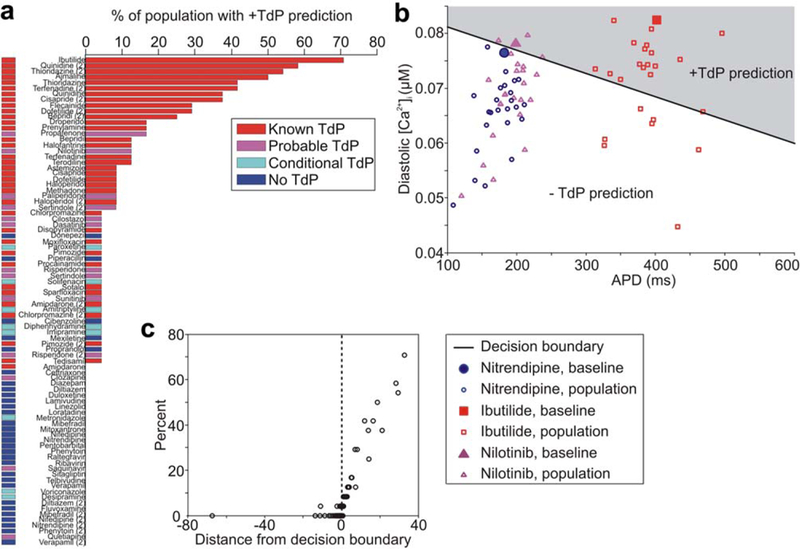
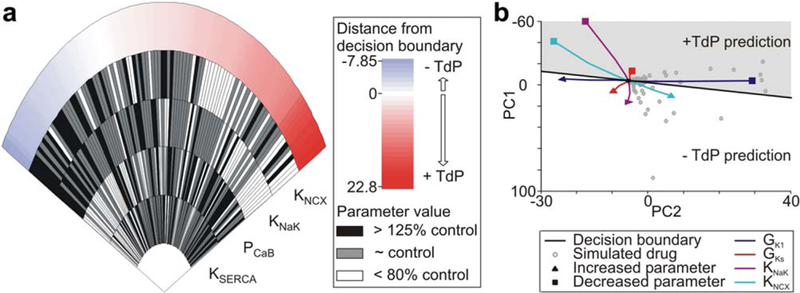
The ventricular arrhythmia Torsades de Pointes (TdP) is a common form of drug-induced cardiotoxicity, but prediction of this arrhythmia remains an unresolved issue in drug development. Current assays to evaluate arrhythmia risk are limited by poor specificity and a lack of mechanistic insight. We addressed this important unresolved issue through a novel computational approach that combined simulations of drug effects on dynamics with statistical analysis and machine-learning. Drugs that blocked multiple ion channels were simulated in ventricular myocyte models, and metrics computed from the action potential and intracellular (Ca(2+) ) waveform were used to construct classifiers that distinguished between arrhythmogenic and nonarrhythmogenic drugs. We found that: (1) these classifiers provide superior risk prediction; (2) drug-induced changes to both the action potential and intracellular (Ca(2+) ) influence risk; and (3) cardiac ion channels not typically assessed may significantly affect risk. Our algorithm demonstrates the value of systematic simulations in predicting pharmacological toxicity.


Conflict of interest statement

CONFLICT OF INTEREST

The authors declared no conflict of interest.

Figures

Figure 1
Figure 1
Drug response in human ventricular cell models. (a) Action potential (AP) traces for baseline model and under simulated exposure to each drug. Torsadogenic (+Torsades de Pointes (TdP)) drug APs are red, and nontorsadogenic (-TdP) drug APs are in blue. Inset, AP metrics: (1) upstroke velocity; (2) peak membrane voltage (Vm); (3) AP duration (APD) at 50% repolarization; (4) APD at-60 mV; (5) APD at 90% repolarization; (6) AP triangulation; and (7) resting Vm. (b) Ca2+ transient (CaT) traces for baseline model and under simulated exposure to each drug. Torsadogenic (+TdP) drug CaTs are red, and nontorsadogenic (-TdP) drug CaTs are in blue. Inset, CaT metrics: (8) resting (Ca2+)i (9) CaT amplitude, (10) Peak (Ca2+)i (11) CaT duration at 50% return to baseline, (12) CaT duration at 90% return to baseline, and (13) CaT triangulation. (c) Heatmap of 331 metrics measured under exposure to drug set. Color indicates percent change in metric from baseline value. Drugs and metrics are ordered by unsupervised hierarchical clustering. [Color figure can be viewed in the online issue, which is available at wileyonlinelibrary.com.]
Figure 2
Figure 2
Principal components (PCs) analysis with support vector machine (SVM) classification discriminates torsadogenic from nontorsadogenic drugs. (a) Variance explained by the first four PCs. Cumulative percentages are labeled. (b) Drug scores on the first two PCs. SVM decision boundary is shown as a black line, torsadogenic (+Torsades de Pointes (TdP)) drugs are shown as red circles, and nontorsadogenic (-TdP) drugs are shown as blue circles. (c) Drug scores on the first three PCs at two viewing angles. SVM decision boundary shown as hatched plane. (d) Accuracy of classification assessed using receiver operating characteristic analysis. The SVM model based on drug scores on three PCs is compared to SVM models based on hERG block (hERG IC50/effective free therapeutic plasma concentration (EFTPC)) and action potential duration at 90% repolarization (APD90). Predictive power is quantified by the area under the curve in parentheses in the legend. (e) Misclassification rate under leave-one-out cross-validation. [Color figure can be viewed in the online issue, which is available at wileyonlinelibrary.com.]
Figure 3
Figure 3
Selected action potential and Ca2+ transient metrics discriminate torsadogenic from nontorsadogenic drugs. (a) Accuracy of classification assessed using receiver operating characteristic analysis. The support vector machine (SVM) model based on diastolic Ca2+ (dCa) and action potential duration (APD) is compared to the SVM model based on drugs scores on three principal components (PCs). Predictive power is quantified by the area under the curve, listed in parentheses in the legend. (b) Diastolic Ca2+ (uM) vs. APD (ms) for drug set. SVM decision boundary is shown as a black line, torsadogenic (+Torsades de Pointes (TdP)) drugs are shown as red circles, and nontorsadogenic (-TdP) drugs are shown as blue circles. (c) Ca2+ transients (right), but not action potentials (left), distinguish dofetilide from piperacillin. [Color figure can be viewed in the online issue, which is available at wileyonlinelibrary.com.]
Figure 4
Figure 4
Dose-dependence of torsadogenicity predictions. Drug distance from decision boundary at concentrations of 0.1,1, 10, and 100 times effective free therapeutic plasma concentration (EFTPC). Positive distance results in a torsadogenic (+Torsades de Pointes (TdP)) prediction, and negative distance results in a nontorsadogenic (-TdP) prediction. Drugs are sorted on the y-axis into known torsadogenic and known nontorsadogenic compounds. [Color figure can be viewed in the online issue, which is available at wileyonlinelibrary.com.]
Figure 5
Figure 5
Drug risk prediction in a synthetic population. (a) Percent of individuals in synthetic population in whom each drug is classified as torsadogenic (+Torsades de Pointes (TdP)). Drug bars are colored by known drug risk. (b) Population distribution in risk space for ibutilide, nilotinib, and nitrendipine. APD is the action potential duration. (c) Percent of population in whom the drug is classified as torsadogenic vs. drug distance from classifier decision boundary in baseline model. Positive distance results in a torsadogenic prediction, and negative distance results in a nontorsadogenic prediction. [Color figure can be viewed in the online issue, which is available at wileyonlinelibrary.com.]
Figure 6
Figure 6
Most important drug targets in hypothetical drug set. (a) The “wheel of fortune” plot shows the four targets with the largest effect on drug risk. Each “slice” represents one drug: how it alters the activity of each of the four targets and the resulting risk. Slices are sorted from left to right by lowest (-Torsades de Pointes (TdP)) to highest (+TdP) predicted risk. Targets are ranked by statistical significance (KNCX p = 1.22E-5, KNaK p = 1.49E-5, PCaB p = 0.000755, and KSERCA p = 0.0312). KNCX is the maximal Na+-Ca2+ exchange current, KNaK scales the Na+-K+ ATPase current, PCaB is the background Ca2+ current permeability, and KSERCA scales total Ca2+ uptake via SERCA pump from myoplasm to NSR. (b) Movement in principal component (PC) risk space with single-target perturbations from 50–200% of control values. GK1 is the maximal inward rectifier K+ conductance and GKs is the maximal slow delayed rectifier K+ conductance. [Color figure can be viewed in the online issue, which is available at wileyonlinelibrary.com.]

Comment in

References

    1. Mitcheson JS, Chen J, Lin M, Culberson C & Sanguinetti MC A structural basis for drug-induced long QT syndrome. Proc. Natl. Acad. Sci. USA 97, 12329–12333 (2000). - PMC - PubMed
    1. Sanguinetti MC, Jiang C, Curran ME & Keating MT A mechanistic link between an inherited and an acquired cardiac arrhythmia: HERG encodes the IKr potassium channel. Cell 81, 299–307 (1995). - PubMed
    1. Food and Drug Administration, HHS. International Conference on Harmonisation; guidance on S7B nonclinical evaluation of the potential for delayed ventricular repolarization (QT interval prolongation) by human pharmaceuticals; availability. Notice. Fed. Regist. 70, 61133–61134 (2005). - PubMed
    1. Gintant G An evaluation of hERG current assay performance: translating preclinical safety studies to clinical QT prolongation. Pharmacol. Ther. 129, 109–119 (2011). - PubMed
    1. Redfern WS et al. Relationships between preclinical cardiac electrophysiology, clinical QT interval prolongation and torsade de pointes for a broad range of drugs: evidence for a provisional safety margin in drug development. Cardiovasc. Res. 58, 32–45 (2003). - PubMed

Publication types