Ion Concentration- and Voltage-Dependent Push and Pull Mechanisms of Potassium Channel Ion Conduction
- PMID: 26950215
- PMCID: PMC4780791
- DOI: 10.1371/journal.pone.0150716
Ion Concentration- and Voltage-Dependent Push and Pull Mechanisms of Potassium Channel Ion Conduction
Abstract
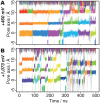
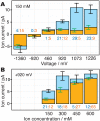
The mechanism of ion conduction by potassium channels is one of the central issues in physiology. In particular, it is still unclear how the ion concentration and the membrane voltage drive ion conduction. We have investigated the dynamics of the ion conduction processes in the Kv1.2 pore domain, by molecular dynamics (MD) simulations with several different voltages and ion concentrations. By focusing on the detailed ion movements through the pore including selectivity filter (SF) and cavity, we found two major conduction mechanisms, called the III-IV-III and III-II-III mechanisms, and the balance between the ion concentration and the voltage determines the mechanism preference. In the III-IV-III mechanism, the outermost ion in the pore is pushed out by a new ion coming from the intracellular fluid, and four-ion states were transiently observed. In the III-II-III mechanism, the outermost ion is pulled out first, without pushing by incoming ions. Increases in the ion concentration and voltage accelerated ion conductions, but their mechanisms were different. The increase in the ion concentrations facilitated the III-IV-III conductions, while the higher voltages increased the III-II-III conductions, indicating that the pore domain of potassium channels permeates ions by using two different driving forces: a push by intracellular ions and a pull by voltage.
Conflict of interest statement
Figures


Similar articles
-
Ion concentration-dependent ion conduction mechanism of a voltage-sensitive potassium channel.PLoS One. 2013;8(2):e56342. doi: 10.1371/journal.pone.0056342. Epub 2013 Feb 13. PLoS One. 2013. PMID: 23418558 Free PMC article.
-
Principles of conduction and hydrophobic gating in K+ channels.Proc Natl Acad Sci U S A. 2010 Mar 30;107(13):5833-8. doi: 10.1073/pnas.0911691107. Epub 2010 Mar 15. Proc Natl Acad Sci U S A. 2010. PMID: 20231479 Free PMC article.
-
Mechanism of voltage gating in potassium channels.Science. 2012 Apr 13;336(6078):229-33. doi: 10.1126/science.1216533. Science. 2012. PMID: 22499946
-
Omega currents in voltage-gated ion channels: what can we learn from uncovering the voltage-sensing mechanism using MD simulations?Acc Chem Res. 2013 Dec 17;46(12):2755-62. doi: 10.1021/ar300290u. Epub 2013 May 22. Acc Chem Res. 2013. PMID: 23697886 Review.
-
Dissecting the coupling between the voltage sensor and pore domains.Neuron. 2006 Nov 22;52(4):568-9. doi: 10.1016/j.neuron.2006.11.002. Neuron. 2006. PMID: 17114039 Review.
Cited by
-
IBiSA_Tools: A Computational Toolkit for Ion-Binding State Analysis in Molecular Dynamics Trajectories of Ion Channels.PLoS One. 2016 Dec 1;11(12):e0167524. doi: 10.1371/journal.pone.0167524. eCollection 2016. PLoS One. 2016. PMID: 27907142 Free PMC article.
-
Multiscale Responsive Kinetic Modeling: Quantifying Biomolecular Reaction Flux under Varying Electrochemical Conditions.bioRxiv [Preprint]. 2024 Aug 2:2024.08.01.606205. doi: 10.1101/2024.08.01.606205. bioRxiv. 2024. Update in: J Chem Theory Comput. 2025 Jan 14;21(1):374-389. doi: 10.1021/acs.jctc.4c00872. PMID: 39131358 Free PMC article. Updated. Preprint.
-
Conduction through a narrow inward-rectifier K+ channel pore.J Gen Physiol. 2019 Oct 7;151(10):1231-1246. doi: 10.1085/jgp.201912359. Epub 2019 Sep 11. J Gen Physiol. 2019. PMID: 31511304 Free PMC article.
References
-
- Capener CE, Kim HJ, Arinaminpathy Y, Sansom MSP. Ion channels: structural bioinformatics and modelling. Hum Mol Genet. 2002;11: 2425–2433. - PubMed
-
- Vandenberg JI, Perry MD, Perrin MJ, Mann SA, Ke Y, Hill AP. hERG K+ channels: structure, function, and clinical significance. Physiol Rev. 2012;92: 1393–1478. - PubMed
Publication types
MeSH terms
Substances
LinkOut - more resources
Full Text Sources
Other Literature Sources

