. 2016 May;79(5):806-825.
doi: 10.1002/ana.24631.

Epileptic encephalopathy de novo GABRB mutations impair γ-aminobutyric acid type A receptor function

Affiliations

Epileptic encephalopathy de novo GABRB mutations impair γ-aminobutyric acid type A receptor function

Vaishali S Janve et al. Ann Neurol. 2016 May.

Abstract

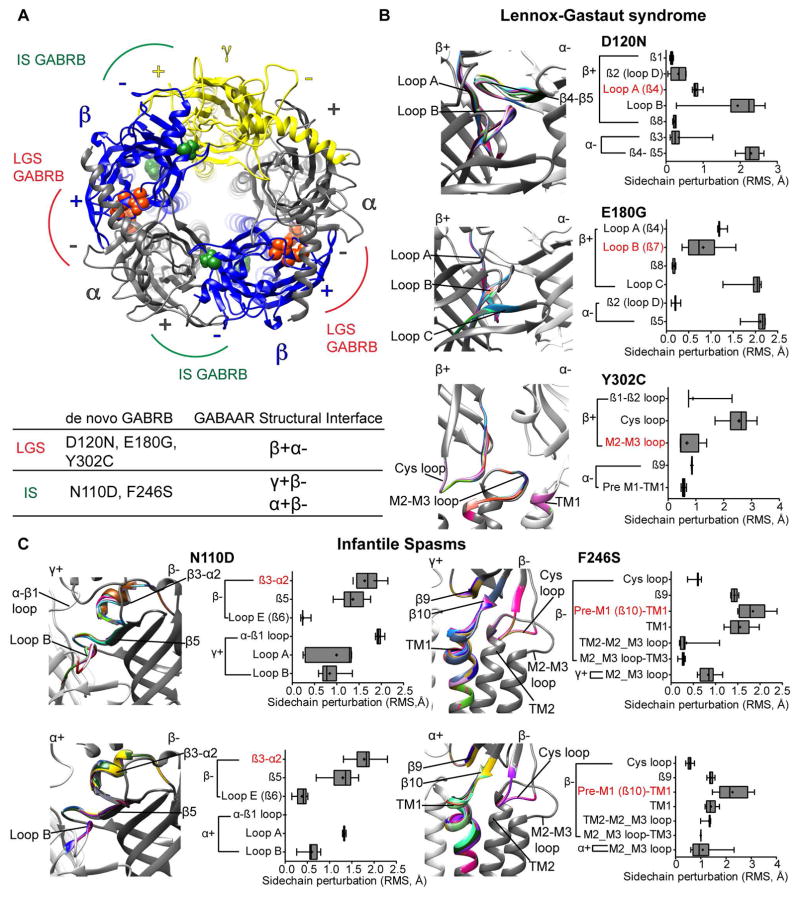
Objective: The Epi4K Consortium recently identified 4 de novo mutations in the γ-aminobutyric acid type A (GABAA ) receptor β3 subunit gene GABRB3 and 1 in the β1 subunit gene GABRB1 in children with one of the epileptic encephalopathies (EEs) Lennox-Gastaut syndrome (LGS) and infantile spasms (IS). Because the etiology of EEs is often unknown, we determined the impact of GABRB mutations on GABAA receptor function and biogenesis.

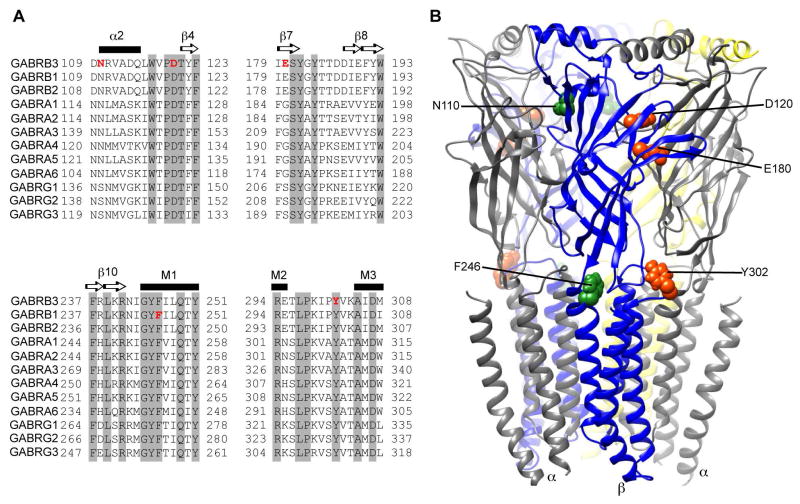
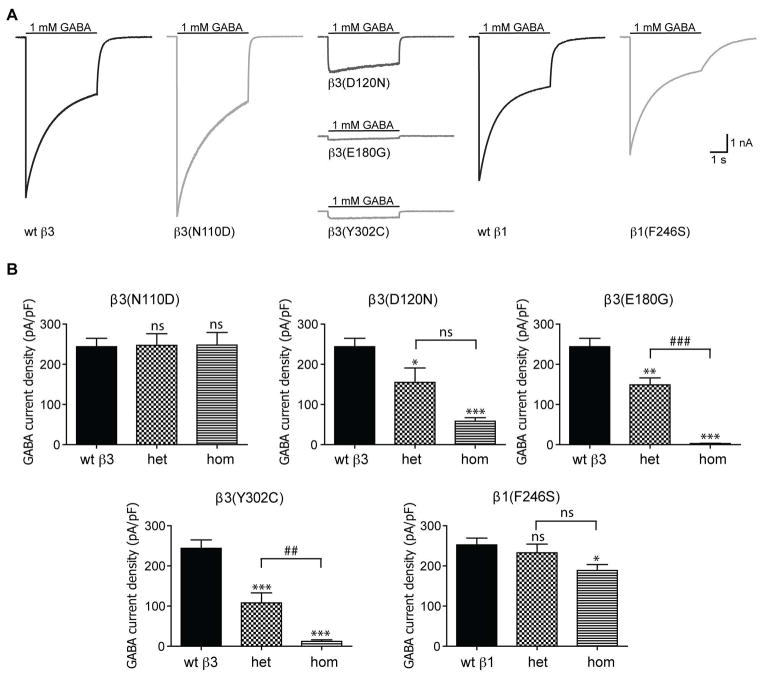
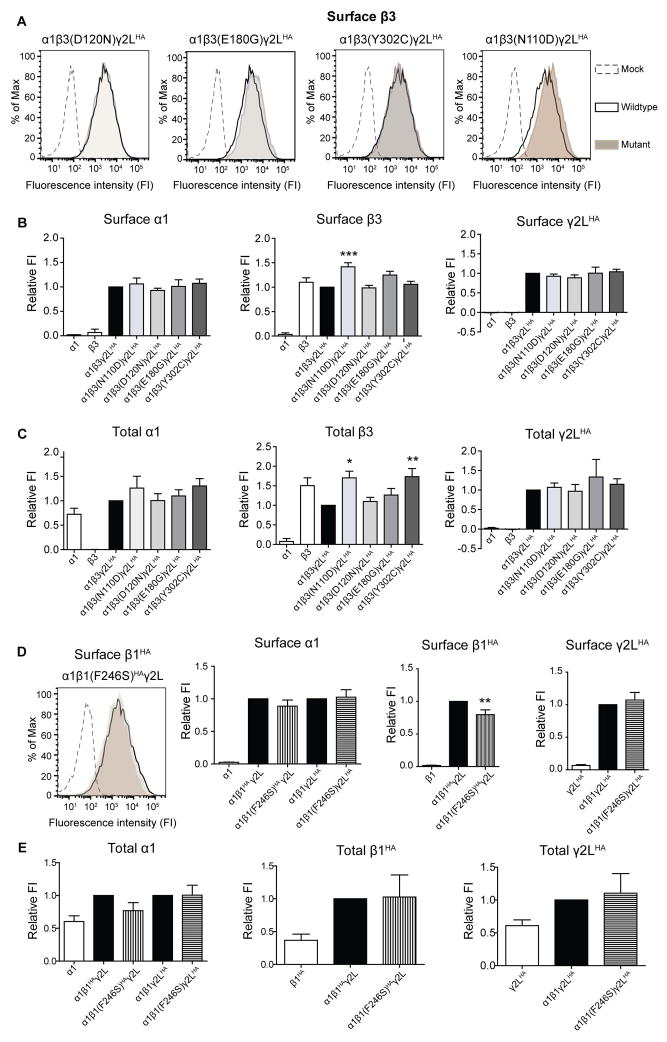
Methods: GABAA receptor α1 and γ2L subunits were coexpressed with wild-type and/or mutant β3 or β1 subunits in HEK 293T cells. Currents were measured using whole cell and single channel patch clamp techniques. Surface and total expression levels were measured using flow cytometry. Potential structural perturbations in mutant GABAA receptors were explored using structural modeling.

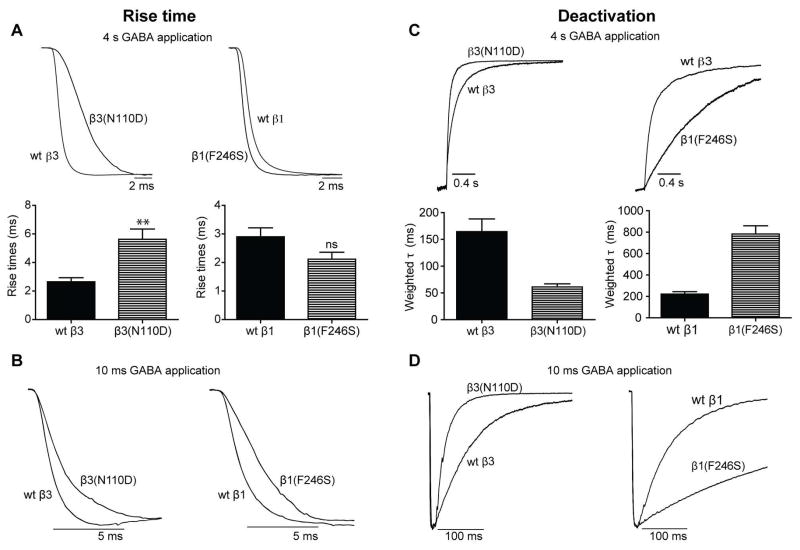
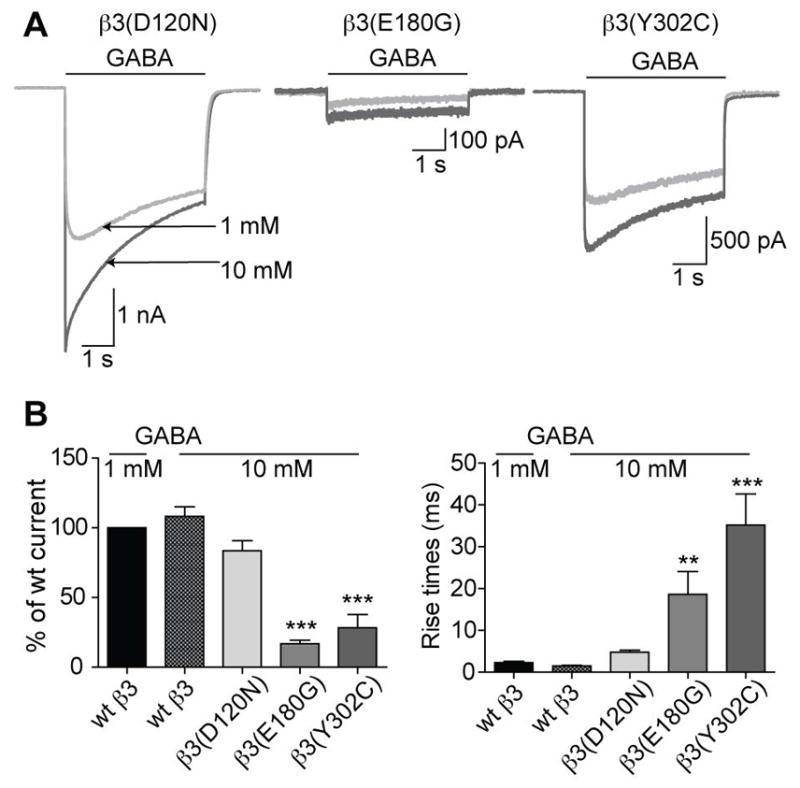
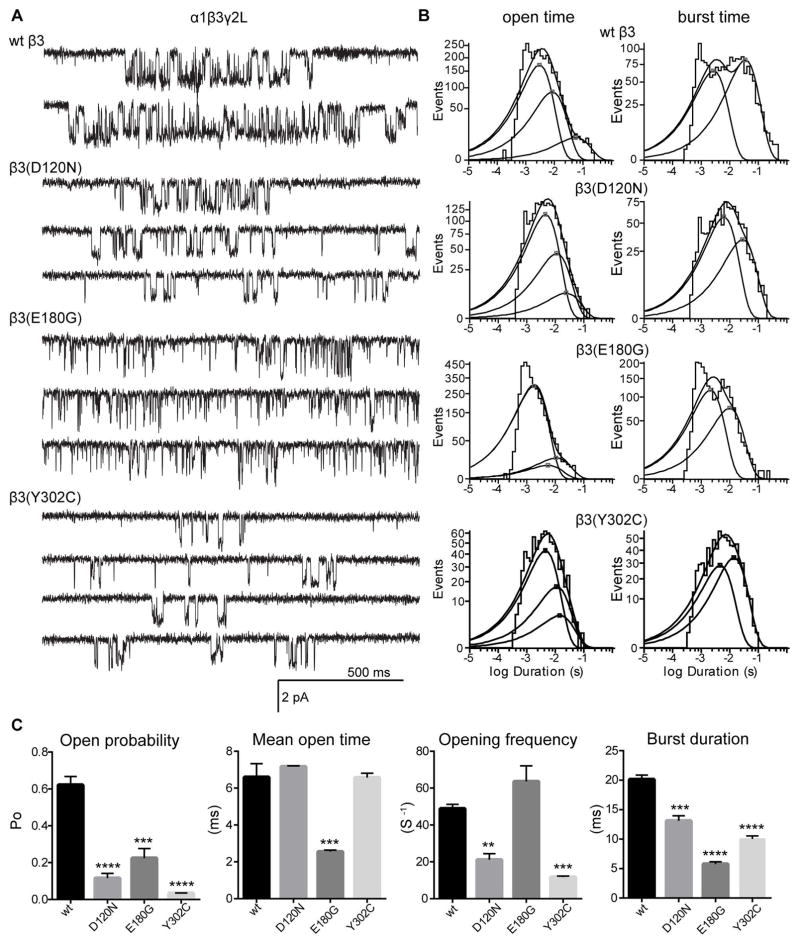
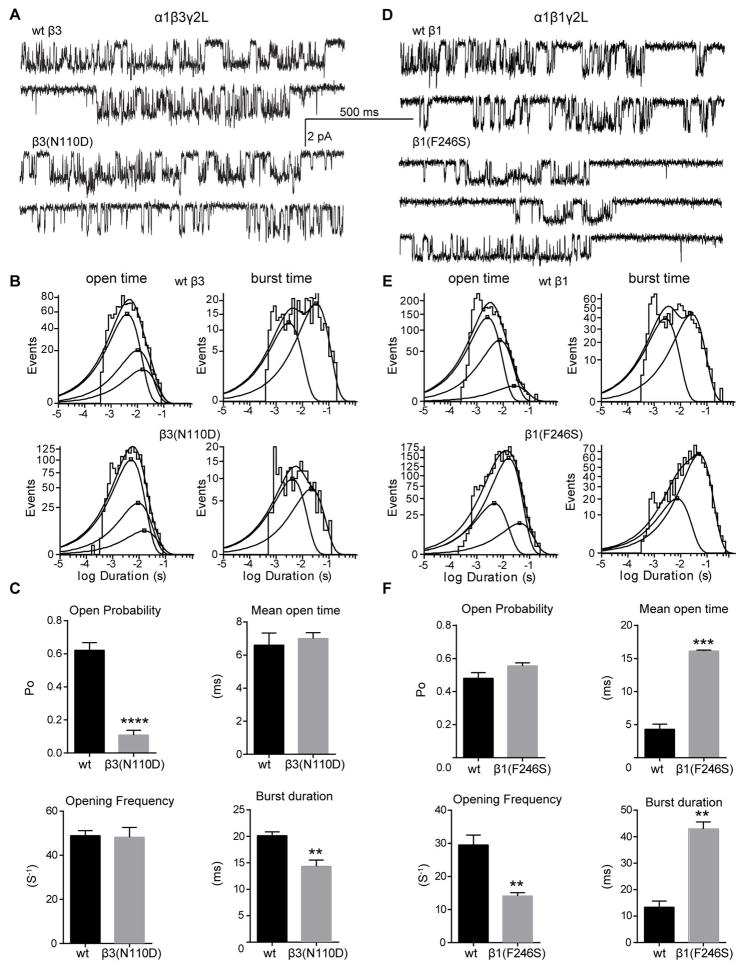
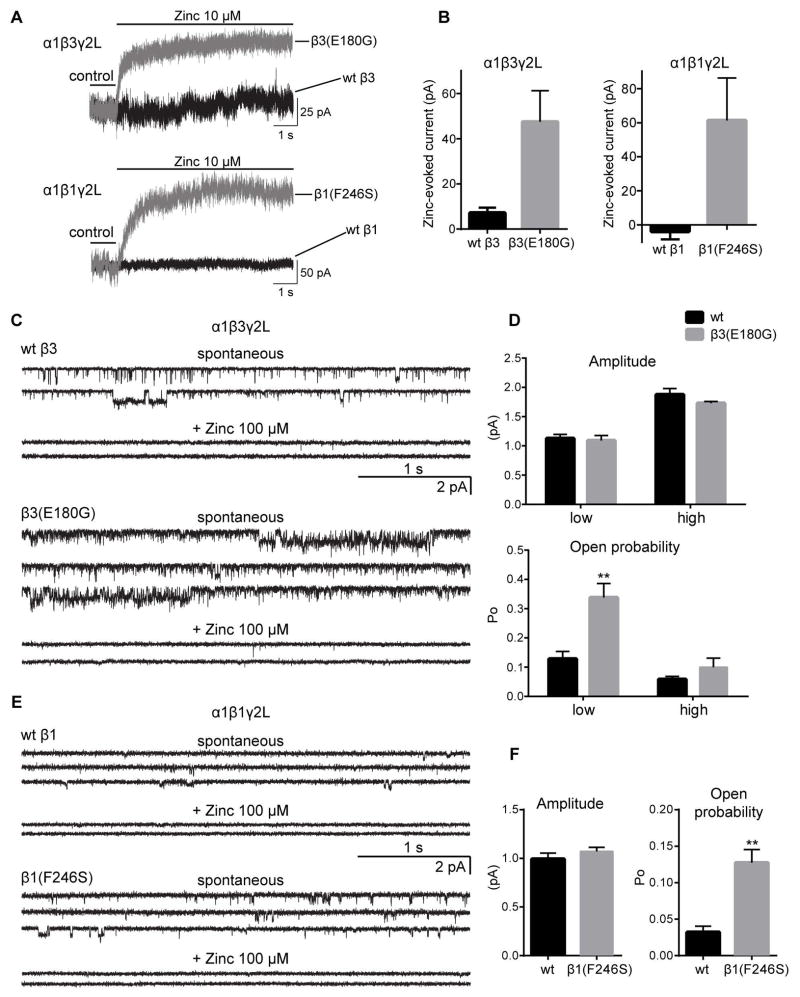
Results: LGS-associated GABRB3(D120N, E180G, Y302C) mutations located at β+ subunit interfaces reduced whole cell currents by decreasing single channel open probability without loss of surface receptors. In contrast, IS-associated GABRB3(N110D) and GABRB1(F246S) mutations at β- subunit interfaces produced minor changes in whole cell current peak amplitude but altered current deactivation by decreasing or increasing single channel burst duration, respectively. GABRB3(E180G) and GABRB1(F246S) mutations also produced spontaneous channel openings.

Interpretation: All 5 de novo GABRB mutations impaired GABAA receptor function by rearranging conserved structural domains, supporting their role in EEs. The primary effect of LGS-associated mutations was reduced GABA-evoked peak current amplitudes, whereas the major impact of IS-associated mutations was on current kinetic properties. Despite lack of association with epilepsy syndromes, our results suggest GABRB1 as a candidate human epilepsy gene. Ann Neurol 2016;79:806-825.


Conflict of interest statement

Potential Conflicts of Interest: Authors have no conflict of interest to report.

Figures

Figure 1
Figure 1. Location of the de novo GABAA receptor β3 and β1 subunit mutations found in LGS and IS patients
(A) Sequence alignments of human β1-3, α1-6 and γ1-3 GABAA receptor subunits show the conserved residues altered by the de novo mutations (shown in red). The residues highlighted in grey are conserved across all of the subunits. Secondary structures are represented above the alignments as α-helices (black bar) or β-sheets (arrows). (B) 3D structural model of the GABAA receptor with the β subunits in blue, α subunits in gray and γ subunit in yellow. GABRB de novo mutations are mapped onto the structure and represented respectively in orange and green for LGS- and IS-associated mutations.
Figure 2
Figure 2. The de novo GABAA receptor β subunit mutations found in LGS patients produced substantial reduction of GABA-evoked currents
(A) Representative GABA current traces obtained following rapid application of 1 mM GABA for 4s to lifted HEK293T cells voltage clamped at −20mV. The current traces from GABAA receptors containing mutant β3 and β1 subunits in hom conditions are compared to their respective wt current traces. (B) Bar graphs showing average peak current densities from cells expressing mutant β subunits in hom and het conditions. Values are expressed as mean ± SEM (See Table 1 for details). One-way ANOVA with Dunnett’s post-test was used to determine significance. * and # represents significant difference compared to the wt and het condition, respectively. */ = p < 0.05, **/## = p < 0.001, ***/### = p <0.0001.
Figure 3
Figure 3. The de novo GABAA receptor β subunit mutations found in IS patients altered GABAA receptor current kinetic properties
Representative traces showing rise times of GABA-evoked currents produced by 4 s (A, top panel) or 10 ms (B) applications of 1 mM GABA to wt receptors or receptors containing β3(N110D) or β1(F246S) subunits expressed in the hom condition. Bar graphs in the bottom panels of (A) show average rise times from the cells expressing wt GABAA receptors or receptors containing β3(N110D) or β1(F246S) subunits expressed in the hom condition. Representative current traces showing deactivation or current relaxation at the end of 4 s (C) or 10 ms (D) GABA application (1 mM) to wt receptors or receptors containing the β3(N110D) or β1(F246S) subunits. Bar graphs in the bottom panel of (C) show average current deactivation time constants from the cells expressing GABAA receptors containing β3(N110D) or β1(F246S) subunits expressed in the hom condition. All traces were normalized for clarity. Values are expressed as mean ± SEM (See Table 1 for details). One-way ANOVA with Dunnett’s post-test was used to determine significance. * and # represents significant difference compared to the wt and het condition, respectively. */# = p < 0.05, **/## = p < 0.001, ***/### = p < 0.0001.
Figure 4
Figure 4. The β subunit mutations did not reduce surface and total levels of GABAA receptor subunits
Flow cytometry was used to determine surface (A, B, D) and total (C, E) levels of α1, β1HA/ β3 and γ2LHA subunits in HEK293T cells. (A, D left most panel) Representative fluorescence intensity (FI) histograms showing the surface β3/β1HA subunit levels from cells expressing α1mutant β3/β1HAγ2L subunits (shaded), α1wt β3/β1HAγ2L subunits (unfilled with solid black line) and empty vector (unfilled with black line). The bar graphs represent FI of the Alexa 674 fluorophore for each condition normalized to the intensity of the wt condition (Relative FI). Surface (B,D) and total (C,E) relative FI levels of α1, β3/β1HA and γ2LHA subunits in cells expressing only α1, β3/β1HA or γ2LHA subunits (used as antibody controls), as well as co-expressing α1, γ2LHA, wt or mutant β3/β1HA subunits (hom condition). In the hom condition the IS-associated β3(N110D) and LGS-associated β3(E180G) subunit mutant subunits had 42 % and 25 % higher surface levels, respectively, than β3 subunits in the wt condition. Values are expressed as mean ± SEM. One-way ANOVA with Dunnett’s post-test was used to determine significance. * represents significant difference compared to the wt condition, * = p<0.05, ** = p<0.001, *** = p<0.0001. (A) and (D) share same legends.
Figure 5
Figure 5. GABAA receptors containing mutant βsubunits identified in LGS patients reduced GABA potency or efficacy
(A) Representative whole cell current responses following GABA application from cells expressing wt or mutant receptors (hom condition). The current traces with 1 mM GABA application (light grey) were overlaid with current traces with 10 mM GABA application (dark grey). (B, left) Bar graphs show average peak current responses to 10 mM GABA application as % of wt response to 1 mM GABA. 10 mM GABA-evoked currents from β3(D120N), β3(E180G), and β3(Y302C) subunit-containing receptors were 83.6 ± 7.3%, 16.9 ± 2.5%, and 28.3 ± 9.6% of the wt current, respectively, with 1 mM GABA. (B, right) Bar graphs show the average rise times of GABA-evoked currents to 1 and 10 mM GABA application from cells with wt or hom expression. Rise times for β3(D120N), β3(E180G), and (β3(Y302C) subunit-containing receptors were 4.8 ± 0.5 ms, 18.6 ± 5.5 ms, and 35.2 ± 7.4 ms, respectively. Values were expressed as mean ± SEM. One-way ANOVA with Dunnett’s post-test was used to determine significance. * represents significant difference compared to the wt condition with 1 mM GABA application, * = p < 0.05, ** = p < 0.001, *** = p < 0.0001.
Figure 6
Figure 6. Single channel properties of GABAA receptors with LGS-associated β subunit de novo mutations
(A) Representative single-channel current traces from cell attached patches expressing wt or mutant GABAA receptors (hom condition). (B) Mean open time (left panels) and burst duration (right panels) histograms for wt and mutant receptors were fitted to three and two exponential functions, respectively. The open and burst duration histograms are sums of multiple exponential functions. Average time for each exponential function is marked with a square. (C) Bar graphs summarize the effects of wt and LGS-associated β3 subunit mutations on the kinetic properties of the receptor. Values represent mean ± S.E.M. Statistical differences were determined using One-way ANOVA with Dunnett’s multiple comparisons test (see Table 2 for details). **, *** and **** indicate p < 0.01, p<0.001 and p < 0.0001, respectively.
Figure 7
Figure 7. Single channel properties of GABAA receptors with β subunit de novo mutations from IS patients
(A, D) Representative single-channel current traces from cell attached patches expressing wt and mutant GABAA receptors (hom condition). (B, E) Open time (right panels) and burst duration (left panels) histograms for wt and mutant receptors were fitted to three and two exponential functions, respectively. (C, F) Bar graphs summarize the effects of wt and β1(F246S) mutation on the kinetic properties of the receptor. Values represent mean ± S.E.M. Statistical differences were determined using unpaired t-test (see Table 3 for details). **, *** and **** indicate p < 0.01, p<0.001 and p < 0.0001, respectively.
Figure 8
Figure 8. Both LGS-associated GABRB3(E180G) and IS-associated GABRB1(F246S) de novo mutations produced spontaneously gated GABAA receptors
(A) Representative traces from whole cell recordings showing a shift in the baseline current (seen as an outward current) with 10 μM Zn2+ application from cells expressing GABAA receptors with β3(E180G) and β1(F246S) subunits (grey traces), but minimal or absent in cells expressing wt receptors (black traces). (B) Bar graphs are presented showing average outward current responses to 10 μM Zn2+ application. Representative spontaneous single-channel current traces recorded from cells expressing wt β3 or β3(E180G) (C), or wt β1 or β1(F246S) (E) subunit-containing GABAA receptors in absence (upper panels) and presence (bottom panels) of 100 μM Zn2+. (D, F) Bar graphs show single-channel amplitude and Po of wt (black bars) and spontaneously activated mutant (gray bars) receptors. For wt β3 subunit-containing receptors the low and high conductance openings were 12.5 pS (1.1 ± 0.07 pA, n = 7) and 21 pS (1.8 ± 0.10 pA, n = 4) with Po of 0.13 ± 0.02 (n=7) and 0.06 ± 0.01 (n = 4), respectively. The β3(E180G) subunit mutation significantly increased the Po of low conductance openings (0.34 ± 0.05, 1.1 ± 0.08 pA, n = 10), without altering high conductance openings (0.10 ± 0.03, 1.7 ± 0.03 pA, n = 4, p > 0.05). The wt β1 subunit-containing receptors had conductance level 0.99 ± 0.06 pA, (n = 5) with Po of 0.03 ± 0.01 (n = 5). The β1(F246S) subunit mutation increased Po to 0.13 ± 0.02 (n = 8) but did not alter single channel conductance (1.1 ± 0.04 pA n = 8, p > 0.05). Values represent mean ± S.E.M. Two-way ANOVA with Tukey’s multiple comparisons (D) test or unpaired t-test (F) was used to determine statistical significance. ** indicate p < 0.01.
Figure 9
Figure 9. De novo GABRB mutations induced a wave of structural rearrangements in conserved structural domains important for GABAA receptor function
(A) Extracellular view of the N-terminal domain in a structural model of pentameric αβγ GABAA receptor (as seen from the synaptic cleft) displaying LGS- (in orange) and IS-associated (in green) GABRB mutations on β (blue ribbons) subunits. α and γ subunits are represented as gray and yellow ribbons, respectively. The principal (+) and complementary (−) interfaces of each subunit are shown. Bottom panel lists the location of the mutations in their respective interfaces. (B and C) Enlarged views of the domains that had structural rearrangements caused by the LGS-associated β3(D120N, E180G, Y302C) and IS-associated β3(N110D) and β1(F246S) subunit mutations. The perturbations of the secondary structures that differ among the wt (in gray) and mutant (in rainbow) structures are indicated by solid black lines (Left panels). Box plots show perturbations (as root mean square deviation (RMS)) caused by the mutations in the sidechain residues that are propagated through β-sheets, loops and TM helices (right panels). RMS values for up to 10 simulations are represented as interleaved box and whiskers plots (25–75% percentile, median, and minimum and maximum). The secondary structure containing the mutation is highlighted in red.

Comment in

  • Reply.
    Janve VS, Hernandez CC, Verdier KM, Hu N, Macdonald RL. Janve VS, et al. Ann Neurol. 2016 Aug;80(2):312-3. doi: 10.1002/ana.24701. Epub 2016 Jun 24. Ann Neurol. 2016. PMID: 27270493 No abstract available.
  • A second patient with a De Novo GABRB1 mutation and epileptic encephalopathy.
    Lien E, Våtevik AK, Østern R, Haukanes BI, Houge G. Lien E, et al. Ann Neurol. 2016 Aug;80(2):311-2. doi: 10.1002/ana.24699. Epub 2016 Jun 28. Ann Neurol. 2016. PMID: 27273810 No abstract available.

References

    1. Berg AT, Berkovic SF, Brodie MJ, et al. Revised terminology and concepts for organization of seizures and epilepsies: report of the ILAE Commission on Classification and Terminology, 2005–2009. Epilepsia. 2010 Apr;51(4):676–85. - PubMed
    1. Epi KC, Allen AS, et al. Epilepsy Phenome/Genome P. De novo mutations in epileptic encephalopathies. Nature. 2013 Sep 12;501(7466):217–21. - PMC - PubMed
    1. Althoff T, Hibbs RE, Banerjee S, Gouaux E. X-ray structures of GluCl in apo states reveal a gating mechanism of Cys-loop receptors. Nature. 2014 Aug 21;512(7514):333–7. - PMC - PubMed
    1. Miller PS, Aricescu AR. Crystal structure of a human GABA receptor. Nature. 2014 Jun 8; - PMC - PubMed
    1. Macdonald RL, Kang JQ, Gallagher MJ. Mutations in GABAA receptor subunits associated with genetic epilepsies. J Physiol. 2010 Jun 1;588(Pt 11):1861–9. - PMC - PubMed