. 2016 Apr;22(4):427-32.
doi: 10.1038/nm.4055. Epub 2016 Mar 7.

Inhibition of fatty acid oxidation as a therapy for MYC-overexpressing triple-negative breast cancer

Affiliations

Inhibition of fatty acid oxidation as a therapy for MYC-overexpressing triple-negative breast cancer

Roman Camarda et al. Nat Med. 2016 Apr.

Abstract

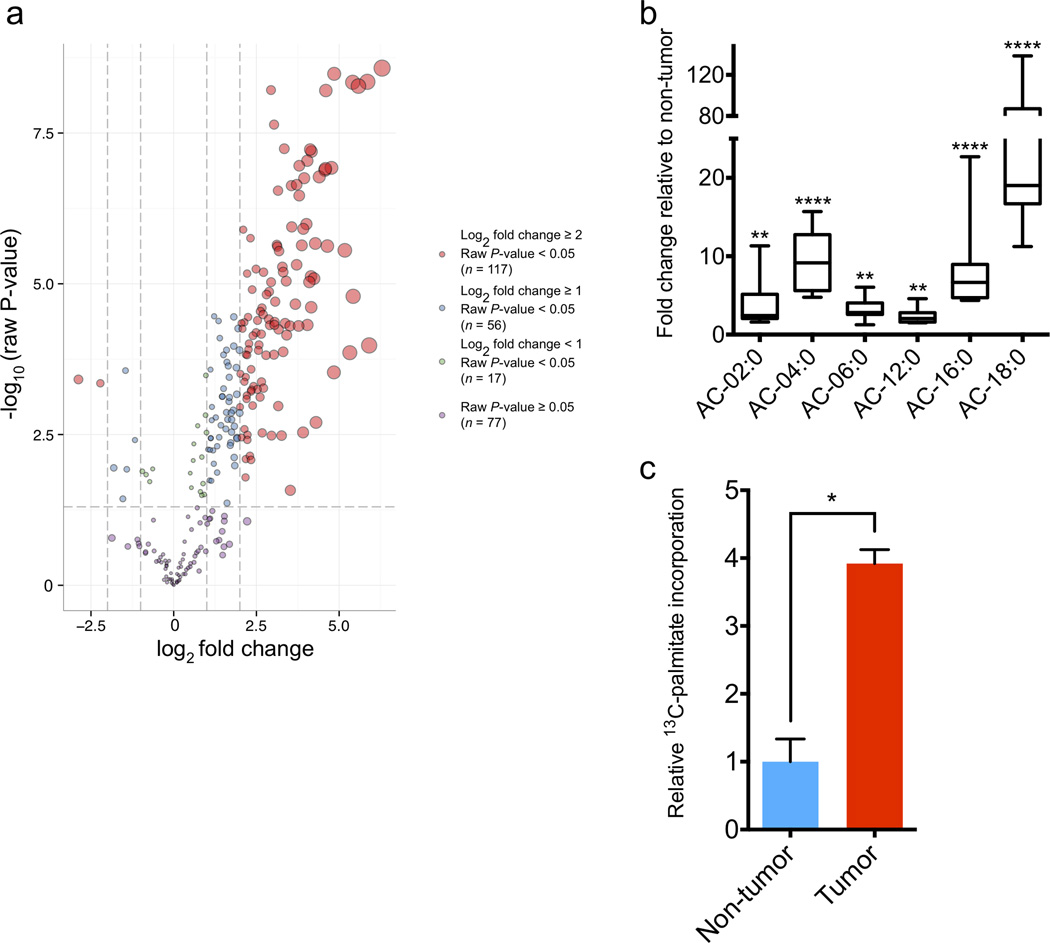
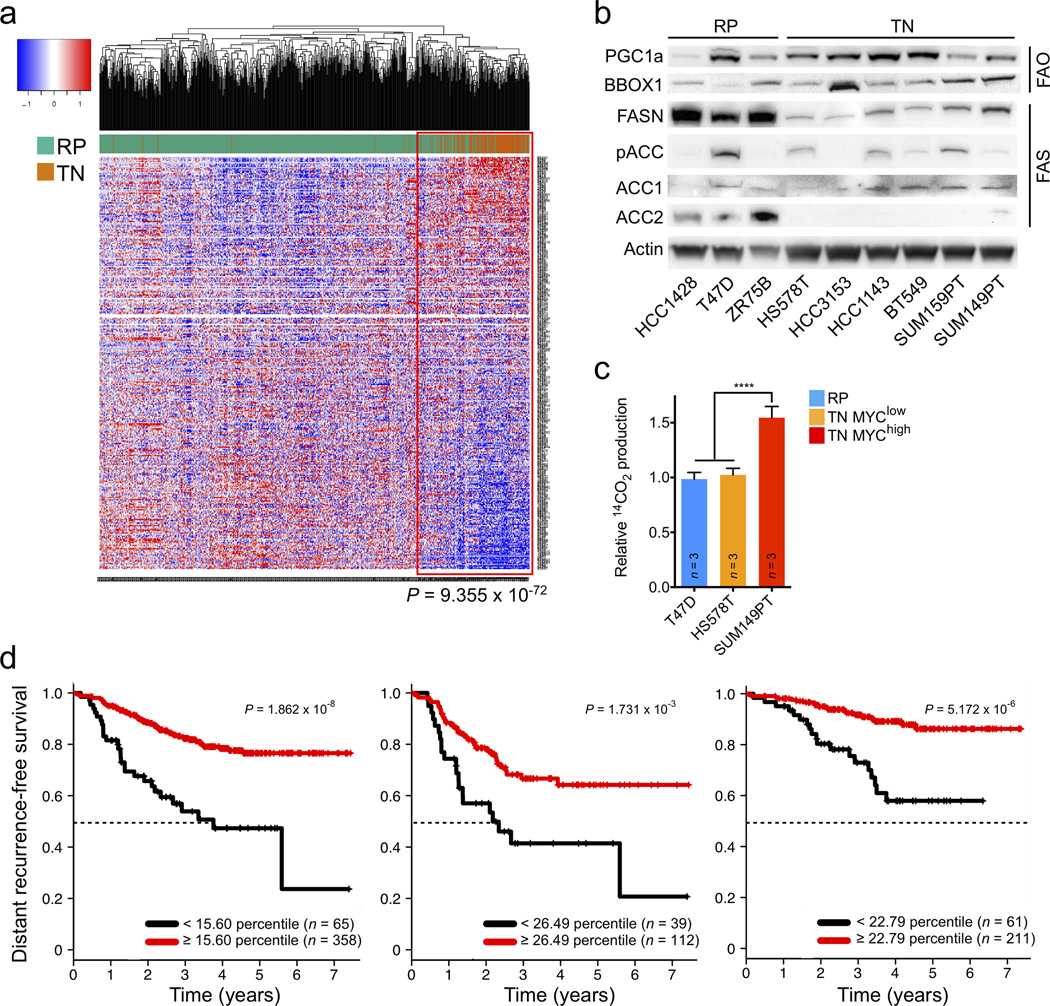
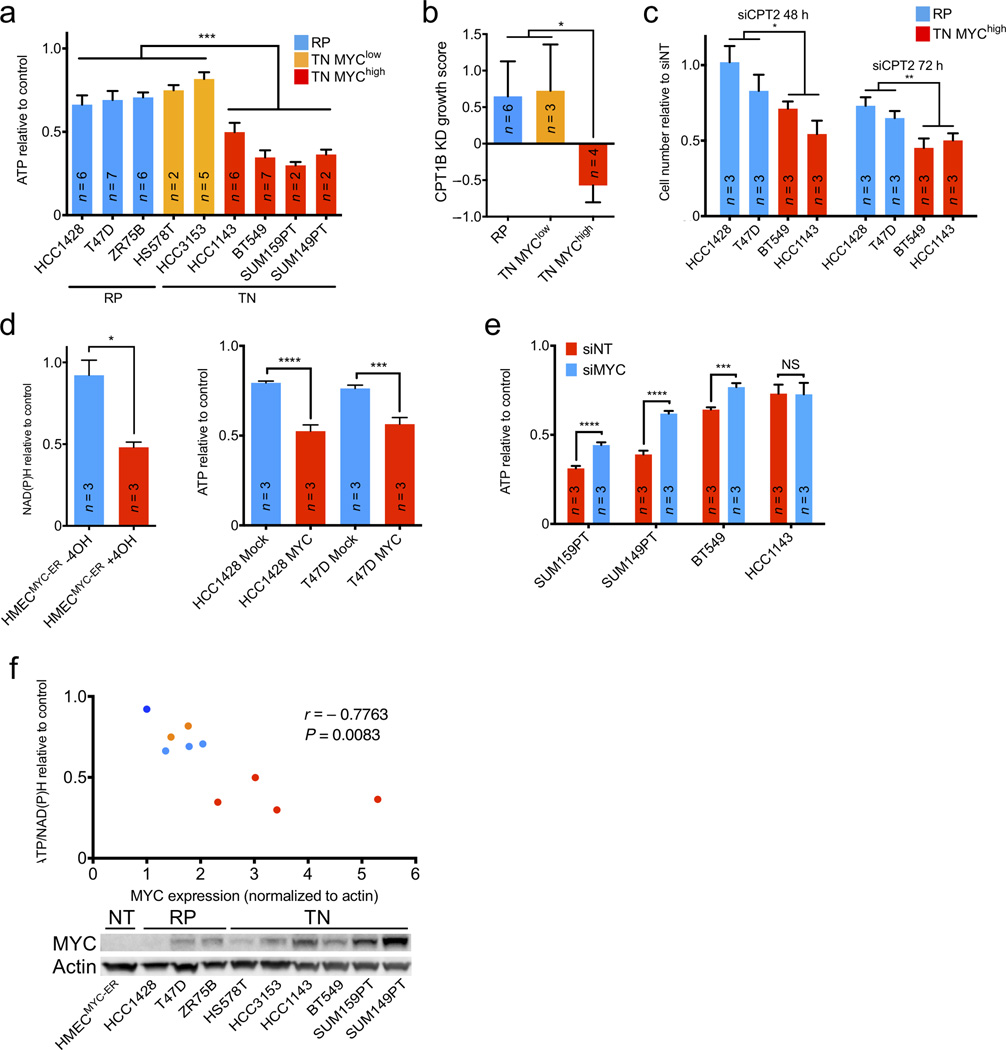
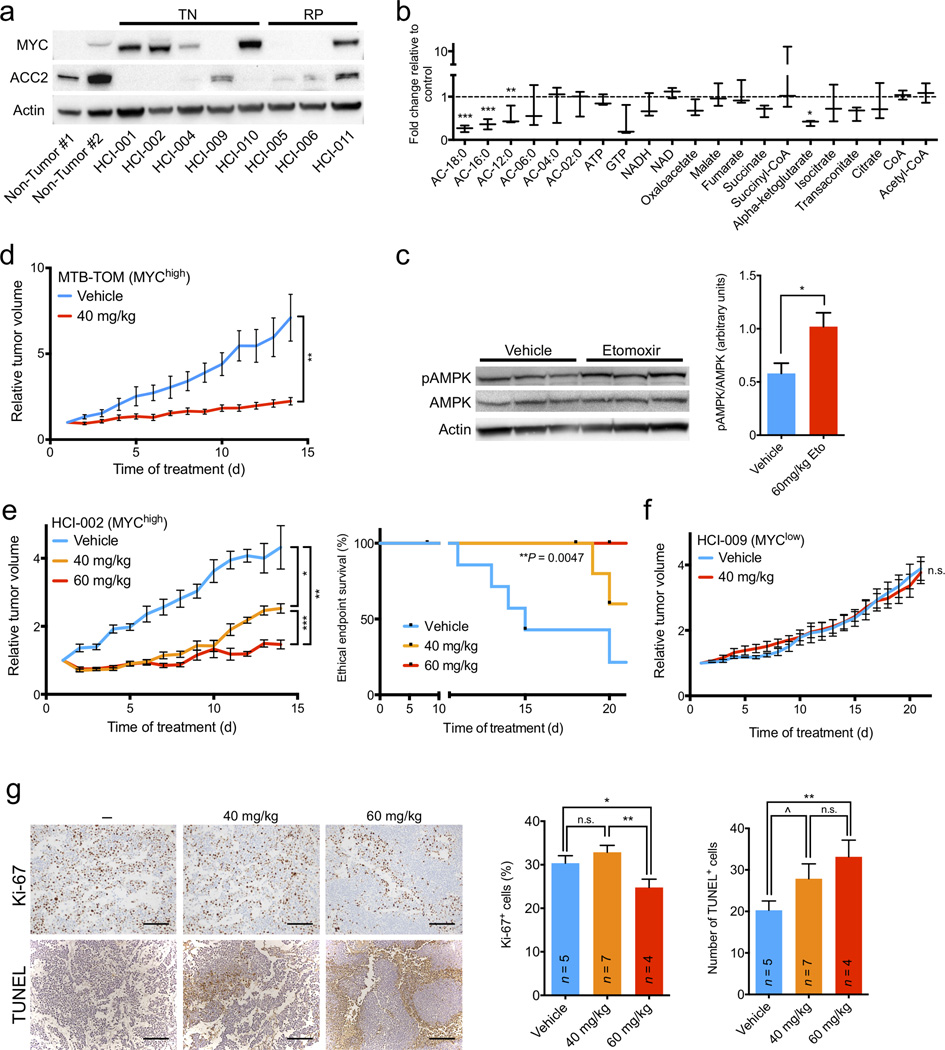
Expression of the oncogenic transcription factor MYC is disproportionately elevated in triple-negative breast cancer (TNBC), as compared to estrogen receptor-, progesterone receptor- or human epidermal growth factor 2 receptor-positive (RP) breast cancer. We and others have shown that MYC alters metabolism during tumorigenesis. However, the role of MYC in TNBC metabolism remains mostly unexplored. We hypothesized that MYC-dependent metabolic dysregulation is essential for the growth of MYC-overexpressing TNBC cells and may identify new therapeutic targets for this clinically challenging subset of breast cancer. Using a targeted metabolomics approach, we identified fatty acid oxidation (FAO) intermediates as being dramatically upregulated in a MYC-driven model of TNBC. We also identified a lipid metabolism gene signature in patients with TNBC that were identified from The Cancer Genome Atlas database and from multiple other clinical data sets, implicating FAO as a dysregulated pathway that is critical for TNBC cell metabolism. We found that pharmacologic inhibition of FAO catastrophically decreased energy metabolism in MYC-overexpressing TNBC cells and blocked tumor growth in a MYC-driven transgenic TNBC model and in a MYC-overexpressing TNBC patient-derived xenograft. These findings demonstrate that MYC-overexpressing TNBC shows an increased bioenergetic reliance on FAO and identify the inhibition of FAO as a potential therapeutic strategy for this subset of breast cancer.


Figures

Figure 1
Figure 1
MTB-TOM tumors display dysregulated FAO. (a) Volcano plot of dysregulated metabolites in MTB-TOM tumors compared to non-tumor mammary glands. Values shown are log fold change of metabolites from seven tumors from five induced mice compared to those from five mammary glands from four uninduced mice. (b) Fold-change in AC levels in MTB-TOM tumors versus non-tumor mammary glands. Values are shown as min-to-max box plots of same mice as in (a). (c) Carbon flux analysis showing 13C-palmitoyl-carnitine production from 13C-palmitate in MTB-TOM orthotopic transplants compared to contralateral non-tumor mammary gland. A two-tailed unpaired t-test was used to compare non-tumor to tumor. Values shown are mean ± s.e.m. of four mice. All differential metabolite abundance analyses were performed using the limma R package (a, b). *P < 0.05, **P < 0.01, ****P < 0.0001
Figure 2
Figure 2
Human TNBC displays dysregulated FAO. (a) Hierarchical clustering of TCGA RNASeq samples of 771 breast cancer patients for 336 fatty acid metabolism genes in TN and RP tumors. Individual gene expression is row-normalized from −1 (blue) to 1 (red). A Fisher’s exact test was used to calculate indicated P-value demonstrating significant enrichment of TN tumors (116/123) in the clade outlined in red. (b) Immunoblot analysis showing expression levels of FAO activators PGC-1α and BBOX1, and fatty acid synthesis enzymes FASN, ACC1, ACC2 and pACC1/2 in a panel of TN and RP human cell lines. (f) Kaplan-Meier graphs of all (left), TN (middle) and RP (right) patients, dichotomized by ACACB (ACC2) mRNA expression at an optimal threshold, from a pooled neoadjuvant chemotherapy treated cohort. Samples with decreased ACACB expression are represented with black lines. Median survival time (MST) is indicated with black dotted lines. For all tumors ACACBlow MST = 3.76 years. For TN tumors ACACBlow MST = 2.18 years. MST not reached in any other group. A log-rank test was used to calculate P-values. All differential gene expression analyses were performed using the limma R package (a).
Figure 3
Figure 3
FAO inhibition shows MYC-dependent bioenergetic effects in vitro. (a) ATP response of TN MYChigh versus TN MYClow and RP cells untreated or treated with 200 µM etomoxir for 48 h. (b) Growth response of an independent panel of TN MYChigh versus TN MYClow and RP cells treated with a pool of shRNAs targeting CPT1. (c) Proliferation response of TN versus RP cells to siRNA-mediated CPT2 knockdown after 48 and 72 h. (d) Fatty acid oxidation in TN MYChigh versus TN MYClow and RP cells. Relative 14CO2 production was normalized per cell line to total protein levels. (e) Left, NAD(P)H response of HMECMYC-ER with or without MYC activation for 48 h, then untreated or treated with 200 µM etomoxir for 24 h. Right, ATP response of RP cells with or without MYC overexpression untreated or treated with 200 µM etomoxir for 48 h. (f) ATP response of TN MYChigh cells with or without siRNA-mediated MYC knockdown untreated or treated with 200 µM etomoxir for 48 h. (g) Above, correlation of MYC protein expression and mean ATP/NAD(P)H response to etomoxir of TN and RP cells in (a) and HMECMYC-ER cells without MYC in (b). Pearson correlation and two-tailed t-test were used to generate correlation coefficient and associated P-value. Coloring same as (a) except HMECMYC-ER (dark blue). Below, immunoblot analysis showing MYC protein levels in indicated cell lines. A two-tailed unpaired t-test was used to compare experimental groups (a–f). Values shown are mean ± s.e.m. from triplicate samples (a, d–f), indicated number of cell lines (b), or three biological replicates (c). Number of biological replicates is indicated (a, d–f). *P ≤ 0.05, **P < 0.01, ***P < 0.001, ****P < 0.0001
Figure 4
Figure 4
FAO inhibition shows MYC-dependent bioenergetic and growth effects in vivo. (a) Immunoblot analysis of indicated protein expression in TN and RP patient-derived xenografts and human non-tumor reduction mammoplasty tissues. (b) Fold change in metabolite levels in etomoxir-treated xenografts versus vehicle-treated tumors. Values are shown as min-to-max box plots from three mice in each group. (c) Etomoxir- and vehicle-treated tumors were examined by immunoblotting for indicated protein expression. pAMPK/AMPK ratio was normalized to β-actin. (d) FVB/N mice with orthotopic MTB-TOM tumor allografts were treated with vehicle or etomoxir (40 mg/kg) daily for 14 d. Growth plots are shown. (e) Left, NOD/SCID mice with orthotopic HCI-002 xenografts were treated with vehicle or etomoxir (40 or 60 mg/kg) daily for 21 d. Growth plots are shown. Statistical analysis was performed using a log-rank test. (f) NOD/SCID mice with orthotopic HCI-009 xenografts were treated with vehicle or etomoxir (40 mg/kg) daily for 21 d. Growth plots are shown. (g) Left, representative Ki-67 and TUNEL staining of untreated, 40 or 60 mg/kg etomoxir-treated HCI-002 tumors from mice euthanized at the end of the study. Right, quantification of percent Ki-67 positive cells per field and number of TUNEL positive cells per field. Number of mice analyzed in each treatment is indicated. Scale bar indicates 200 µm. All differential metabolite abundance analyses were performed using the limma R package. A two-tailed unpaired t-test was used to compare experimental groups (c–g). Values shown are mean ± s.e.m. from three individual mice (c), six mice in the control group and seven mice in the experimental group (d), seven mice in the control and 40 mg/kg etomoxir groups and five mice in the 60 mg/kg group (e), three mice in each group (f), or three high-powered (20×) fields from two separate areas of each tumor (g). ^P ≤ 0.10, *P ≤ 0.05, **P < 0.01, ***P < 0.001

Comment in

References

MAIN TEXT REFERENCES

    1. Horiuchi D, et al. MYC pathway activation in triple-negative breast cancer is synthetic lethal with CDK inhibition. J. Exp. Med. 2012;209:679–696. - PMC - PubMed
    1. Koboldt DC, et al. Comprehensive molecular portraits of human breast tumours. Nature. 2012;490:61–70. - PMC - PubMed
    1. Hu S, et al. 13C-pyruvate imaging reveals alterations in glycolysis that precede c-Myc-induced tumor formation and regression. Cell Metab. 2011;14:131–142. - PMC - PubMed
    1. Wahlström T, Henriksson MA. Impact of MYC in regulation of tumor cell metabolism. Biochim. Biophys. Acta. 2014 - PubMed
    1. D’Cruz CM, et al. c-MYC induces mammary tumorigenesis by means of a preferred pathway involving spontaneous Kras2 mutations. Nat. Med. 2001;7:235–239. - PubMed

METHODS-ONLY REFERENCES

    1. Davis S, Meltzer PS. GEOquery: a bridge between the Gene Expression Omnibus (GEO) and BioConductor. Bioinformatics. 2007;23:1846–1847. - PubMed
    1. Langfelder P, Horvath S. WGCNA: an R package for weighted correlation network analysis. BMC Bioinformatics. 2008;9:559. - PMC - PubMed
    1. Langfelder P, Horvath S. Fast R Functions for Robust Correlations and Hierarchical Clustering. J. Stat. Softw. 2012;46 - PMC - PubMed
    1. Mukhopadhyay R, et al. Promotion of variant human mammary epithelial cell outgrowth by ionizing radiation: an agent-based model supported by in vitro studies. Breast Cancer Res. 2010;12:R11. - PMC - PubMed
    1. Narita M, et al. Rb-mediated heterochromatin formation and silencing of E2F target genes during cellular senescence. Cell. 2003;113:703–716. - PubMed

Publication types

MeSH terms