. 2016 Apr;22(4):421-6.
doi: 10.1038/nm.4057. Epub 2016 Mar 7.

A branched-chain amino acid metabolite drives vascular fatty acid transport and causes insulin resistance

Affiliations

A branched-chain amino acid metabolite drives vascular fatty acid transport and causes insulin resistance

Cholsoon Jang et al. Nat Med. 2016 Apr.

Abstract

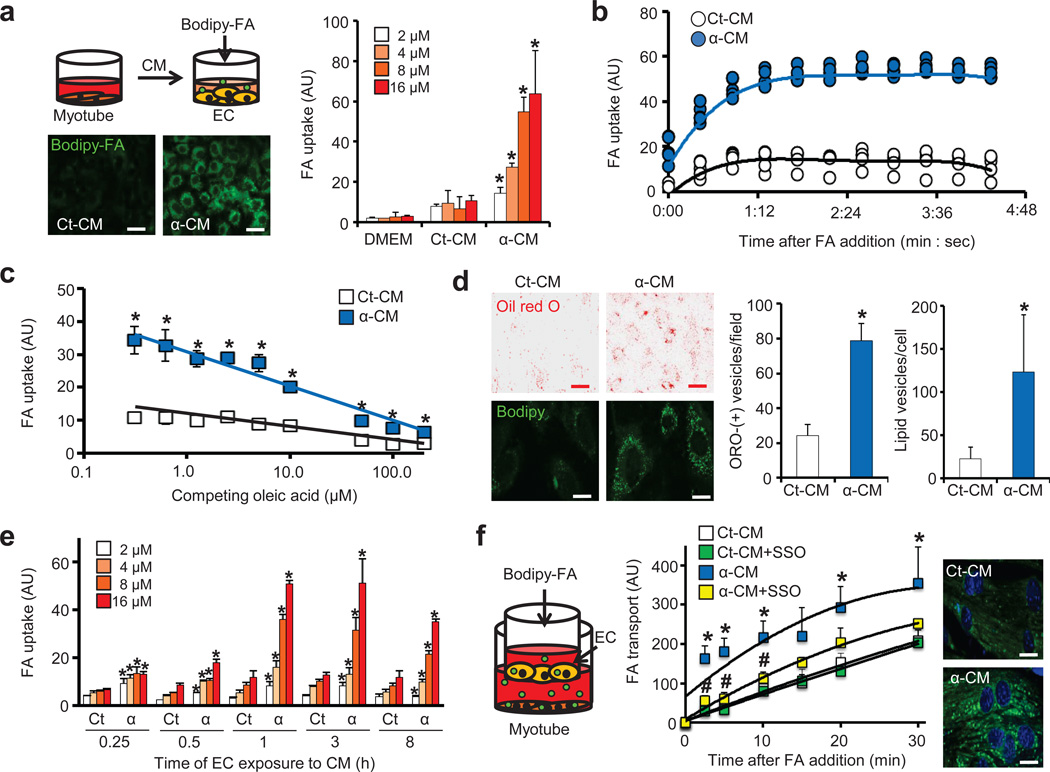
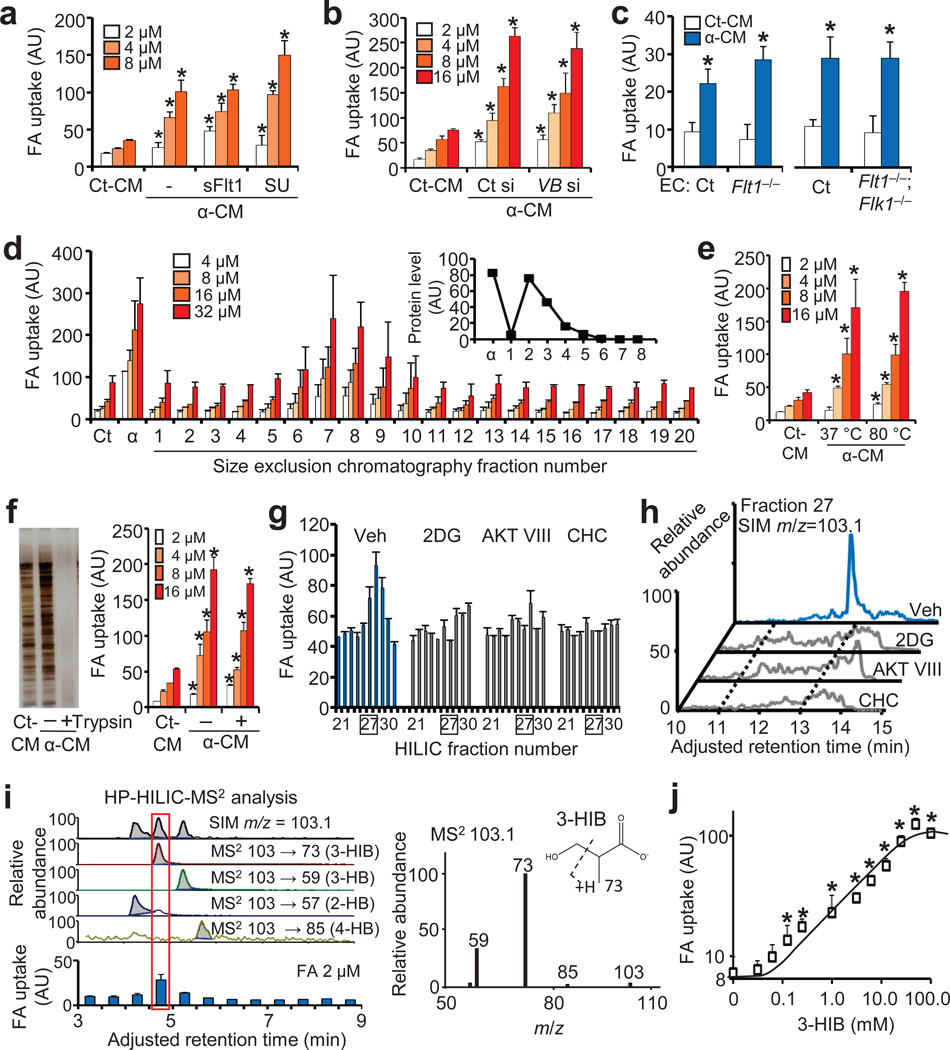
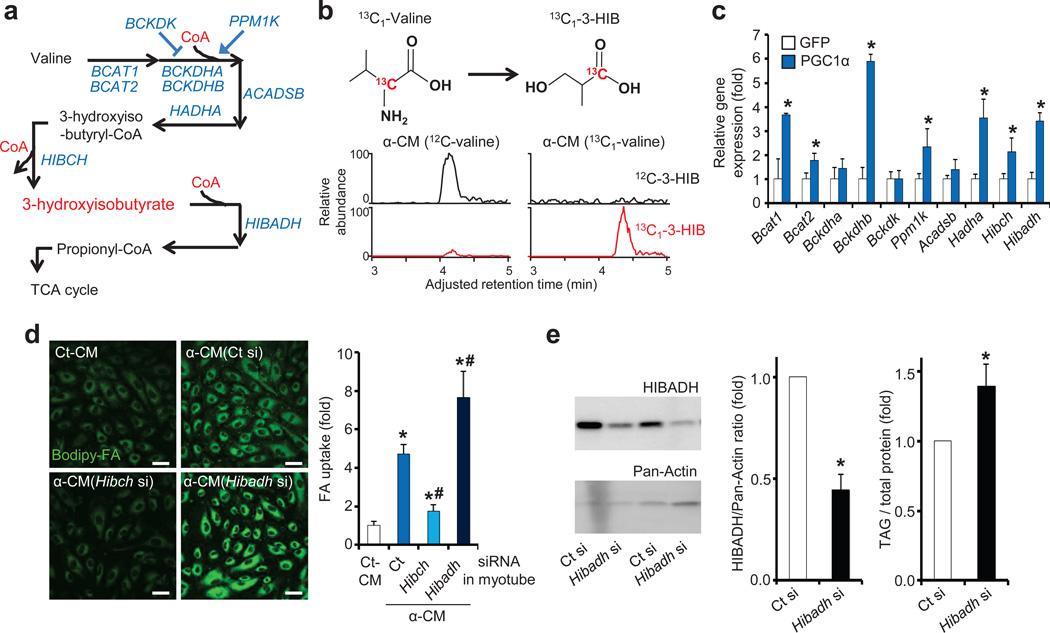
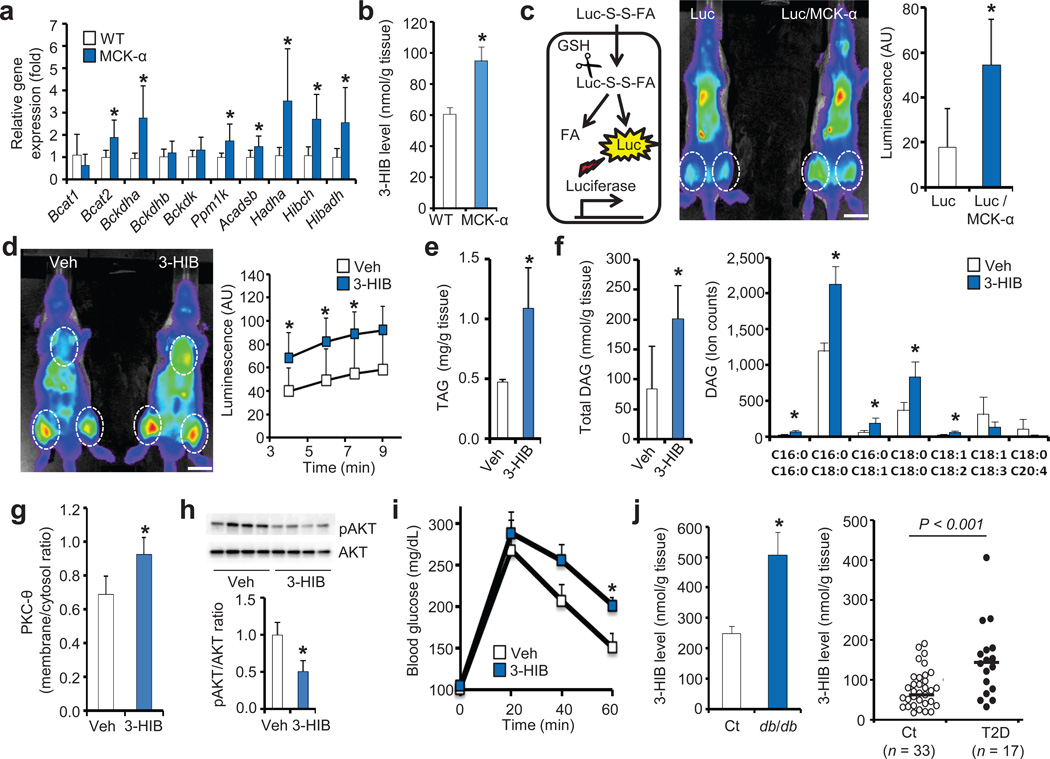
Epidemiological and experimental data implicate branched-chain amino acids (BCAAs) in the development of insulin resistance, but the mechanisms that underlie this link remain unclear. Insulin resistance in skeletal muscle stems from the excess accumulation of lipid species, a process that requires blood-borne lipids to initially traverse the blood vessel wall. How this trans-endothelial transport occurs and how it is regulated are not well understood. Here we leveraged PPARGC1a (also known as PGC-1α; encoded by Ppargc1a), a transcriptional coactivator that regulates broad programs of fatty acid consumption, to identify 3-hydroxyisobutyrate (3-HIB), a catabolic intermediate of the BCAA valine, as a new paracrine regulator of trans-endothelial fatty acid transport. We found that 3-HIB is secreted from muscle cells, activates endothelial fatty acid transport, stimulates muscle fatty acid uptake in vivo and promotes lipid accumulation in muscle, leading to insulin resistance in mice. Conversely, inhibiting the synthesis of 3-HIB in muscle cells blocks the ability of PGC-1α to promote endothelial fatty acid uptake. 3-HIB levels are elevated in muscle from db/db mice with diabetes and from human subjects with diabetes, as compared to those without diabetes. These data unveil a mechanism in which the metabolite 3-HIB, by regulating the trans-endothelial flux of fatty acids, links the regulation of fatty acid flux to BCAA catabolism, providing a mechanistic explanation for how increased BCAA catabolic flux can cause diabetes.


Figures

Figure 1
Figure 1. PGC-1α in muscle cells induces secretion of paracrine activity that stimulates endothelial FA transport
(a) Experimental strategy (top), representative images (bottom) and quantification (right) of Bodipy-FA (2–16 µM) uptake by endothelial cells (ECs) after exposure to conditioned media (CM) from myotubes expressing control GFP (Ct-CM) or PGC-1α (α-CM). Scale bars, 50 µm (b,c) Endothelial FA uptake (8 µM) at different time points (b) and in the presence of the indicated concentrations of unlabeled oleic acid for 5 min (c). (d) Staining by oil red O (ORO) of intracellular neutral lipids in ECs after prolonged exposure (24 hrs) to α-CM. Representative images (left) and quantification (right). Red scale bars, 50 µm; white scale bars, 10 µm. (e) Endothelial FA uptake after exposure to the indicated CM for the indicated durations. (f) Experimental strategy (left), quantification of FA transport (8 µM) across a tight EC monolayer (middle), and representative images of myotubes taking up FA transported through the EC monolayer (right). Scale bars, 10 µm. Student’s t-test; *P < 0.05 vs. control; #P < 0.05 vs. α-CM. Two-way ANOVA was used for f. Data are mean ± standard deviation (s.d.) of at least three biological replicates.
Figure 2
Figure 2. Identification of 3-hydroxyisobutyrate (3-HIB) as the paracrine factor
(a) Endothelial FA uptake after exposure to conditioned media (CM) from myotubes expressing control GFP (Ct-CM) or PGC-1α (α-CM) after treatment of ECs with sFlt1 or SU11248 (SU). (b) Endothelial FA uptake after exposure to CM from PGC-1α-expressing myotubes treated with control siRNA (Ct si) or Vegfb siRNA (VB si). (c) FA uptake (2 µM) by ECs isolated from Flt1 KO mice (Flt1−/−) or Flt1 and Flk1 double KO mice (Flt1−/−; Flk1−/−). (d–f) Endothelial FA uptake after exposure to size-exclusion chromatography fractions of α-CM (d), to α-CM heat-inactivated at the indicated temperature (e), or to α-CM treated with trypsin (f). (g) Endothelial FA uptake (8 µM) after exposure to HILIC fractions of CM from PGC-1α-expressing myotubes treated with the indicated inhibitors. Veh, vehicle. (h) Identification by mass spectrometry of a molecule with m/z = 103.1 specific to HILIC fraction 27. (i) Selective ion monitoring (SIM) of HP-HILIC-MS2 identified the paracrine activity overlaid with MS2 signature of 103->73 (left), of which MS2 spectra matched with 3-HIB (right). (j) Endothelial FA uptake (2 µM) after incubation with the indicated concentrations of 3-HIB for 1 hr. Student’s t-test; *P < 0.05 vs. control. Data are mean ± s.d. of at least three biological replicates.
Figure 3
Figure 3. 3-HIB is generated from valine catabolism induced by PGC-1α and stimulates endothelial FA uptake
(a) Schematic of valine catabolism. (b) Detection of 13C-labeled 3-HIB in CM from PGC-1α-expressing myotubes incubated with 13C-labeled valine. (c) qPCR analysis of valine metabolic enzymes in myotubes expressing control GFP or PGC-1α. (d) Representative images of ECs taking up Bodipy-FA (left) and quantification (right) after exposure to CM from PGC-1α-expressing myotubes (α-CM) treated with Hibch or Hibadh siRNA. Scale bars, 50 µm. (e) Western blot of mouse skeletal muscle after injection in intact animals with Hibadh siRNA. Representative gel images (left), quantification (middle) and muscle triacylglyceride (TAG) levels (right, n = 8). Student’s t-test; *P < 0.05 vs. control; #P < 0.05 vs. α-CM. Two-way ANOVA for d. Data are mean ± s.d. of at least three biological replicates.
Figure 4
Figure 4. 3-HIB induces FA uptake in vivo and causes glucose intolerance
(a,b) qPCR analysis of valine metabolic enzymes (a, n = 6) and measurement of 3-HIB levels (b, n = 3) in muscle from wild type (WT) or PGC-1α-muscle specific transgenic mice (MCK-α). (c) Schematic of in vivo FA uptake assay (left). GSH, glutathione. Representative image (middle) and quantification (right, n = 4) of FA uptake in thigh of Luciferase transgenic (Luc) or Luc/MCK-α double transgenic mice. Scale bars, 1 cm. (d) Representative image (left) and quantification (right, n = 4) of FA uptake in thigh of Luc mice fed with vehicle (Veh) or 3-HIB for 1.5 hr. Scale bars, 1 cm. (e–i) Measurements of triacylglyceride (e, n = 3) and diglyceride (DAG, f, n = 4), PKC-θ membrane translocation (g, n = 4), AKT activation (h, n = 4) in muscle, and systemic glucose tolerance (i, n = 8) of mice provided with vehicle (Veh) or 3-HIB in the drinking water for 2 weeks. (j) Measurements of 3-HIB levels in muscle of db/db mice (left, n = 10) and muscle biopsies of type II diabetic (T2D) subjects (right). Student’s t-test; *P < 0.05 vs. control. In j, indicated P was with Student’s t-test; with Mann-Whitney u-test, P < 0.005 vs. control. Data are mean ± s.d. (a,c–h) or ± s.e.m. (b,i,j).

Comment in

References

    1. Wang TJ, et al. Metabolite profiles and the risk of developing diabetes. Nat. Med. 2011;17:448–453. - PMC - PubMed
    1. Newgard CB, et al. A branched-chain amino acid-related metabolic signature that differentiates obese and lean humans and contributes to insulin resistance. Cell Metab. 2009;9:311–326. - PMC - PubMed
    1. Newgard CB. Interplay between lipids and branched-chain amino acids in development of insulin resistance. Cell Metab. 2012;15:606–614. - PMC - PubMed
    1. Shulman GI. Ectopic fat in insulin resistance, dyslipidemia, and cardiometabolic disease. N. Engl. J. Med. 2014;371:1131–1141. - PubMed
    1. Chan MC, Arany Z. The many roles of PGC-1alpha in muscle - recent developments. Metabolism. 2014;63:441–451. - PMC - PubMed

Publication types

MeSH terms