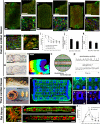
. 2016 Jun;15(6):669-78.
doi: 10.1038/nmat4570. Epub 2016 Mar 7.

Biodegradable scaffold with built-in vasculature for organ-on-a-chip engineering and direct surgical anastomosis

Affiliations

Biodegradable scaffold with built-in vasculature for organ-on-a-chip engineering and direct surgical anastomosis

Boyang Zhang et al. Nat Mater. 2016 Jun.

Abstract

We report the fabrication of a scaffold (hereafter referred to as AngioChip) that supports the assembly of parenchymal cells on a mechanically tunable matrix surrounding a perfusable, branched, three-dimensional microchannel network coated with endothelial cells. The design of AngioChip decouples the material choices for the engineered vessel network and for cell seeding in the parenchyma, enabling extensive remodelling while maintaining an open-vessel lumen. The incorporation of nanopores and micro-holes in the vessel walls enhances permeability, and permits intercellular crosstalk and extravasation of monocytes and endothelial cells on biomolecular stimulation. We also show that vascularized hepatic tissues and cardiac tissues engineered by using AngioChips process clinically relevant drugs delivered through the vasculature, and that millimetre-thick cardiac tissues can be engineered in a scalable manner. Moreover, we demonstrate that AngioChip cardiac tissues implanted with direct surgical anastomosis to the femoral vessels of rat hindlimbs establish immediate blood perfusion.


Figures
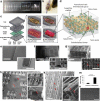
Figure 1
Figure 1. AngioChip scaffold fabrication and visualization
a, Image of multiple AngioChip scaffolds patterned in parallel on glass slides. b, Image of an AngioChip hepatic tissue, perfused with a color dye, beside the tip of a ballpoint pen for scale. c, Schematic of the assembly of the bioreactor and the assembly of vascularized tissue. d, Schematic of a part of an AngioChip tissue. e-g, SEM of (e) a 1-D tube (scale bar: 1.5mm and 500μm), (f) a 2-D AngioChip scaffold (scale bar: 1mm and 300μm) and (g) a multi-layer 3-D AngioChip scaffold with 20μm micro-holes (scale bar: 1mm and 400μm) created using the 3-D stamping technique. h, SEM of an AngioChip scaffold with 10μm micro-holes on the channel walls. Scale bar: 200μm. SEM of (i) the 3-D lattice matrix in between the micro-channels (scale bar: 100μm) and (j) the cross-section of a 10μm micro-hole on the channel wall (scale bar: 50μm). Red arrows point to the micro-holes. k-l, SEM of the AngioChip scaffolds with 20μm micro-holes on the top and side walls of the micro-channels. Red arrows point to the micro-holes on the top and side walls. Scale bar: (k) 400μm, and (l) 100μm. m, Mass loss in 1 day from porogen leaching for pore-free and nano-porous AngioChip scaffolds (average±s.d., n=3). Pore-free and nano-porous corresponds to scaffolds fabricated without or with the use of porogen, respectively. n, SEM of the surface of AngioChip scaffold after porogen leaching. Scale bar: 500nm.
Figure 2
Figure 2. Physical characterization of the AngioChip scaffolds
a-c, SEM of the AngioChip scaffolds with lattice matrix of increasing macro-porosity: (a) design A (scale bar: 1mm and 200μm), (b) design B (scale bar: 1mm and 200μm), and (c) design C (scale bar: 1mm and 300μm). d, Isosurface plot of the bulk elasticity of POMaC as a function of UV energy, heat exposure duration and percent of porogen, evaluated at the citric acid to maleic anhydride monomer molar ratio of 1:4. e, Representative uniaxial tensile stress-strain plots of the AngioChip scaffolds with the three different lattice matrix designs. Long-edge direction (LD) and short-edge direction (SD) correspond to the circumferential and longitudinal axes of the heart, respectively (n=3). f, Permeability of AngioChip scaffold wall to FITC-dextran (70kDa) with and without ECs coating or 10μm micro-holes. (average±s.d, n=3). g, Time-lapse fluorescent images of 332Da FITC diffusing from the built-in network of an AngioChip scaffold with 10μm micro-holes to the surrounding lattice matrix. Scale bar: 300μm. Final Images were stitched from multiple images. h, Time-lapse images of carboxyfluorescein diacetate (CFDA, 557Da) diffusing from the built-in internal network with 10μm micro-holes to the surrounding cardiac tissue where it is cleaved by the viable cells (n=3). Scale bar: 300μm. i, Burst pressure of AngioChip scaffolds (average±s.d., n=4) and rat femoral veins (average±s.d., n=6).
Figure 3
Figure 3. Endothelialization of the AngioChip network
a-d, Immunostaining (CD31, red) of the internal vasculature of an Angiochip scaffold on day 2 with (a) a view of the entire network (scale bar: 100μm. Image was stitched from multiple images), (b) a view of a corner (scale bar: 100μm), and (c) a straight segment (scale bar: 100μm), and (d) a branch (n=3). e, Schematics of ECs migrating and sprouting from the inner lumen of the micro-channel to the surrounding parenchyma through the built-in 20μm micro-holes on the side-walls. f-g, Fluorescent image of ECs (labeled green) sprouting from the channel networks into the parenchymal space on day 2 (n=4). White arrow points to a vessel sprouting within the micro-hole on the sidewall. Scale bar: 100 μm. h, Change in permeability of the endothelialized networks with 20μm micro-holes to 70kDa dextran upon treatment with thymosin β4 for 24 hr. Normalization was performed by dividing the permeability of the endothelium after Tβ4 application for 24hr to the unstimulated starting endothelium permeability of the same batch (n=6). i, Schematics of the human whole blood perfusion through the endothelialized AngioChip network. The AngioChip scaffold is located in the main well. The black arrow indicates the flow direction. j-k, SEM of (j) the luminal surface of an untreated scaffold network and (k) the luminal surface of an endothelialized network (day 2 in culture) after perfusion with 1% (v/v) heparinized human whole blood at 15dynes/cm2 for 30min (n=3). Scale bar: (j, k) 100μm, and (inset) 50μm. White arrows point to representative platelets. l, Quantification of the luminal surface area of the scaffold network covered by the platelets (average±s.d., n=3). m, Schematic of the perfusion of monocytes through the endothelialized network with 10μm micro-holes. n, Quantification of adhered THP-1 monocytes on the inner luminal surface of ECs coated AngioChip scaffold (day 2 in culture) with or without TNF-α treatment. (average±s.d, n=3). o-p, Images of fluorescently labeled THP-1 monocytes on ECs coated AngioChip network (o) without or (p) with prior TNF-α treatment (n=3). Scale bar: 200μm. White arrows point to adhered monocytes. q, Time-lapse images of fluorescently labeled monocytes (green) migrating laterally in the endothelialized scaffold network passing through a 10μm micro-hole (n=3). Scale bar: 50μm. r, Trans-endothelial migration of fluorescently labeled monocytes (green) through the 10μm micro-holes on the channel wall (n=3). Scale bar: 200μm. White arrows point to migrating monocytes.
Figure 4
Figure 4. Vascularized hepatic tissue assembly
a-c, Histology cross-section of a hepatic tissue with 10μm micro-holes on day 6 stained for (a-b) CD31 to identify endothelial cells (n=3, scale bar: 200μm) and (c) albumin to identify hepatocytes (n=3, scale bar: 200μm). d, Bright-field image of a hepatic tissue perfused with blue color dye. Scale bar: 500μm. e, Fluorescent image of a CFDA (Green) and propidium iodide (PI, red) stained hepatic tissue shows a high cell viability. Scale bar: 200μm f, Schematic of terfenadine diffusing through the vessel wall with 10μm micro-holes into the hepatic tissue and then subsequently being converted into fexofenadine and released back into the vasculature. g, Concentration of fexofenadine in the bioreactor inlet, main, and outlet wells after 24 hr perfusion of terfenadine at 10μM from inlet wells (average±s.e.m., n=4) on day 6. h-k, Immunostaining of E-cadherin and albumin on (h-i) human hepatocyte monolayer collagen sandwich and (j-k) human AngioChip hepatic tissue on day 7 (n=3). Scale bar: 100μm. l-m, Histology cross-sections of human AngioChip hepatic tissues with 10μm micro-holes on day 7 stained with (l) Hematoxylin and Eosin (H&E), and (m) CD31 to identify endothelial cells (n=3). Scale bar: 200μm. n, Schematic of urea secretion from the hepatic tissue and released into the vasculature with 10μm micro-holes. o, Quantification of urea secretion, normalized to cell number, into the bioreactor main well and outlet well from AngioChip hepatic tissue and collagen sandwich control on day 3 (average±s.d., n=4).
Figure 5
Figure 5. Vascularized cardiac tissue assembly
a-f, Immunostaining of sarcomeric-α-actinin (green) and F-actin (red) on human AngioChip cardiac tissues (a,b) with 10% hMSCs on day 1 and (e,f) day 7 or (c,d) without hMSCs on day 7 (n=3). Scale bar: (a,c,e) 500μm, and (b,d,f) 50μm. (a,c,e) Final images were stitched from multiple images. g-h, Immunostaining of sarcomeric-α-actinin (green) and F-actin (red) on (g) biowire platform and (h) monolayer (n=3) on day 7. Scale bar: 50μm. i, Quantification of decreasing tissue size due to cell remodelling for neonatal rat cardiomyocytes (rat-CMs), human embryonic stem cell derived cardiomyocytes (hESC-CMs), and hESC-CMs mixed with 10% human meshenchymal stem cells (hMSCs). (average ± s.d., n=3). j-k, Electrical excitability parameters (average ± s.d., n=3) on day 7. l-m, Histology cross-sections of human cardiac tissues on day 7 stained with (l) Masson's Trichrome, and (m) CD31 to identify endothelial cells (n=3). Scale bar: 200μm. n, Activation map of human AngioChip cardiac tissue on day 7 (n=7). Scale bar, 1mm. Activation of the construct is seen from stimulus point on the right propagating to the left over a time span of 100ms, in a uniform manner. o, Schematic of perfusion delivery of epinephrine drug through the built-in vasculature with 10μm micro-holes. p, Initial spontaneous contraction trace and drug stimulated contraction trace of a human cardiac tissue on day 7 perfused with 10μM epinephrine (n=3). q, Image of multiple thick AngioChip scaffolds patterned in parallel on glass slides. r, Image of two thick AngioChip cardiac tissues placed face-up and side-up beside a slice of an adult rat heart. Scale shown in mm. s-u, Immunostaining of (s-u) F-actin (green) of the cross-section of an endothelialized thick multi-layer human AngioChip cardiac tissue with 20μm micro-holes on day 3 based on fibrin gel and hESC-derived CMs (n=3). (s) Final image was stitched from multiple images. High magnification images of tissue fibers in the parenchymal space near (t) the edge region and (u) the center region. Scale bar: (s) 1mm, and (t,u) 50μm. v-w, Immunostaining of CD31 of (v) an endothelialized micro-channel lumen with 20μm micro-holes that guide sprouting (red arrows) and (w) an adjacent parenchymal space with self-assembled microvasculature (red arrows) in a thick multi-layer human AngioChip cardiac tissue on day 3 (n=3). Scale bar: (v,w) 50μm. x, Immunostaining of sarcomeric-α-actinin (green) and F-actin (red) on a rat AngioChip cardiac tissue on day 7. Scale bar: 10μm. y, CFDA (green) and PI (red) stained images of the cross-section of rat cardiac tissues with 10μm micro-holes cultivated with or without medium perfusion on day 7 (n=3). Scaffold also stains red. Scale bar: 200μm. Final images were stitched from multiple images. z, Quantification of lactate dehydrogenase (LDH) secretion from rat cardiac tissues cultivated with or without medium perfusion (average±s.d., n=4). *, significant difference between groups with p<0.05.
Figure 6
Figure 6. Surgical anastomosis of the cardiac tissue
a-b, Surgical anastomosis of the AngioChip cardiac tissue on the rat femoral vessels in the configuration of (a) artery-to-artery graft and (b) artery-to-vein graft. Blood perfusion was established immediately after anastomosis. Papers were placed under the implants during imaging for better visual contrast. c-j, Cross-section of the non-endothelialized rat cardiac tissue implants, 1 week after surgery (c-f) without (n=3) or (g-j) with direct anastomosis (n=4) in the configuration of artery-to-vein graft. The sections were stained with (c-d, g-h) Masson's Trichrome, (e,i) smooth muscle actin, and (f-j) troponin T (red). Scale bar: (c,g) 200μm and (d-e, h-i) 100μm, and (f,j) 50μm. k, Image of a cardiac tissue implant on rat hindlimb 1 week after surgery with direct anastomosis in the configuration of artery-to-vein graft. White dotted line outlines the AngioChip implant. l, Quantification of area stained by smooth muscle actin (average±s.d.).m-p, Histology cross-sections of an AngioChip cardiac tissue endothelialized with Lewis rat primary vein endothelial cells and implanted with direct surgical anastomosis after 1 week (n=3). The sections were stained with (m-n) Masson's Trichrome, and (o-p) CD31. Scale bar: (m) 200μm, (n-o) 100μm, and (p) 50μm.

References

    1. Huh D, et al. Reconstituting organ-level lung functions on a chip. Science. 2010;328:1662–1668. - PMC - PubMed
    1. Kim HJ, Huh D, Hamilton G, Ingber DE. Human gut-on-a-chip inhabited by microbial flora that experiences intestinal peristalsis-like motions and flow. Lab on a Chip. 2012;12:2165–2174. - PubMed
    1. Kolesky DB, et al. 3D bioprinting of vascularized, heterogeneous cell-laden tissue constructs. Adv Mater. 2014;26:3124–3130. doi:10.1002/adma.201305506. - PubMed
    1. Zimmermann W-H, et al. Engineered heart tissue grafts improve systolic and diastolic function in infarcted rat hearts. Nature medicine. 2006;12:452–458. doi:10.1038/nm1394. - PubMed
    1. Nunes SS, et al. Biowire: a platform for maturation of human pluripotent stem cell- derived cardiomyocytes. Nature methods. 2013;10:781–787. - PMC - PubMed

Publication types

MeSH terms

Substances