. 2016 Mar 7;11(3):e0150967.
doi: 10.1371/journal.pone.0150967. eCollection 2016.

Underestimation of the Maximal Capacity of the Mitochondrial Electron Transport System in Oligomycin-Treated Cells

Affiliations

Underestimation of the Maximal Capacity of the Mitochondrial Electron Transport System in Oligomycin-Treated Cells

Juliana S Ruas et al. PLoS One. .

Abstract

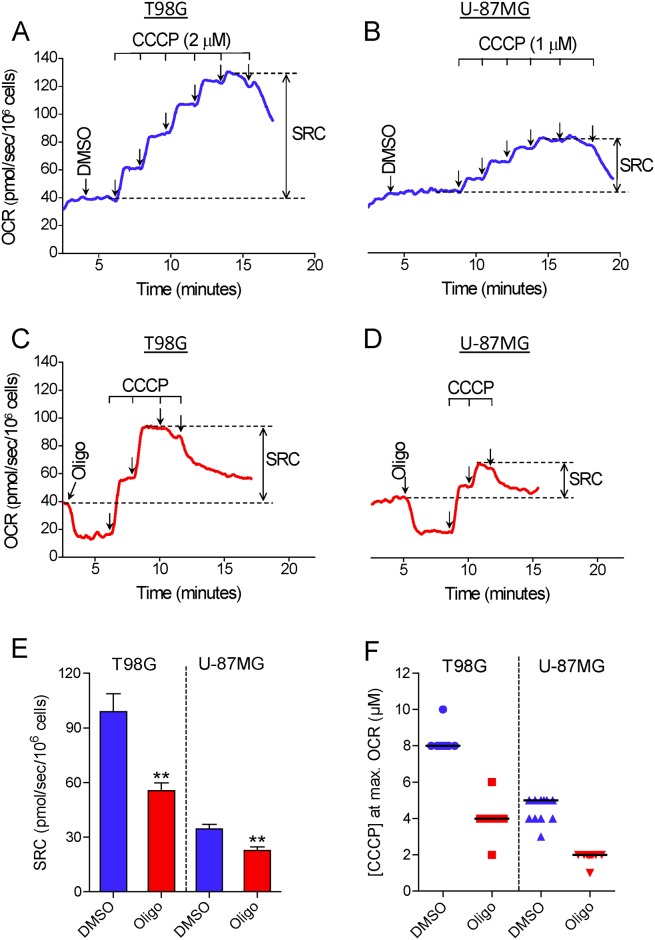
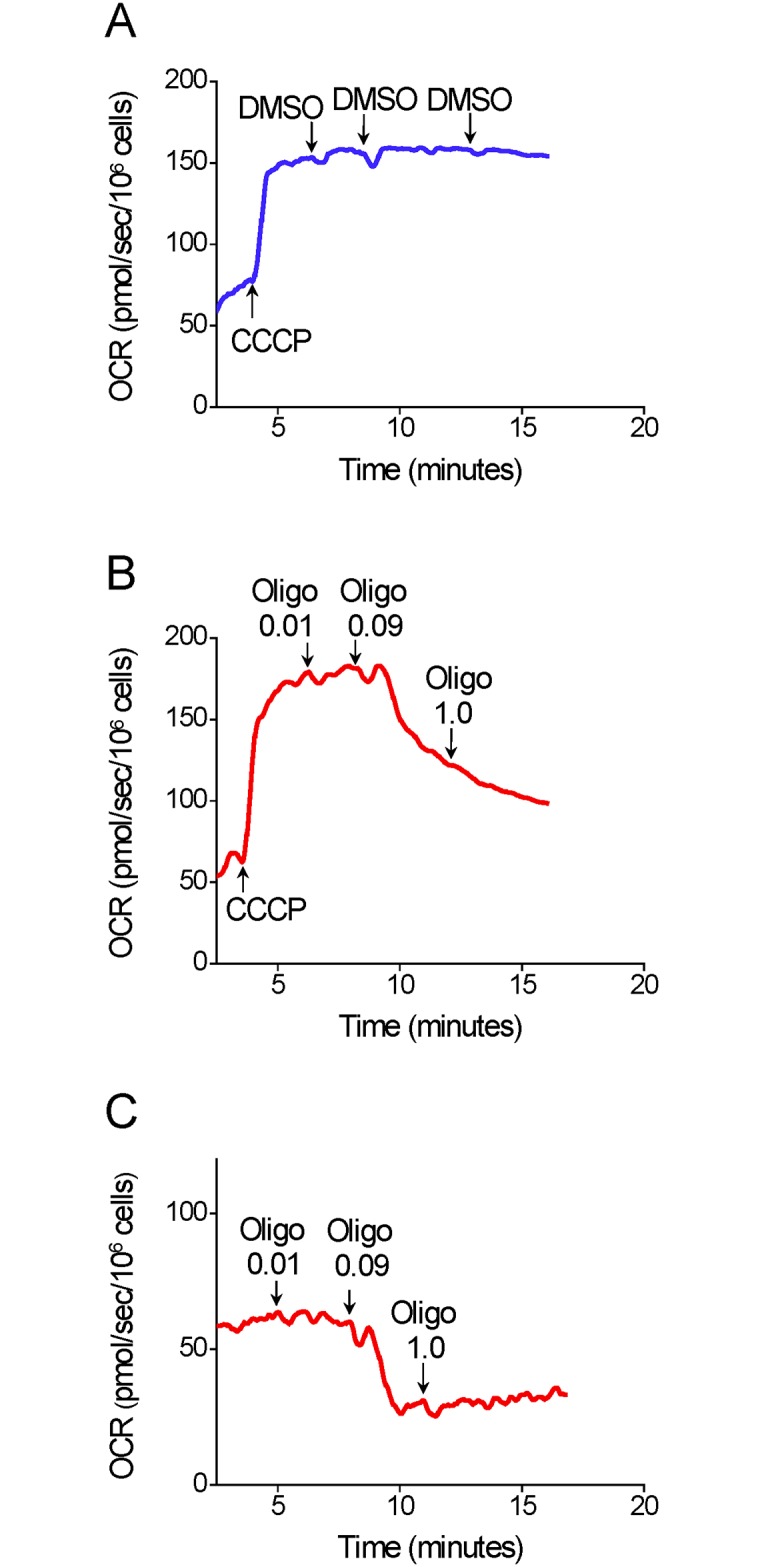
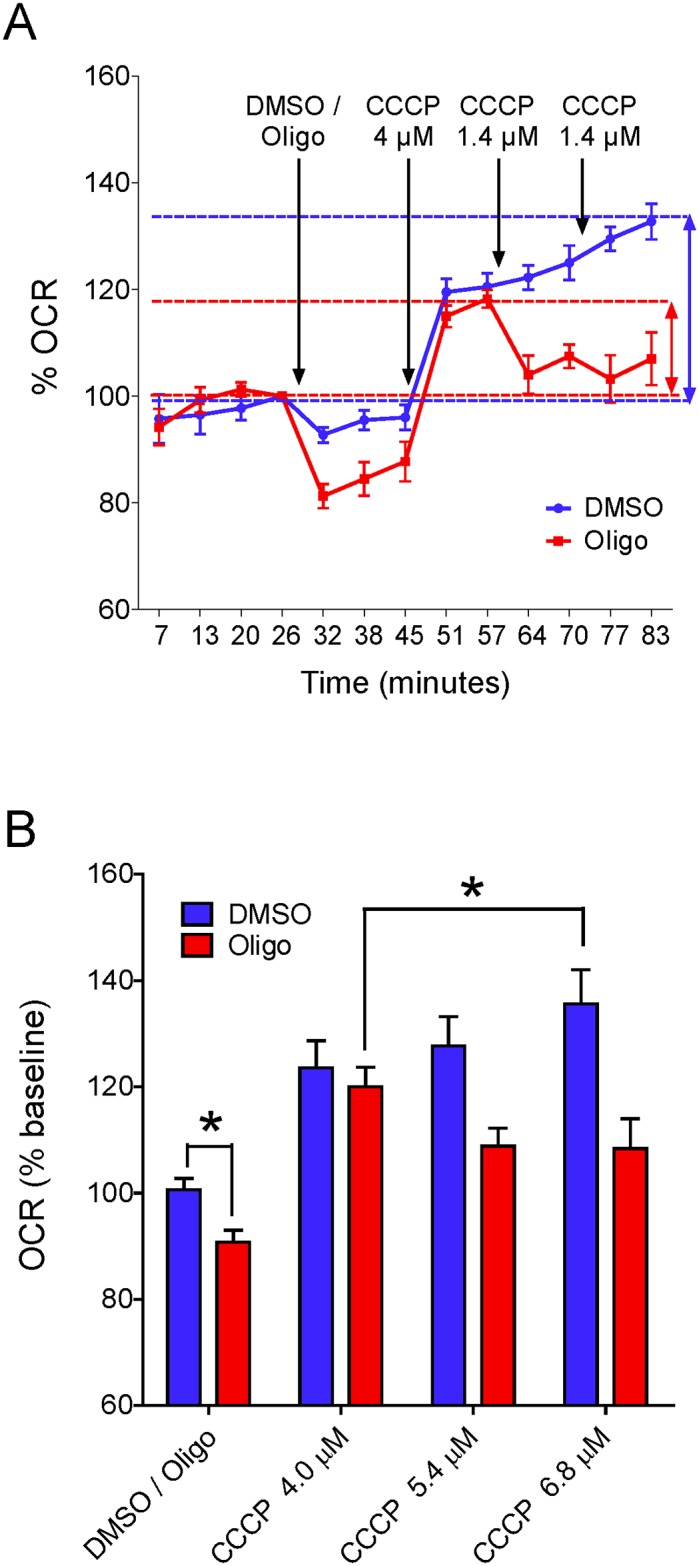
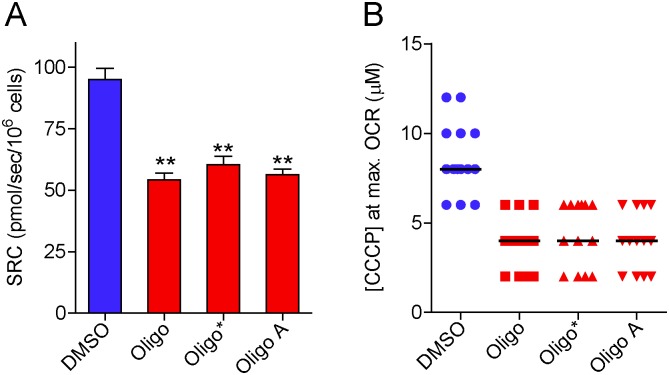
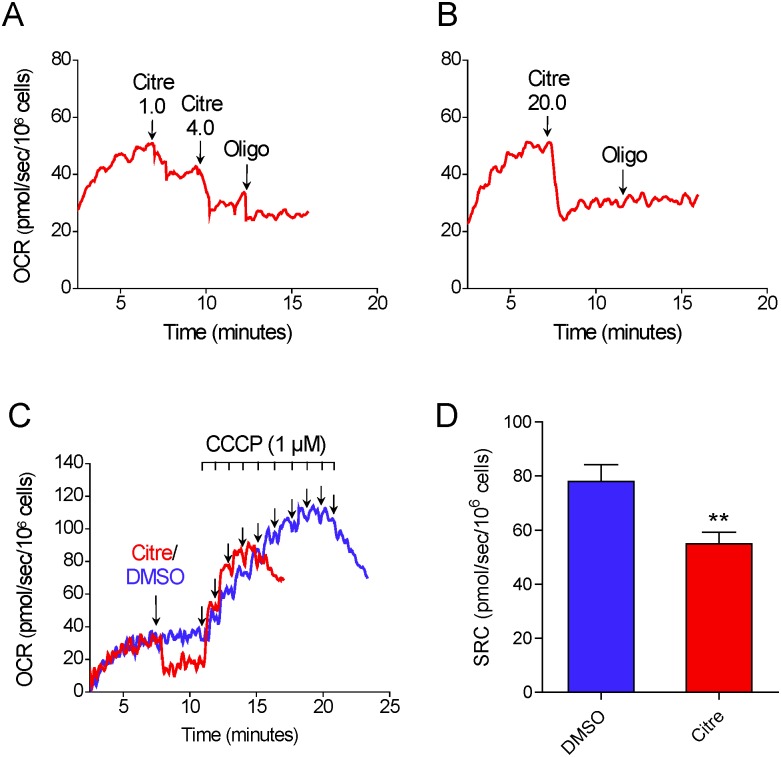
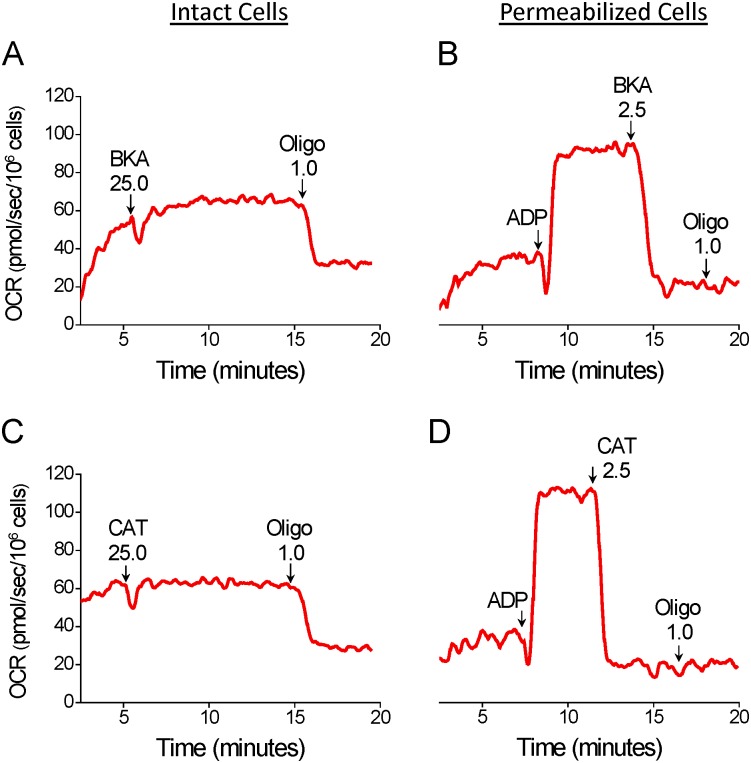
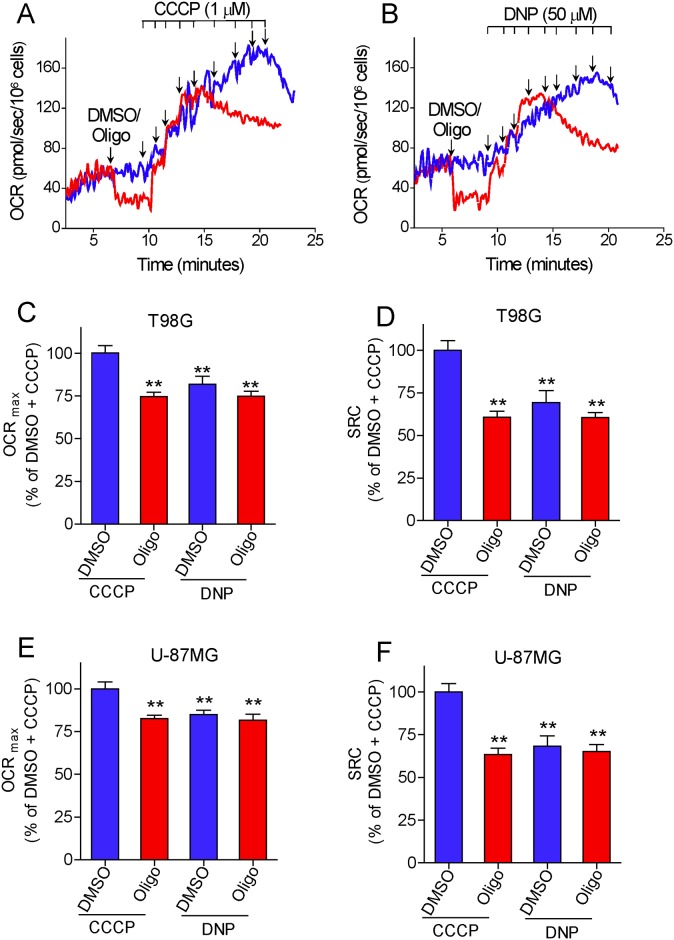
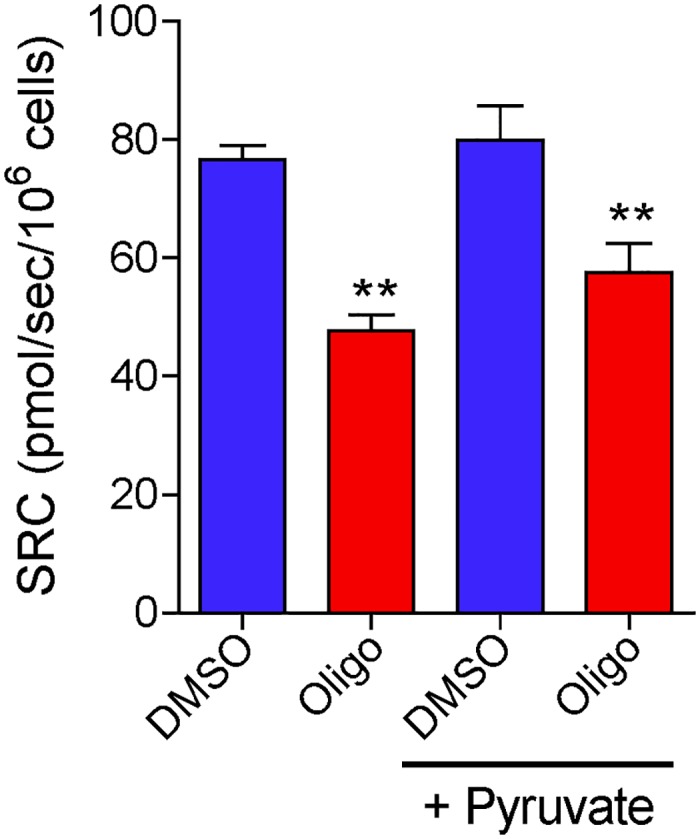
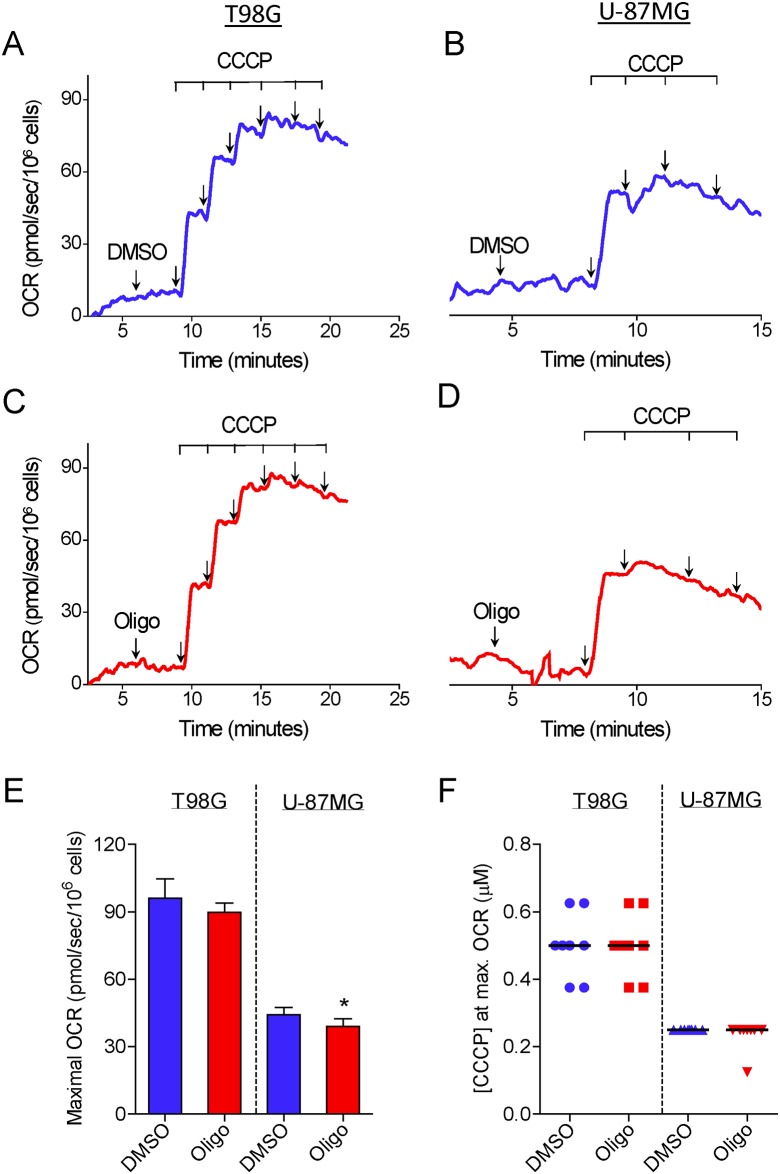
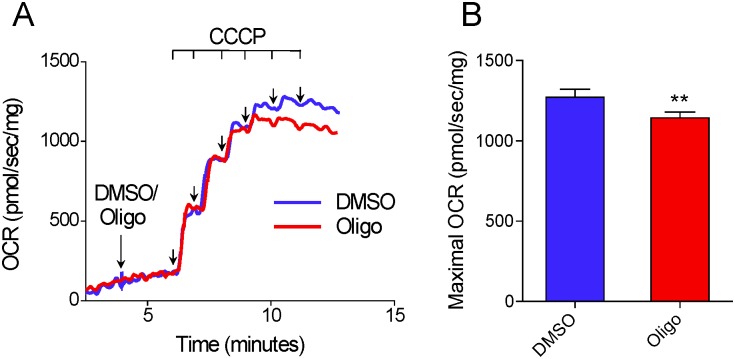
The maximal capacity of the mitochondrial electron transport system (ETS) in intact cells is frequently estimated by promoting protonophore-induced maximal oxygen consumption preceded by inhibition of oxidative phosphorylation by oligomycin. In the present study, human glioma (T98G and U-87MG) and prostate cancer (PC-3) cells were titrated with different concentrations of the protonophore CCCP to induce maximal oxygen consumption rate (OCR) within respirometers in a conventional growth medium. The results demonstrate that the presence of oligomycin or its A-isomer leads to underestimation of maximal ETS capacity. In the presence of oligomycin, the spare respiratory capacity (SRC), i.e., the difference between the maximal and basal cellular OCR, was underestimated by 25 to 45%. The inhibitory effect of oligomycin on SRC was more pronounced in T98G cells and was observed in both suspended and attached cells. Underestimation of SRC also occurred when oxidative phosphorylation was fully inhibited by the ATP synthase inhibitor citreoviridin. Further experiments indicated that oligomycin cannot be replaced by the adenine nucleotide translocase inhibitors bongkrekic acid or carboxyatractyloside because, although these compounds have effects in permeabilized cells, they do not inhibit oxidative phosphorylation in intact cells. We replaced CCCP by FCCP, another potent protonophore and similar results were observed. Lower maximal OCR and SRC values were obtained with the weaker protonophore 2,4-dinitrophenol, and these parameters were not affected by the presence of oligomycin. In permeabilized cells or isolated brain mitochondria incubated with respiratory substrates, only a minor inhibitory effect of oligomycin on CCCP-induced maximal OCR was observed. We conclude that unless a previously validated protocol is employed, maximal ETS capacity in intact cells should be estimated without oligomycin. The inhibitory effect of an ATP synthase blocker on potent protonophore-induced maximal OCR may be associated with impaired metabolism of mitochondrial respiratory substrates.


Conflict of interest statement

Competing Interests: The authors have declared that no competing interests exist.

Figures

Fig 1
Fig 1. Inhibitory effect of oligomycin on CCCP-induced maximal oxygen consumption in intact human glioma cells.
A and C: Representative oxygen consumption rate (OCR) traces in suspended T98G cells (1.5×10⁶/mL). Where indicated by the arrows, 1 μg/mL oligomycin (Oligo) and DMSO (0.5 μL of each) were added, followed by sequential additions of CCCP (2 μM each). B and D: Representative traces of OCR in suspended U-87MG cells (2.0×10⁶ cells/mL). Where indicated by the arrows, 1 μg/mL oligomycin and 0.5 μL DMSO were added followed by sequential additions of CCCP (1 μM each). SRC was estimated as the difference between maximal and basal OCR, as shown in the representative traces. E: SRC values for T98G and U-87MG cells obtained in the presence and absence of oligomycin. **Statistically significant difference from the result for the respective control (DMSO), P<0.01. F: Values of CCCP concentrations required to achieve maximal OCR in T98G and U-87MG cells in the presence and absence of oligomycin.
Fig 2
Fig 2. Inhibitory effect of oligomicyn addition on CCCP-induced maximal OCR in T98G cells.
A–C: Representative OCR traces in suspended T98G cells (1.5×10⁶ cells/mL). Where indicated by the arrows, 5 μM CCCP and 0.5 μL of oligomycin (Oligo; 0.01, 0.09 and 1.0 μg/mL) or DMSO were added.
Fig 3
Fig 3. Inhibitory effect of oligomycin on CCCP-induced maximal OCR in attached T98G cells.
A: Representative experiment to determine OCR in attached T98G cells. Arrows indicate additions of reagents and their concentrations. Results are shown as percentages in relation to the last point before the first addition. SRC (i.e., the difference between maximal respiratory rate and basal respiration) for each condition is indicated by vertical coloured arrows. B: Quantification of OCR with respect to basal respiration in cells treated with DMSO or oligomycin. Maximal respiratory rates with CCCP were smaller in oligomycin-treated cells and occurred at lower CCCP concentrations. *Statistically significant difference from the result for DMSO, P < 0.05.
Fig 4
Fig 4. Inhibitory effect of oligomycin and its A-isomer on SRC for T98G cells.
After incubation of T98G cells (1.5×10⁶ cells/mL) for 3–5 min, 1 μg/mL oligomycin from Sigma-Aldrich (Oligo), 1 μg/mL oligomycin from Cayman Chemical (Oligo*), 1 μg/mL oligomycin A (Oligo A) or 0.5 μL DMSO were added, followed by sequential additions of CCCP (2 μM each). A: SRC values for suspended T98G cells in the absence and presence of oligomycin or its A-isomer. **Statistically significant difference from the result for DMSO, P<0.01. B: Values of CCCP concentrations required to achieve maximal OCR in T98G cells in the presence and absence of oligomycin or its A-isomer.
Fig 5
Fig 5. Inhibitory effect of citreoviridin on CCCP-induced maximal oxygen consumption in T98G cells.
A and B: Representative OCR traces in suspended T98G cells (1.5×10⁶ cells/mL). Where indicated by the arrows, citreoviridin (Citre; 1 μM, 4 μM and 20 μM) and 1 μg/mL oligomycin (Oligo) were added. C: Representative traces of OCR in T98G cells. Where indicated by the arrows, 1 μL DMSO or 20 μM citreoviridin were added followed by sequential additions of CCCP (1 μM each). D: SRC values for T98G cells in the presence and absence of 20 μM citreoviridin. **Statistically significant difference from the results for DMSO, P<0.01.
Fig 6
Fig 6. Effect of bongkrekic acid (BKA) and carboxyatractyloside (CAT) on oxygen consumption due to oxidative phosphorylation in intact and digitonin-permeabilized T98G cells.
A and C: Representative OCR traces in intact T98G cells. Suspended T98G cells (1.5×10⁶ cells/mL) were incubated in the medium for intact cells and, where indicated by the arrows, 25 μM BKA, 25 μM CAT and 1 μg/mL oligomycin (Oligo) were added. B and D: Representative traces of OCR in digitonin-permeabilized T98G cells. A 125-μL aliquot of T98G (3×10⁶ cells) cell suspension was added to the final volume of 2 mL of reaction medium (125 mM sucrose, 65 mM KCl, 10 mM HEPES-K+ pH 7.2, 2 mM K2HPO4, 1 mM MgCl2, 1 mM EGTA and a cocktail of the respiratory substrates α-ketoglutarate, malate, glutamate and pyruvate, 5 mM of each) containing 30 μM digitonin. Where indicated by the arrows, 800 μM ADP, 2.5 μM BKA, 2.5 μM CAT and 1 μg/mL oligomycin (Oligo) were added.
Fig 7
Fig 7. Effect of oligomycin on 2,4-dinitrophenol (DNP)-induced maximal oxygen consumption in intact human glioma cells.
A and B: Representative oxygen consumption rate (OCR) traces of suspended T98G cells (1.5×10⁶/mL). Where indicated by the arrows, 1 μg/mL oligomycin (Oligo) and DMSO (0.5 μL of each) were added, followed by sequential additions of CCCP (1 μM each) (A) or DNP (50 μM each) (B). C and E: Maximal OCR (OCRmax) values for T98G (C) and U-87MG cells (E) determined by sequential additions of CCCP or DNP, in the presence and absence of oligomycin. Data are expressed as percentage of OCRmax obtained with CCCP titration in DMSO-treated cells (% of DMSO + CCCP). **Statistically significant difference from the results for the “DMSO + CCCP” group, P<0.01. D and F: SRC values for T98G (D) and U-87MG cells (F) determined by sequential additions of CCCP or DNP, in the presence and absence of oligomycin. Data are expressed as percentage of SRC obtained with CCCP titration in DMSO-treated cells (% of DMSO + CCCP). **Statistically significant difference from the results for the “DMSO + CCCP” group, P<0.01.
Fig 8
Fig 8. Pyruvate supplementation does not prevent the inhibitory effect of oligomycin on SRC determined for T98G cells.
T98G cells (1.5×10⁶ cells/mL) were incubated in the presence or absence of oligomycin (Oligo; 1 μg/mL). Where indicated, the incubation medium was supplemented with 10 mM sodium pyruvate (+ Pyruvate). Maximal OCR for suspenced T98G cells was determined by CCCP titration and SRC was calculated. **Statistically significant difference from the results for DMSO, P<0.01.
Fig 9
Fig 9. Effect of oligomycin on CCCP-induced maximal oxygen consumption in digitonin-permeabilized human glioma cells.
A 125-μL aliquot of either T98G (3×10⁶ cells) or U-87MG (4×10⁶ cells) cell suspension was added to the final volume of 2 mL of reaction medium (125 mM sucrose, 65 mM KCl, 10 mM HEPES-K+ pH 7.2, 2 mM K2HPO4, 1 mM MgCl2, 1 mM EGTA and a cocktail of the respiratory substrates α-ketoglutarate, malate, glutamate and pyruvate, 5 mM of each) containing 30 μM digitonin. A and C: Representative OCR traces in suspended T98G cells. B and D: Representative OCR traces in suspended U-87MG cells. Where indicated by the arrows, 1 μg/mL oligomycin (Oligo) and 0.5 μL DMSO were added followed by sequential additions of CCCP (0.125 μM each). At the beginning of the measurements, it took 3–5 min to obtain a stable basal OCR. E: Values of CCCP-induced maximal OCR for T98G and U-87MG cells in the presence and absence of oligomycin. *Statistically significant difference from the results for the respective control (DMSO), P<0.05. F: Values of CCCP concentrations required for maximal OCR in T98G and U-87MG cells in the presence and absence of oligomycin.
Fig 10
Fig 10. Oligomycin exerts only a minor inhibitory effect on CCCP-induced maximal oxygen consumption in isolated brain mitochondria.
Isolated rat brain mitochondria (0.3 mg/mL) were incubated at 37°C in a 2 mL chamber containing 125 mM sucrose, 65 mM KCl, 10 mM HEPES-K+ pH 7.2, 2 mM K2HPO4, 1 mM MgCl2, and 1 mM EGTA. A: Representative traces of OCR in isolated brain mitochondria. Where indicated by the arrows, 1 μg/mL oligomycin (Oligo) or 0.5 μL DMSO were added, followed by sequential additions of CCCP (0.05 μM each). At the beginning of the measurements, it took 3–5 min to obtain a stable basal OCR. B: Values of CCCP-induced maximal OCR for brain mitochondria in the presence and absence of oligomycin. **Statistically significant difference from the results for DMSO, P<0.01.

References

    1. Brand MD, Nicholls DG. Assessing mitochondrial dysfunction in cells. Biochem J. 2011; 435: 297–312. 10.1042/BJ20110162 - DOI - PMC - PubMed
    1. Pesta D, Gnaiger E. High-resolution respirometry: OXPHOS protocols for human cells and permeabilized fibers from small biopsies of human muscle. Methods Mol Biol. 2012; 810: 25–58. 10.1007/978-1-61779-382-0_3 - DOI - PubMed
    1. DeBerardinis RJ, Lum JJ, Hatzivassiliou G, Thompson CB. The biology of cancer: metabolic reprogramming fuels cell growth and proliferation. Cell Metab. 2008; 7: 11–20. 10.1016/j.cmet.2007.10.002 - DOI - PubMed
    1. Vander Heiden MG, Cantley LC, Thompson CB. Understanding the Warburg effect: the metabolic requirements of cell proliferation. Science. 2009; 324: 1029–1033. 10.1126/science.1160809 - DOI - PMC - PubMed
    1. Ward PS, Thompson CB. Metabolic reprogramming: a cancer hallmark even Warburg did not anticipate. Cancer Cell. 2012; 21: 297–308. 10.1016/j.ccr.2012.02.014 - DOI - PMC - PubMed

Publication types

MeSH terms