. 2016 Apr;13(4):366-70.
doi: 10.1038/nmeth.3799. Epub 2016 Mar 7.

Tissue-specific regulatory circuits reveal variable modular perturbations across complex diseases

Affiliations

Tissue-specific regulatory circuits reveal variable modular perturbations across complex diseases

Daniel Marbach et al. Nat Methods. 2016 Apr.

Abstract

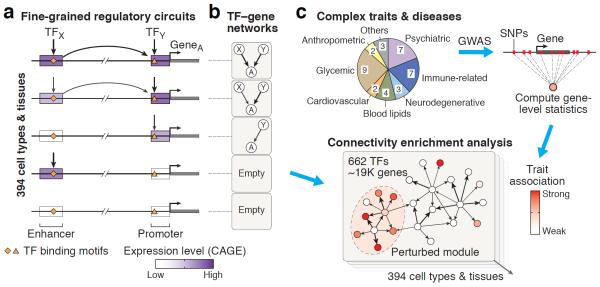
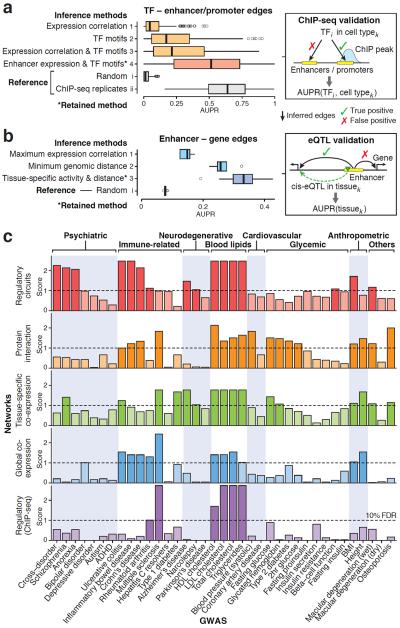
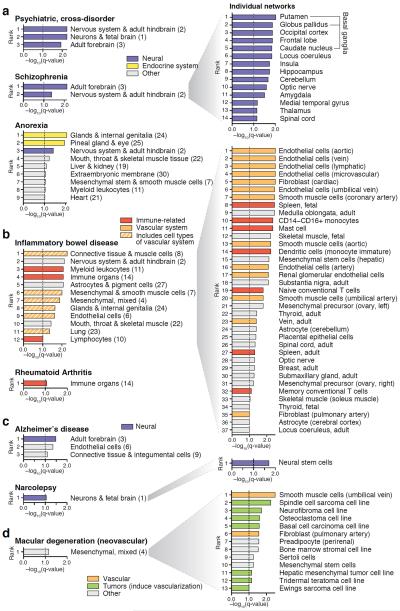
Mapping perturbed molecular circuits that underlie complex diseases remains a great challenge. We developed a comprehensive resource of 394 cell type- and tissue-specific gene regulatory networks for human, each specifying the genome-wide connectivity among transcription factors, enhancers, promoters and genes. Integration with 37 genome-wide association studies (GWASs) showed that disease-associated genetic variants--including variants that do not reach genome-wide significance--often perturb regulatory modules that are highly specific to disease-relevant cell types or tissues. Our resource opens the door to systematic analysis of regulatory programs across hundreds of human cell types and tissues (http://regulatorycircuits.org).


Figures

Figure 1
Figure 1. Inference of regulatory circuits and connectivity between trait-associated genes
(a) The resource of 394 cell type and tissue-specific regulatory circuits is based on expression profiles of CAGE-defined enhancers and promoters from the FANTOM5 project,. Weighted, tissue-specific links between TFs and regulatory elements (enhancers and promoters) are inferred using TF binding motifs and tissue-specific expression of target elements. Links between regulatory elements and target genes are inferred based on genomic distance and joint expression in the given tissue. Different circuit configurations are shown schematically for five tissues. For clarity only one enhancer and promoter are shown, but genes typically have multiple tissue-specific enhancers and promoters. (b) In order to summarize which TFs regulate which genes, we also define coarse-grained TF–gene networks that encapsulate the fine-grained circuitry of enhancers and promoters. (c) We systematically assess the interconnectivity of genes that are perturbed by trait-associated variants within our networks for a large panel of 37 GWASs. Our pipeline first integrates GWAS summary statistics at the level of genes using Pascal, a tool that accurately corrects for confounders such as linkage disequilibrium, and then evaluates whether top ranked genes tend to cluster in network modules based on a random-walk graph kernel (connectivity enrichment analysis, Methods and Supplementary Figs. 27–30). Importantly, this approach does not use a cutoff for the GWAS p-values and thus also assesses the contribution of weakly associated variants. We apply this pipeline to pinpoint cell type or tissue-specific regulatory networks where modules are perturbed for different traits and diseases.
Figure 2
Figure 2. Assessment of regulatory circuits
(a) Evaluation of different approaches to infer edges between TFs and regulatory elements (enhancers and promoters): (1) standard network inference based on expression correlation between TFs and regulatory elements across samples; (2) presence of TF motifs within regulatory elements; (3) presence of TF motifs, weighted by expression correlation; and (4) presence of TF motifs, weighted by target element expression in the given cell type (the retained method to reconstruct regulatory circuits). For each TF and cell type where ChIP-seq data was available (159 samples, including 59 TFs and five cell lines), the area under the precision-recall curve (AUPR) was computed. As reference, AUPR values were also computed for (i) random data and (ii) replicates of ChIP-seq experiments. Boxplots show the distribution of AUPR values for each method. The retained method (*) achieves a median AUPR of 0.51, which is significantly better than alternative methods (p < 10−15, one-sided Wilcoxon rank-sum test) and the performance is close to that of of ChIP-seq replicates (median AUPR=0.64). (b) Assessment of different approaches to link enhancers to target genes: (1) maximum expression correlation across tissues (assign enhancer to most strongly correlated gene within 500kb); (2) minimum genomic distance (assign enhancer to closest gene); and (3) joint tissue-specific activity (defined as geometric mean of enhancer and gene expression) weighted by genomic distance (the retained method to construct regulatory circuits). AUPR was evaluated for each method as well as random predictions in 13 tissues where eQTL data were available. The retained method (*) has a median AUPR of 0.33, which is significantly better than alternative methods (p < 0.05, one-sided Wilcoxon rank-sum test). Of note, AUPR values are only comparable within each panel, not across panels (a) and (b) because the underlying gold standards are different (Methods). (c) Evaluation of whether trait-associated genes tend to cluster within modules for different types of networks and GWAS traits. Five types of networks are compared: (1) cell type and tissue-specific regulatory networks (the 32 high-level networks defined in Supplementary Fig. 14), (2) four protein-protein interaction networks, (3) 35 tissue-specific co-expression networks, (4) a global co-expression network inferred from the FANTOM5 data, and (5) a global regulatory network based on ChIP-seq (Methods). In addition, tissue-specific regulatory networks based on DNaseI footprints were assessed, but did not show any significant enrichment. The plot summarizes whether trait-associated genes are more densely interconnected than expected (maximum connectivity enrichment score) for each network type (row) and trait (column). The scores correspond to the negative log of the q-values. (False discovery rate (FDR) correction was performed separately for each network type to allow for a fair comparison). Rows are ordered based on the overall enrichment (Supplementary Fig. 31a): tissue-specific regulatory networks show the strongest connectivity enrichment. Some traits did not show significant connectivity enrichment, which may be either because the signal was too weak, the relevant tissues were not profiled (e.g., our library does not include pancreatic islet cells relevant for type 2 diabetes), or other types of networks (e.g., post-transcriptional) may be more relevant for these traits.
Figure 3
Figure 3. Network connectivity enrichment reveals disease-relevant cell types and tissues
Connectivity enrichment scores across the 32 high-level networks (left; numbers in parenthesis correspond to cluster indexes in Supplementary Fig. 14) and corresponding individual networks (right) for selected GWAS traits. (Similar results were obtained for the remaining traits, see main text and Supplementary Figs. 32–43). Networks of trait-relevant cell types and tissues consistently rank at the top, i.e., show strongest clustering of perturbed genes. All networks with enrichment scores > 1.0 are shown. (a) Psychiatric disorders show strongest clustering of associated genes in regulatory networks of neural tissues, with the exception of anorexia nervosa, where we further observe strong signal for tissues of the endocrine system (hormonal glands, Supplementary Fig. 14c). For schizophrenia, connectivity enrichment is shown both for the high-level networks (left) and the corresponding individual networks (right), illustrating how perturbed regulatory modules pinpoint specific, disease-relevant brain structures. (b) Inflammatory bowel disease (IBD) and rheumatoid arthritis are examples of immune disorders, which display connectivity enrichment in immune-related networks. IBD also shows enrichment in other high-level networks, most of which include vascular cells that are involved in the inflammatory response and are driving the signal, as shown to the right. (c) Alzheimer's disease and narcolepsy, two neurodegenerative disorders, show strongest network connectivity enrichment in adult brain and neurons, respectively. (d) Age-related macular degeneration (AMD) of neovascular type shows the strongest connectivity enrichment in regulatory networks of vascular smooth muscle cells followed by diverse tumors, which induce vascularization to achieve growth. As a control, we further confirmed that the dry form of AMD, which does not involve neovascularization, does not show any connectivity enrichment in these networks.

References

    1. Marstrand TT, Storey JD. Identifying and mapping cell-type-specific chromatin programming of gene expression. Proc. Natl. Acad. Sci. 2014;111:E645–E654. - PMC - PubMed
    1. Pers TH, et al. Biological interpretation of genome-wide association studies using predicted gene functions. Nat. Commun. 2015;6:5890. - PMC - PubMed
    1. Roy S, et al. A predictive modeling approach for cell line-specific long-range regulatory interactions. Nucleic Acids Res. 2015;43:8694–8712. - PMC - PubMed
    1. Ward LD, Kellis M. Interpreting noncoding genetic variation in complex traits and human disease. Nat. Biotechnol. 2012;30:1095–1106. - PMC - PubMed
    1. Parker SCJ, et al. Chromatin stretch enhancer states drive cell-specific gene regulation and harbor human disease risk variants. Proc. Natl. Acad. Sci. 2013;110:17921–17926. - PMC - PubMed

Publication types

Substances