

Toxic gain of function from mutant FUS protein is crucial to trigger cell autonomous motor neuron loss
- PMID: 26951610
- PMCID: PMC4868956
- DOI: 10.15252/embj.201592559
Toxic gain of function from mutant FUS protein is crucial to trigger cell autonomous motor neuron loss
Abstract
FUS is an RNA-binding protein involved in amyotrophic lateral sclerosis (ALS) and frontotemporal dementia (FTD). Cytoplasmic FUS-containing aggregates are often associated with concomitant loss of nuclear FUS Whether loss of nuclear FUS function, gain of a cytoplasmic function, or a combination of both lead to neurodegeneration remains elusive. To address this question, we generated knockin mice expressing mislocalized cytoplasmic FUS and complete FUS knockout mice. Both mouse models display similar perinatal lethality with respiratory insufficiency, reduced body weight and length, and largely similar alterations in gene expression and mRNA splicing patterns, indicating that mislocalized FUS results in loss of its normal function. However, FUS knockin mice, but not FUS knockout mice, display reduced motor neuron numbers at birth, associated with enhanced motor neuron apoptosis, which can be rescued by cell-specific CRE-mediated expression of wild-type FUS within motor neurons. Together, our findings indicate that cytoplasmic FUS mislocalization not only leads to nuclear loss of function, but also triggers motor neuron death through a toxic gain of function within motor neurons.
Keywords: FUS; PY‐NLS; amyotrophic lateral sclerosis; frontotemporal dementia; motor neuron degeneration.
© 2016 The Authors. Published under the terms of the CC BY NC ND 4.0 license.
Figures

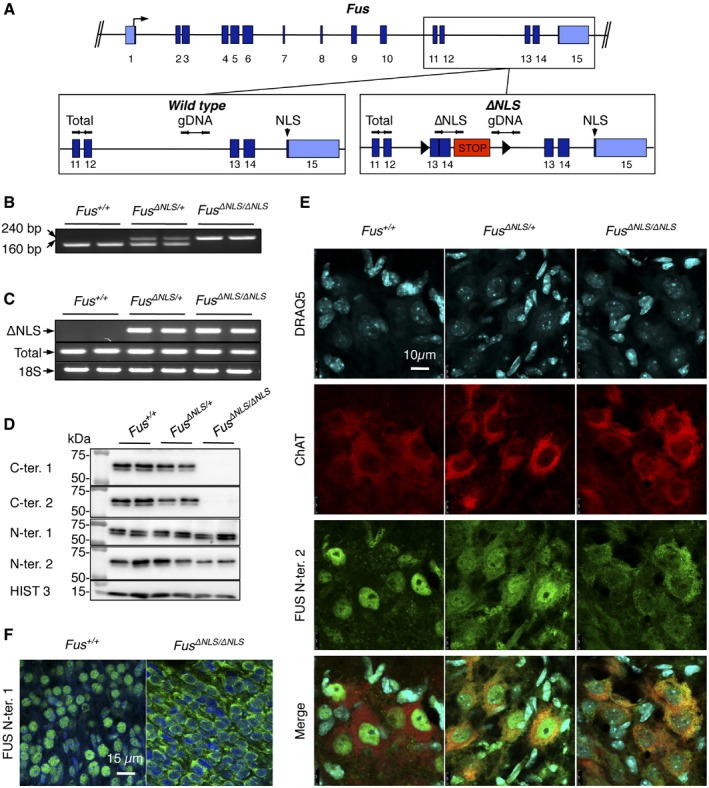
Schematic representation of the Fus gene locus (upper panel). Lower panels depict exons 11–15 in the wild‐type allele (left) and ∆
NLS allele (right) with localization ofPCR primers used for genotyping (gDNA , used in B) and forRT –PCR (Total and ∆NLS , used in C). Arrow: translational start site.STOP cassettes are indicated in red; loxP sites as black triangles; coding regions are in dark blue andUTR s in light blue. Location of the region encoding the nuclear localization signal (NLS ) is indicated in exon 15.Representative
PCR genotyping results from 2 Fus +/+, 2 Fus ΔNLS /+, and 2 Fus ΔNLS /ΔNLS knockin mice using primers designed around the distal loxP site of the Fus ΔNLS allele and shown asgDNA in (A). The expected size of thePCR product of the ∆NLS allele is 240 bp; the size of wild‐type allele is 160 bp.RT –PCR analysis of brain from 2 Fus +/+, 2 Fus ΔNLS /+, and 2 Fus ΔNLS /ΔNLS knockin P0 mice using primers located in theSTOP cassette, and thus specific to the ∆NLS mRNA (∆NLS , upper panel), or primers located in exon 11, that is, upstream of the floxedcDNA insertion, and thus amplifying total Fus‐derivedmRNA (Total, middle panel).PCR amplification of 18SrRNA is shown as a standard gene (lower panel).Immunoblot analysis of
FUS protein in cerebral cortex of 2 Fus +/+, 2 Fus ΔNLS /+, and 2 Fus ΔNLS /ΔNLS knockin mice using a combination of two different antibodies targeting either the C‐terminal (C‐ter. 1 and C‐ter. 2)NLS , the N‐terminal part (N‐ter. 1), or an internal part (N‐ter. 2) ofFUS . Molecular weight markers are shown on the left, and apparentMW is indicated.Double immunostaining for the motor neuronal marker Ch
AT and Fus (N‐terminal part) in the ventral horn of spinal cord.Double immunostaining for nuclei (
DAPI , blue) and Fus (N‐terminal part) in the cerebral cortex.

RT –PCR analysis of spinal cord and gastrocnemius muscle from 2 Fus +/+, 2 Fus ΔNLS /+, and 2 Fus ΔNLS /ΔNLS P0 mice using primers located in theSTOP cassette, and thus specific to the Fus ∆NLS mRNA (∆NLS , upper panel), or primers located in exon 11 and 12, that is, upstream of the floxedcDNA insertion, and thus amplifying total FusmRNA (Total, lower panel).Immunoblot analysis of
FUS protein in spinal cord and gastrocnemius of 2 Fus +/+, 2 Fus ΔNLS /+, and 2 Fus ΔNLS /ΔNLS mice using two different antibodies targeting the C‐terminal (C‐ter. 1 and C‐ter. 2)NLS or antibodies targeting the N‐terminal (N‐ter. 1) and internal parts (N‐ter. 2) ofFUS .Representative confocal images for fluorescence immunocytochemical localization of
FUS protein in mouse embryonic fibroblasts (MEFs).

- A
Photographs of Fus +/+ and Fus Δ
NLS /ΔNLS pups immediately after birth (P0 animals). - B, C
Fus Δ
NLS /ΔNLS mice showed significantly reduced body weight (B) and length (C). Weight and length values normalized to wild type (Fus +/+) are presented (mean ±SEM ). N = 11 Fus +/+, N = 26 Fus ΔNLS /+ and N = 14 Fus ΔNLS /ΔNLS ; *P < 0.05, **P < 0.01 versus Fus +/+, # P < 0.05 versus Fus ∆NLS /+; one‐wayANOVA followed by Tukey's post hoc test. - D
Representative hematoxylin and eosin stainings of lungs of Fus +/+ and Fus Δ
NLS /ΔNLS at birth.
- A
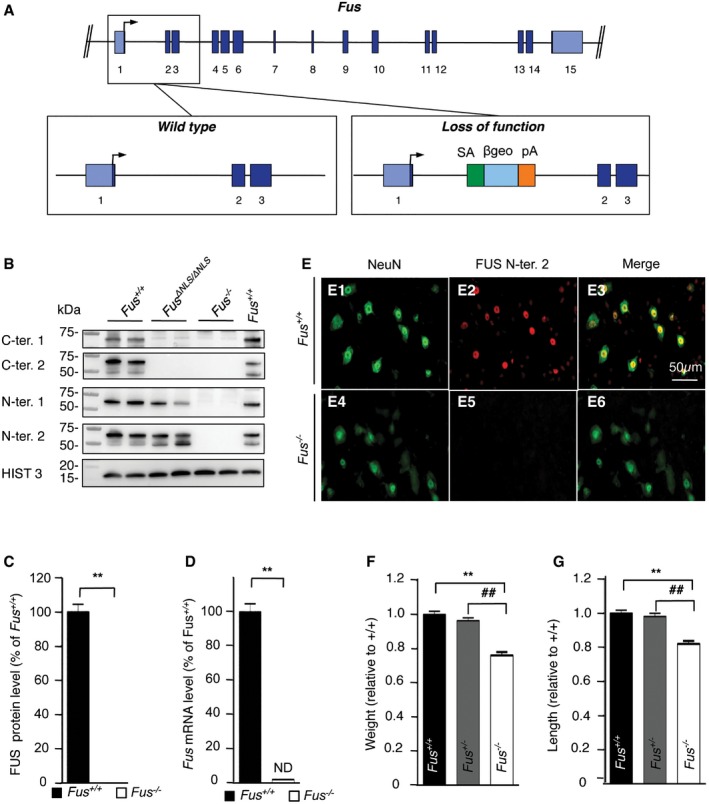
Schematic representation of the Fus gene locus (upper panel). Lower panels depict exons 1–3 in the wild‐type allele (left) and loss‐of‐function allele (right). Arrow: translational start site;
SA : splice acceptor; βgeo: β‐galactosidase/neomycin phosphotransferase fusion gene;pA : polyA. - B
Representative immunoblot for
FUS on protein extracts of E18.5 brain. Histone 3 is used as a loading control. - C
Quantification of
FUS protein levels from immunoblots. - D
Quantitative real‐time
PCR for Fus transcript in Fus +/+ and Fus −/− mice. ND: not detected. - E
Immunostaining for the neuronal marker NeuN and
FUS on the spinal cord ventral horn of E18.5 Fus +/+ and Fus −/− mice. - F, G
Body weight (F) and length (G) of Fus +/+, Fus +/−, and Fus −/− pups at birth; N = 14 Fus +/+, N = 36 Fus +/−, and N = 13 Fus −/− for body weight; N = 6 per genotype for body length.

Quantification of Fus
RNA levels by strand‐specificRNA sequencing in brains from Fus ΔNLS /ΔNLS (blue bars), Fus −/− (red bars), and control littermates (Fus +/+, black bars).RNA levels were determined by fragments per kilobase of transcript per million mapped reads (FPKM ) value.Unsupervised hierarchical cluster analysis using all
RNA s expressed in brains of Fus ΔNLS /ΔNLS mice (KI ‐1 toKI ‐5) and their control littermates (Ctrl‐1 to Ctrl‐4).Unsupervised hierarchical cluster analysis using all
RNA s expressed in brains of Fus −/− mice (KO ‐1 toKO ‐5) and their control littermates (Ctrl‐1 to Ctrl‐5).

RNA ‐seq reads from brain of homozygous knockin (Fus ΔNLS /ΔNLS , upper panel), homozygous knockout (Fus −/−, middle panel), and control (Fus +/+, lower panel) mice showing the absence of exon 15 (red arrow) in FusmRNA in Fus ΔNLS /ΔNLS mice, while the entire Fus transcript is absent in Fus −/− mice (green arrows).Heat map with hierarchical clustering of
RNA ‐seq data from biological replicates of Fus ΔNLS /ΔNLS (N = 5) and control littermates (N = 4), showing genes differentially regulated between both genotypes among which 237 are upregulated and 549 are downregulated in Fus ΔNLS /ΔNLS animals as defined by P < 0.05 adjusted for multiple testing.Heat map with hierarchical clustering of
RNA ‐seq data from biological replicates of Fus −/− (N = 5) and control littermates (N = 5), showing genes differentially regulated between both genotypes, among which 669 are upregulated and 889 are downregulated in Fus −/− animals as defined by P < 0.05 adjusted for multiple testing.Venn diagram showing the number of overlapping genes misregulated in Fus Δ
NLS /ΔNLS (blue circle) and Fus −/− (red circle) brains with 353 genes similarly downregulated or upregulated upon cytoplasmic mislocalization or complete loss ofFUS .Normalized expression (based on
FPKM fromRNA ‐seq) of genes identified byRNA ‐seq to be significantly downregulated (Ahi1, Kcnip1, Nefm, Nefl, Tuba4a, Dmpk, Rad9b, Stac3, Hist1h2bc, Hist1h1c) or upregulated (Fam193b, Pmm2, Bphl, Taf15) in both Fus ΔNLS /ΔNLS and Fus −/− compared to their control. Error bars representSEM in 4‐5 biological replicates. **P < 0.01, two‐tailed student's t‐test.Normalized expression (based on
FPKM fromRNA ‐seq) of genes identified byRNA ‐seq to be uniquely changed in Fus ΔNLS /ΔNLS mice (Trove2, Uhmk1, Ssh3, Vtn, Snrpb, Ephb3). Error bars representSEM in 4–5 biological replicates. *P < 0.05, **P < 0.01, two‐tailed Student's t‐test.

Schematic representation of the
RASL ‐seq strategy to measure ratios of alternative splicing isoforms from thousands of selected splicing events by high‐throughput sequencing.Unsupervised hierarchical cluster analysis using all splicing events sequenced in brains of Fus Δ
NLS /ΔNLS mice (KI ‐1 toKI ‐4), Fus ΔNLS /+ (HET ‐1 toHET ‐4), and their control littermates (Ctrl‐1 to Ctrl‐4).Unsupervised hierarchical cluster analysis using all splicing events sequenced in brains of Fus −/− mice (
KO ‐1 toKO ‐5) and their control littermates (Ctrl‐1 to Ctrl‐5).Venn diagram showing the number of overlapping splicing events that are misregulated in Fus Δ
NLS /ΔNLS (blue circle) and Fus −/− (red circle) brains with 75 exons similarly altered upon cytoplasmic mislocalization or complete loss ofFUS .Heat map using the fold changes of the 75 splicing events commonly regulated in Fus Δ
NLS /ΔNLS and Fus −/− mice showing that 100% of the events were differentially included or excluded in the same direction.Semi‐quantitative
RT –PCR analyses of selected targets shown in Fig 5C with alternatively spliced exons depicted in orange boxes with their flanking constitutive exons in blue boxes.

Heat map with hierarchical clustering of
RASL ‐seq data from biological replicates of Fus ΔNLS /ΔNLS (N = 4) and control littermates (N = 4), showing 173 alternative splicing alterations associated with expression of cytoplasmicFUS in knockin animals.Heat map with hierarchical clustering of
RASL ‐seq data from biological replicates of Fus −/− (N = 5) and control littermates (N = 5), showing 252 alternative splicing alterations associated with loss ofFUS in knockout animals.Semi‐quantitative
RT –PCR analyses of selected targets. Left panels show representative acrylamide gel pictures ofRT –PCR products. Quantification of splicing changes from at least three biological replicates of Fus ΔNLS /ΔNLS (blue bars) and Fus −/− (red bars) compared to their control littermates (Fus +/+, black bars) by semi‐quantitativeRT –PCR (middle panel) andRASL ‐seq (right panel) are shown. Error bars representSEM . *P < 0.05, **P < 0.01, two‐tailed Student's t‐test.

- A
Representative light microscopy images of spinal cord sections of Fus +/+, Fus Δ
NLS /+, Fus ΔNLS /ΔNLS , and Fus −/− mice at birth stained with cresyl violet (Nissl, A1, A3 A5, A7), or anti‐choline acetyltransferase (ChAT , A2, A4 A6, A8). - B, C
Quantification of Ch
AT + motor neurons (B) and Nissl+ motor neurons (defined as Nissl‐positive cells with a soma area > 80 µm2) (C) per spinal cord ventral horn in Fus ΔNLS /ΔNLS mice (mean ±SEM ). For Nissl+ N = 8 Fus +/+, N = 5 Fus ΔNLS /+, N = 7 Fus ΔNLS /ΔNLS , and for ChAT + N = 7 per genotype, **P < 0.01 versus Fus +/+, ## P < 0.01 versus Fus ∆NLS /+; one‐wayANOVA followed by Tukey's post hoc test. - D, E
Quantification of Ch
AT + (D) and Nissl+ (E) motor neurons per spinal cord ventral horn in Fus −/− mice (mean ±SEM ). N = 6 per genotype, no significant differences were found, by Student's unpaired t‐test.

- A
Representative images of
TUNEL assay in spinal cord of Fus ΔNLS /ΔNLS mice (A4‐A6) and Fus +/+ mice (A1‐A3). - B
Quantification of the total number of
TUNEL andDRAQ 5 (blue) double‐positive cells in Fus ΔNLS /ΔNLS and Fus +/+ per spinal cord section. Mean ±SEM , N = 3 per genotype, *P < 0.05, by Student's unpaired t‐test. - C, D
Immunofluorescence microscopy of spinal cord of Fus +/+ (C) and Fus Δ
NLS /ΔNLS (D) mice showing active caspase‐3 (green), ChAT (red), andDNA (cyan,DRAQ 5). - E
Quantification of caspase‐3 (Cas3)/Ch
AT /DRAQ 5 triple‐positive cells in Fus ΔNLS /ΔNLS mice. Mean ±SEM , N = 7 per genotype, **P < 0.01, by Student's unpaired t‐test.

Representative images of
SMN (green) immunofluorescence in spinal cord. Nuclear gems, corresponding toSMN ‐immunoreactive foci in nuclei, are marked by arrows.HDAC 1 immunoreactivity in spinal cord sections of Fus +/+ and Fus ΔNLS /ΔNLS mice. Arrows point to HDAC1‐immunoreactive nuclear foci.Representative images of immunofluorescence staining of motor neurons, labeled with Ch
AT (red) andHDAC 1 (green). Examples ofHDAC 1 immunoreactive foci in motor neurons are indicated by arrows.Representative images of immunofluorescence staining of motor neurons labeled with Ch
AT (red) and phosphorylatedeIF 2α (green), a general translational stress response marker.DRAQ 5 (cyan) was used to label nuclei.

Representative images of ubiquitin staining (green) in the ventral spinal cord.
Representative images of immunofluorescence staining of neurofilament heavy chain (green) and poly‐ubiquitin (lysine 48; red). The neurofilament immunostaining shows normal filamentous staining, and the poly‐ubiquitin staining is very weak and shows no positive aggregates.
Representative images of immunofluorescence staining of neurons labeled with NeuN (green) and
TIAR (red), a stress granule marker.

- A
Double immunolabeling of spinal cord neurons with Ch
AT (red) and N‐terminalFUS antibody (green). Nuclei were visualized withDRAQ 5 (blue). Cellular localization ofFUS was analyzed in the ventral spinal cord of Fus +/+/ChAT ‐CRE (A1‐A4), Fus ΔNLS /ΔNLS /− (A5‐A8), and Fus ΔNLS /ΔNLS /ChAT ‐CRE (A9‐A12).FUS was completely nuclear in ChAT + neurons of Fus +/+/ChAT ‐CRE , while cytoplasmic in Fus ΔNLS /ΔNLS /−. In the ventral horn of Fus ΔNLS /ΔNLS /ChAT ‐CRE mice, ChAT + neurons (motor neurons, e.g., within the dashed square) displayed nuclearFUS immunoreactivity, while ChAT ‐negative cells retained cytoplasmicFUS immunoreactivity (arrows). - B
Representative light microscopy images of spinal cord sections of Fus +/+/Ch
AT ‐CRE (B1, B4), Fus ΔNLS /ΔNLS /− (B2, B5), and Fus ΔNLS /ΔNLS /ChAT ‐CRE (B3, B6) mice at birth stained with cresyl violet (Nissl, B1‐B3) or anti‐choline acetyltransferase (ChAT , B4‐B6). - C, D
Quantification of Nissl+ (C) and Ch
AT + (D) motor neurons per spinal cord ventral horn. Mean ±SEM , N = 9 Fus +/+/ChAT ‐CRE , N = 8 Fus ΔNLS /ΔNLS /−, and N = 4 Fus ΔNLS /ΔNLS /ChAT ‐CRE for Nissl+, and N = 11 Fus +/+/ChAT ‐CRE , N = 7 Fus ΔNLS /ΔNLS /−, and N = 8 Fus ΔNLS /ΔNLS /ChAT ‐CRE for ChAT +; (**) P < 0.01 versus Fus +/+, ## P < 0.01 versus Fus ∆NLS /+; (ns) non‐significant; one‐wayANOVA followed by Tukey's post hoc test. - E
Total numbers of caspase‐3 (Cas3)/Ch
AT /DAPI triple‐positive cells in Fus +/+/ChAT ‐CRE , Fus ΔNLS /ΔNLS /−, and Fus ΔNLS /ΔNLS /ChAT ‐CRE mice. N = 9 Fus +/+/ChAT ‐CRE , N = 7 Fus ΔNLS /ΔNLS /−, and N = 8 Fus ΔNLS /ΔNLS /ChAT ‐CRE ; **P < 0.01 versus Fus +/+, # P < 0.05 versus Fus ∆NLS /+; (ns) non‐significant; one‐wayANOVA followed by Tukey's post hoc test.
Comment in
-
FUScinating insights into motor neuron degeneration.EMBO J. 2016 May 17;35(10):1015-7. doi: 10.15252/embj.201694397. Epub 2016 Apr 6. EMBO J. 2016. PMID: 27053723 Free PMC article.
References
-
- Alami NH, Smith RB, Carrasco MA, Williams LA, Winborn CS, Han SS, Kiskinis E, Winborn B, Freibaum BD, Kanagaraj A, Clare AJ, Badders NM, Bilican B, Chaum E, Chandran S, Shaw CE, Eggan KC, Maniatis T, Taylor JP (2014) Axonal transport of TDP‐43 mRNA granules is impaired by ALS‐causing mutations. Neuron 81: 536–543 - PMC - PubMed
-
- Arnold ES, Ling SC, Huelga SC, Lagier‐Tourenne C, Polymenidou M, Ditsworth D, Kordasiewicz HB, McAlonis‐Downes M, Platoshyn O, Parone PA, Da Cruz S, Clutario KM, Swing D, Tessarollo L, Marsala M, Shaw CE, Yeo GW, Cleveland DW (2013) ALS‐linked TDP‐43 mutations produce aberrant RNA splicing and adult‐onset motor neuron disease without aggregation or loss of nuclear TDP‐43. Proc Natl Acad Sci USA 110: E736–E745 - PMC - PubMed
Publication types
MeSH terms
Substances
LinkOut - more resources
Full Text Sources
Other Literature Sources
Molecular Biology Databases
Miscellaneous
