Lactation opposes pappalysin-1-driven pregnancy-associated breast cancer
- PMID: 26951623
- PMCID: PMC4818749
- DOI: 10.15252/emmm.201606273
Lactation opposes pappalysin-1-driven pregnancy-associated breast cancer
Abstract
Pregnancy is associated with a transient increase in risk for breast cancer. However, the mechanism underlying pregnancy-associated breast cancer (PABC) is poorly understood. Here, we identify the protease pappalysin-1 (PAPP-A) as a pregnancy-dependent oncogene. Transgenic expression of PAPP-A in the mouse mammary gland during pregnancy and involution promotes the deposition of collagen. We demonstrate that collagen facilitates the proteolysis of IGFBP-4 and IGFBP-5 by PAPP-A, resulting in increased proliferative signaling during gestation and a delayed involution. However, while studying the effect of lactation, we found that although PAPP-A transgenic mice lactating for an extended period of time do not develop mammary tumors, those that lactate for a short period develop mammary tumors characterized by a tumor-associated collagen signature (TACS-3). Mechanistically, we found that the protective effect of lactation is associated with the expression of inhibitors of PAPP-A, STC1, and STC2. Collectively, these results identify PAPP-A as a pregnancy-dependent oncogene while also showing that extended lactation is protective against PAPP-A-mediated carcinogenesis. Our results offer the first mechanism that explains the link between breast cancer, pregnancy, and breastfeeding.
Keywords: IGF‐binding protein 4 and 5; breastfeeding; insulin‐like growth (IGF) factor signaling; involution.
© 2016 The Authors. Published under the terms of the CC BY 4.0 license.
Figures

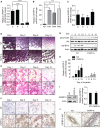
- A
Endogenous mouse PAPP‐A transcript levels in non‐transgenic (NT) mouse mammary glands from virgin (V), pregnancy (P), lactation (L), involution (I) time point (n = 3 mice per group, triplicate experiments, mean ± SD). One‐way ANOVA with Tukey's post hoc test: ****P < 0.0001.
- B
Human PAPP‐A transcript levels in NT versus three lines of PAPP‐A (PA) transgenic mice (n = 3 mice per group, triplicate experiments, mean ± SD). One‐way ANOVA with Tukey's post hoc test: **P(PA1) = 0.0016, **P(PA4) = 0.0067, ***P(PA6) = 0.0009. All subsequent experiments were conducted in PA1 mice.
- C
Transgenic human PAPP‐A transcript level in PAPP‐A transgenic mouse mammary glands from virgin (V), pregnancy (P), lactation (L), involution (I) time point (n = 3 mice per group, triplicate experiments, mean ± SD). One‐way ANOVA with Tukey's post hoc test: all P > 0.05.
- D
Whole‐mount analysis of involuting mammary glands (n = 12 mice; three mice per time point) at days 1, 3, 6, and 12 of involution in NT and PAPP‐A females, scale bar: 1 mm.
- E, F
(E) H&E sections and (F) immunohistochemistry for PAPP‐A of involuting mammary gland time points, scale bar: 100 μm.
- G
Immunoblot of mammary glands during involution in NT and PAPP‐A females.
- H
Quantification of IGFBP‐5 from immunoblot shown in (G). Each bar represents the mean ± SD of three independent experiments. Unpaired t‐test (two‐tailed) between NT and PAPP‐A at each time point: *P(day 12) = 0.0440.
- I
Immunoblot and quantification of IGFBP‐5 in mammary glands of 6‐week‐old virgin (n = 4 mice per group) NT versus PAPP‐A females. Unpaired t‐test (two‐tailed): P = 0.9720.
- J
IGFBP‐5 immunohistochemistry in mammary glands from 6‐week‐old virgin NT versus PAPP‐A females, scale bar: 50 μm.

Masson's trichrome stain on involuting mammary glands from NT and PAPP‐A mice. Blue: collagen. Scale bar: 100 μm.
Quantification of collagen by Masson's trichrome stain from (B) (n = 3 mice, each point represents the average of three determinations per mouse per time point). Each bar represents the mean ± SD. Unpaired t‐test (two‐tailed): *P(day 6) = 0.0408, *P(day 12) = 0.0440.
Newly synthesized collagen (thin fibers' green birefringence) by circularly polarized light microscopy on Picrosirius red‐stained slides of involuting mammary glands from NT and PAPP‐A mice, scale bar: 100 μm.
Quantification of newly synthesized collagen fibers by green birefringence from (D) (n = 3 mice, each point represents the average of three determinations per mouse per time point). Each bar represents the mean ± SD. Unpaired t‐test (two‐tailed): **P(day 6) = 0.0095, *P(day 12) = 0.0164.
Second harmonic generation (SHG) imaging of collagen on magnified ducts of histological sections shown in (A). Region of interest (ROI) of ducts acquired as negative images of nonspecific auto‐fluorescence, scale bar: 50 μm.
Graph of collagen intensity relative to the distance from duct edge of NT and PAPP‐A transgenic involuted mammary ducts as imaged by SHG in (E) at day 12 (n = 3 mice, 18 ducts total). Each bar represents the mean ± SD. Unpaired t‐test (two‐tailed) for the two groups: ****P = 6.013 × 10⁻⁸.

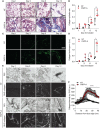
- A
PAPP‐A transcript levels in MCF‐7 control cells (ctl) and MCF‐7 cells stably expressing PAPP‐A (p‐a) (n = 3 independent experiments, mean ± SD). Unpaired t‐test (two‐tailed): ****P < 0.0001.
- B
Levels of secreted PAPP‐A in cell media as detected by ELISA (n = 3 independent experiments, mean ± SD). Unpaired t‐test (two‐tailed): ****P < 0.0001.
- C
Immunoblot of PAPP‐A in culture media from the cells as in (A) and (B).
- D
Immunoblot and quantification of rIGFBP‐5 following an incubation of 3 h in culture media from MCF7 cells (ctl or p‐a) in the absence or presence of collagen (n = 3 independent experiments, mean ± SD). Unpaired t‐test (two‐tailed): **P = 0.0050.
- E
Immunoblot and quantification of endogenous IGFBP‐5 levels of MCF7 ctl or p‐a cells, in the absence or presence of collagen (n = 3 independent experiments, mean ± SD). Unpaired t‐test (two‐tailed): **P = 0.0120.
- F
Tumor volumes of ctl and p‐a xenografts mixed with Matrigel and collagen (n = 4 mice, eight tumors total), ***P = 0.0008. For analysis details see Materials and Methods section.
- G
Immunoblot of representative xenografts at day 27 from (F).
- H, I
(H) Relative tumor volume of ctl and p‐a xenografts injected in fat pad of virgin female mice (‐V) (n = 4 mice, eight tumors total), P = 0.0811, or (I) injected in actively involuting fat pad (‐Inv.) (n = 4 mice, eight tumors total), **P = 0.0092.
- J
Relative tumor volume of ctl and p‐a xenografts injected in actively involuting fat pad treated with three treatments of PQ401, starting at day 15 and ending at day 19 (n = 3 mice, five tumors total), *P = 0.0031, # P = 0.4270.

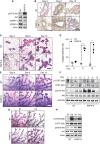
Whole‐mount sections of PAPP‐A mammary glands after 1 or 3 pregnancies and PAPP‐A age‐matched virgin. White arrows indicate lesions. Scale bar: 1 mm.
Left panel: Frequency of mammary lesions in NT virgin (‐V), NT pregnancy (‐P) and PAPP‐A virgin (‐V), PAPP‐A pregnancy (‐P) glands (n = 8 mice except for PAPP‐A‐P: n = 14 mice, seven mice with one pregnancy, seven mice with three pregnancies). Right panel: Number of lesions in PAPP‐A‐P group subdivided into 1 and 3 pregnancies (n = 7 mice, mean ± SEM). Unpaired t‐test (two‐tailed): **P = 0.0038.
Histological sections of two different histologies of a late‐stage (˜14 months) postpartum PAPP‐A mammary tumor. Scale bar: 100 μm.
IGFBP‐5 and pS473‐Akt immunohistochemistry of tumor 2 from (C) and a NT involuted gland, scale bar: 100 μm.
PAPP‐A transgenic mouse mammary glands' PAPP‐A transcript levels in untreated control, treated with estrogen (E2), progesterone (P4), or with both E2 and P4 for 1 week. (n = 3 mice, triplicate experiment, mean ± SD). One‐way ANOVA with Tukey's post hoc test: all P > 0.05.
Imaging of collagen by SHG of PAPP‐A mammary tumor (n = 5 tumors), scale bar: 200 μm.
Analysis of curvelet angle distribution for collagen alignment (n = 5 tumors from five mice, 3ROI analyzed per tumor, mean ± SEM).

Western blot analysis of NT and PAPP‐A mammary glands at day 1 of pregnancy.
pSer473‐Akt immunohistochemistry on mammary glands at days 3, 9, and 12 of pregnancy of NT and PAPP‐A transgenic mice (n = 9 mice; three mice per time point), scale bar: 25 μm.
Masson's trichrome stain (MTS) of mammary glands at indicated time points of pregnancy of NT and PAPP‐A transgenic mice, blue: collagen, scale bar: 100 μm.
Quantification of collagen by MTS from (C) (n = 3 mice, average of three determinations per mouse per time point). Each bar represents the mean ± SD. Unpaired t‐test (two‐tailed): ****P(day 9) < 0.001, **P(day 12) = 0.0032.
Whole‐mount analyses of mammary glands at days 3, 9, and 12 of first pregnancy in NT and PAPP‐A females, scale bar: 0.5 mm.
Immunoblot of mammary glands at indicated time points of first pregnancy.
Representative whole‐mount analyses of mammary glands at day 9 of first (P1) or third (P3) pregnancy from PAPP‐A females (n = 6 mice; three mice per time point), scale bar: 0.5 mm.
Immunoblot analyses of mammary glands at day 9 of first (P1) or third (P3) pregnancy.

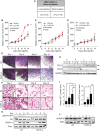
- A
Incidence of spontaneous mammary tumor formation in PAPP‐A females relative to the duration of lactation. Long lactation of > 3 weeks ranges from 21 to 24 days, with an average of 21.25 days, while short lactation of < 2 weeks ranges from 0 to 13 days, with an average of 1.076 days. Fisher's exact test: P = 0.0170.
- B–D
Growth rate of ctl and p‐a xenografts injected in fat pad of actively involuting mammary glands without any prior lactation (‐Inv.), of actively lactating (‐Lac.), and of actively involuting mammary glands following 2 weeks of prior lactation (‐Lac.+Inv.), (n = 3 mice, 6 tumors total, mean ± SD). Unpaired t‐test (two‐tailed) was applied to calculate statistical significance at the end point. **P = 0.0027 for (B), P = 0.4359 for (C), and P = 0.3066 for (D).
- E
Whole‐mount analyses of involuting mammary glands (n = 12 mice; three mice per time point) at days 1, 3, 6, and 12 of involution in NT and PAPP‐A females, scale bar: 1 mm.
- F
H&E sections of corresponding mammary glands from (E), scale bar: 100 μm.
- G
Immunoblot of mammary glands during involution in NT and PAPP‐A females.
- H
Immunoblot for STC1 and STC2 from mammary gland extracts of virgin (V), at pregnancy (P), at lactation (L), or at involution (I) performed in triplicate mice per group.
- I
Quantification of immunoblot for STC1 or STC2 from (H). Error bars are mean ± SD. Left panel (STC1) *P = 0.0148 (V versus I), *P = 0.0293 (P versus I), **P = 0.0021 (L versus I). Right panel (STC2) *P = 0.0248 (V versus L), **P = 0.0079 (L versus I).
- J
Immunoblot of rIGFBP‐5 following proteolysis assay using NT or PAPP‐A extracts from V, P, L or I mammary glands.

Representative PAPP‐A and IGFBP‐5 immunohistochemistry of nulliparous (n = 18) and parous (n = 28) breast cancer patients. Scale bar: 200 μm.
Age range of breast cancer patients in parous and nulliparous groups available for analysis. Error bars represent mean ± SD.
Receptor status and frequency of positive/negative immunostaining in patient slides positive for PAPP‐A, IGFBP‐5, and PAPP‐A positive/IGFBP‐5 negative. Two‐way ANOVA with Bonferroni's test: *P = 0.047, **P = 0.0001, ***P = 0.0005.
SHG image of collagen from patient slides, scale bar: 50 μm.
Distribution of collagen curvelet angles, as calculated by CurveAlign software, of breast cancer sections from parous and nulliparous patients. One‐way ANOVA with Tukey's post hoc test: ****P < 0.0001 for < 40°, P = 0.379 for 40° – 60°, and ****P < 0.0001 for > 60°.
TACS‐3 signature score of breast cancer from parous and nulliparous patients. Unpaired t‐test (two‐tailed): ****P < 0.0001.

- A, B
The diagram represents PAPP‐A and IGF signaling over the course of pregnancy in a (A) normal mammary gland and (B) when PAPP‐A is overexpressed. See text for details.
Similar articles
-
Parity predisposes breasts to the oncogenic action of PAPP-A and activation of the collagen receptor DDR2.Breast Cancer Res. 2019 May 2;21(1):56. doi: 10.1186/s13058-019-1142-z. Breast Cancer Res. 2019. PMID: 31046834 Free PMC article.
-
The Multi-Faced Role of PAPP-A in Post-Partum Breast Cancer: IGF-Signaling is Only the Beginning.J Mammary Gland Biol Neoplasia. 2020 Sep;25(3):181-189. doi: 10.1007/s10911-020-09456-1. Epub 2020 Sep 8. J Mammary Gland Biol Neoplasia. 2020. PMID: 32901383 Review.
-
Stanniocalcin-1 Potently Inhibits the Proteolytic Activity of the Metalloproteinase Pregnancy-associated Plasma Protein-A.J Biol Chem. 2015 Sep 4;290(36):21915-24. doi: 10.1074/jbc.M115.650143. Epub 2015 Jul 20. J Biol Chem. 2015. PMID: 26195635 Free PMC article.
-
Collagen and PAPP-A in the Etiology of Postpartum Breast Cancer.Horm Cancer. 2019 Dec;10(4-6):137-144. doi: 10.1007/s12672-019-00368-z. Epub 2019 Oct 20. Horm Cancer. 2019. PMID: 31631239 Free PMC article. Review.
-
Depot-specific and GH-dependent regulation of IGF binding protein-4, pregnancy-associated plasma protein-A, and stanniocalcin-2 in murine adipose tissue.Growth Horm IGF Res. 2018 Apr;39:54-61. doi: 10.1016/j.ghir.2018.01.001. Epub 2018 Feb 3. Growth Horm IGF Res. 2018. PMID: 29398370
Cited by
-
Genetic variants in the metzincin metallopeptidase family genes predict melanoma survival.Mol Carcinog. 2018 Jan;57(1):22-31. doi: 10.1002/mc.22716. Epub 2017 Aug 28. Mol Carcinog. 2018. PMID: 28796414 Free PMC article.
-
The role of pregnancy associated plasma protein-A in triple negative breast cancer: a promising target for achieving clinical benefits.J Biomed Sci. 2024 Feb 23;31(1):23. doi: 10.1186/s12929-024-01012-x. J Biomed Sci. 2024. PMID: 38395880 Free PMC article. Review.
-
The IGF-PAPP-A-Stanniocalcin Axis in Serum and Ascites Associates with Prognosis in Patients with Ovarian Cancer.Int J Mol Sci. 2024 Feb 7;25(4):2014. doi: 10.3390/ijms25042014. Int J Mol Sci. 2024. PMID: 38396692 Free PMC article.
-
m6A mRNA methylation regulates the ERK/NF-κB/AKT signaling pathway through the PAPPA/IGFBP4 axis to promote proliferation and tumor formation in endometrial cancer.Cell Biol Toxicol. 2023 Aug;39(4):1611-1626. doi: 10.1007/s10565-022-09751-z. Epub 2022 Aug 15. Cell Biol Toxicol. 2023. PMID: 35971034
-
Parity predisposes breasts to the oncogenic action of PAPP-A and activation of the collagen receptor DDR2.Breast Cancer Res. 2019 May 2;21(1):56. doi: 10.1186/s13058-019-1142-z. Breast Cancer Res. 2019. PMID: 31046834 Free PMC article.
References
-
- Albrektsen G, Heuch I, Thoresen S, Kvale G (2006) Clinical stage of breast cancer by parity, age at birth, and time since birth: a progressive effect of pregnancy hormones? Cancer Epidemiol Biomarkers Prev 15: 65–69 - PubMed
-
- Andersson TM, Johansson AL, Hsieh CC, Cnattingius S, Lambe M (2009) Increasing incidence of pregnancy‐associated breast cancer in Sweden. Obstet Gynecol 114: 568–572 - PubMed
-
- Blackstock CD, Higashi Y, Sukhanov S, Shai SY, Stefanovic B, Tabony AM, Yoshida T, Delafontaine P (2014) Insulin‐like growth factor‐1 increases synthesis of collagen type I via induction of the mRNA‐binding protein LARP6 expression and binding to the 5′ stem‐loop of COL1a1 and COL1a2 mRNA. J Biol Chem 289: 7264–7274 - PMC - PubMed
MeSH terms
Substances
LinkOut - more resources
Full Text Sources
Other Literature Sources
Medical
Miscellaneous

