. 2016 Mar 22;113(12):E1701-9.
doi: 10.1073/pnas.1525578113. Epub 2016 Mar 7.

Prediction, dynamics, and visualization of antigenic phenotypes of seasonal influenza viruses

Affiliations

Prediction, dynamics, and visualization of antigenic phenotypes of seasonal influenza viruses

Richard A Neher et al. Proc Natl Acad Sci U S A. .

Abstract

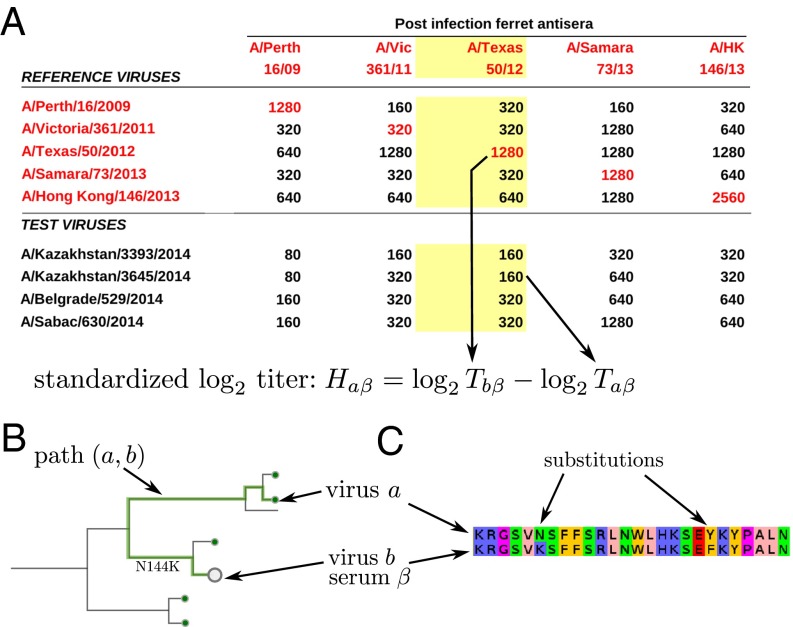
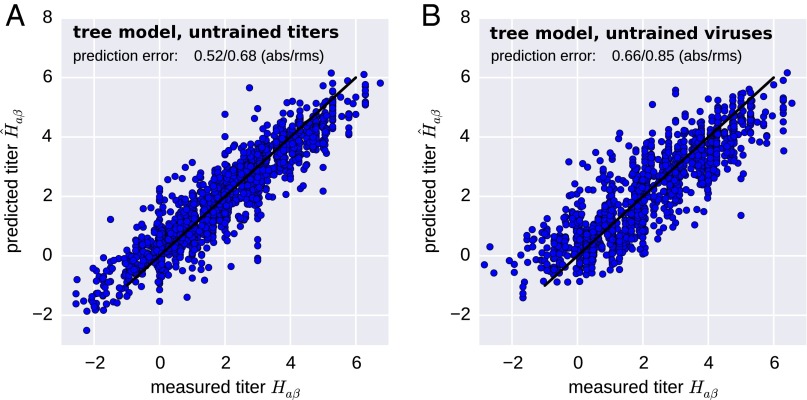
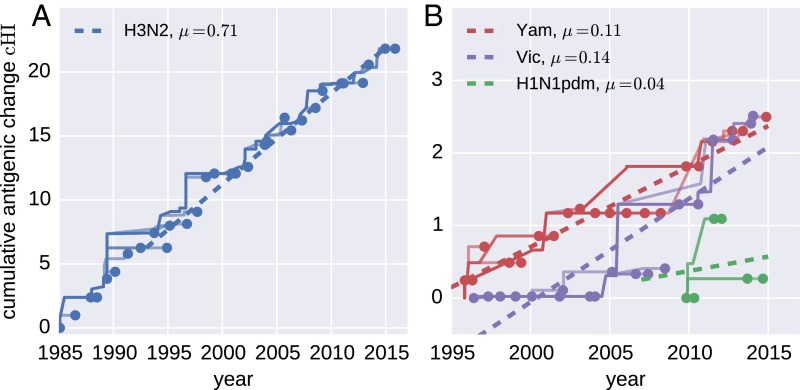
Human seasonal influenza viruses evolve rapidly, enabling the virus population to evade immunity and reinfect previously infected individuals. Antigenic properties are largely determined by the surface glycoprotein hemagglutinin (HA), and amino acid substitutions at exposed epitope sites in HA mediate loss of recognition by antibodies. Here, we show that antigenic differences measured through serological assay data are well described by a sum of antigenic changes along the path connecting viruses in a phylogenetic tree. This mapping onto the tree allows prediction of antigenicity from HA sequence data alone. The mapping can further be used to make predictions about the makeup of the future A(H3N2) seasonal influenza virus population, and we compare predictions between models with serological and sequence data. To make timely model output readily available, we developed a web browser-based application that visualizes antigenic data on a continuously updated phylogeny.

Keywords: antigenic distance; evolution; phylogenetic tree.


Conflict of interest statement

The authors declare no conflict of interest.

Figures

Fig. 1.
Fig. 1.
Antigenic data and models for HI titers. (A) A typical table reporting HI titer data. Each number in the table is the maximum dilution at which the antiserum (column) inhibited hemagglutination of red blood cells by a virus (row). The red numbers on the diagonal indicate homologous titers. A typical HI assay consists of all reciprocal measurements of the available antisera and reference viruses, and a number of test viruses that are measured against all antisera, but for which no homologous antiserum exists. To make measurements using different antisera comparable, we define standardized log-transformed titers Haβ relative to the homologous titer. (B) Each HI titer between antiserum α and virus b can be associated with a path on the tree connecting the reference and test viruses a and b, respectively, indicated as a thick line. The tree model seeks to explain the antigenic differences as additive contributions of branches. (C) In the substitution model, the sum over branches on the tree is replaced by a sum of contributions of amino acid substitutions.
Fig. 2.
Fig. 2.
A(H3N2) HI titers are accurately predicted by the tree model. The figure scatters predicted titers H^aβ (y axis) against a test set of measurements Haβ not used for training of the model (x axis). This test set either consists of (A) a random sample of 10% of all measurements or (B) all measurements for 10% of all viruses. In the latter, no avidity can be estimated for viruses in the test set because these viruses are completely absent from the training data (va=0 is assumed). Hence prediction accuracy is lower but still comparable to the measurement accuracy. The figure shows data obtained using a 12-y set of A(H3N2) viruses. Other time intervals and lineages are predicted similarly well.
Fig. 3.
Fig. 3.
Cumulative antigenic change (cHI) from phylogeny root to tips across influenza viruses. (A) A(H3N2) antigenic evolution over the past 30 y. The trunk of the tree is shown as a thick line, and side branches are shown as thin lines. The dashed straight line indicates the linear regression vs. time. (B) The corresponding traces for the two influenza B lineages (past 20 y) and A(H1N1)pdm09 (past 7 y).
Fig. S1.
Fig. S1.
Contributions of small and large effect substitution to antigenic evolution. About half of antigenic change is attributed to mutations with effects smaller than one unit. The figure shows the fraction antigenic change by common mutations with effects smaller than the cutoff on the horizontal axis.
Fig. 4.
Fig. 4.
H3N2 HI titers define an approximate a distance on the tree. (A) Reciprocal HI titer measurements often differ by several log2 units (histogram of HaβHbα). After subtracting avidities and potencies, the remainder Δ − Δ is almost symmetric, with deviations on the order of the measurement accuracy (SD 0.95). (B) On a tree, the two largest sums of distances within antisera/virus quartets are equal (see HI Titers Define an Approximate Distance). B shows the distribution of the absolute value of the difference of the top two distance sums for quartets and for three random distance sums. Those from quartets have a much smaller deviation. A and B both show results for A(H3N2) viruses from the last 12 years.
Fig. S2.
Fig. S2.
Determinants of corrected HI titers Haβvapβ (y axis) of A(H3N2) viruses. (A) Correlation of corrected HI titers Haβvapβ with the number of substitutions at mapped epitope sites between reference and test virus. Similarly, B shows this correlation for the distance at receptor binding sites, and C shows the correlation with the genetic component Dab of the substitution model. Neither epitope or RBS distance explain much of the titer variation (Pearson correlation coefficient above the panels).
Fig. 5.
Fig. 5.
Antigenic evolution and the success of A(H3N2) clades. (A) Trajectories of clades colored by inferred cumulative antigenic evolution in the past 6 mo on branches ancestral to the clade. The majority of the clades with substantial recent antigenic change fix, but several antigenically evolved branches go extinct. B quantifies the power of cumulative antigenic change (cHI) to predict clade success. B shows the nucleotide distances of clades with maximal cHI among clades that account for at least 1% and 5% of all viruses. Predictions based on maximal LBI are also shown. Distances are relative to the average distance between present and future populations shown as the dashed line at 1. The solid black line indicates the distances of the best possible pick in each year. Predictions based on maximal LBI and cHI are correlated, but maximal cHI is sensitive to false positives (highest scoring clades that go extinct). (C) Histogram of centered cHI of the clade closest to the next season for each year, suggesting that successful clades tend to be antigenically advanced.
Fig. S3.
Fig. S3.
Success versus antigenic advancement. In many years, the most antigenically advanced clade (highest cHI) is not the clade dominating the next season. The figure shows the maximally observed centered cHI vs. the centered cHI of the successful clade for each year from 1990 to 2014.
Fig. 6.
Fig. 6.
Substitutions with large antigenic effect fix preferentially. The figure shows the fraction of all substitutions in A(H3N2) that reach the indicated frequency for different magnitudes of the inferred antigenic effect of this substitution. The plot combines data from substitution models fitted to five overlapping 10-y intervals from 1985 to 2015 and contains all substitutions that reach at least 10% population frequency. There are few substitutions in the highest HI category; error bars show SDs of boot strap replicates of substitutions.
Fig. 7.
Fig. 7.
Visualization of antigenic evolution on the tree. Tree tips are colored according to the predicted log2 titer distance relative the focal virus (A/Texas/50/2012 in this case). The tool tip shows titers relative to all available antisera and titer predictions as a table. Each reference virus (gray squares) can be chosen by clicking with the mouse, upon which the tree color is updated. Crosses indicate vaccine strains. The tool tip shows all available measurements and the predictions by both models, and the color averages measurements relative to different antisera. Visualizations are available for all seasonal influenza lineages.

References

    1. Hay AJ, Gregory V, Douglas AR, Lin YP. The evolution of human influenza viruses. Philos Trans R Soc Lond B Biol Sci. 2001;356(1416):1861–1870. - PMC - PubMed
    1. Barr IG, et al. Writing Committee of the World Health Organization Consultation on Northern Hemisphere Influenza Vaccine Composition for 2013–2014 WHO recommendations for the viruses used in the 2013-2014 Northern Hemisphere influenza vaccine: Epidemiology, antigenic and genetic characteristics of influenza A(H1N1)pdm09, A(H3N2) and B influenza viruses collected from October 2012 to January 2013. Vaccine. 2014;32(37):4713–4725. - PubMed
    1. Hirst GK. The quantitative determination of influenza virus and antibodies by means of red cell agglutination. J Exp Med. 1942;75(1):49–64. - PMC - PubMed
    1. Smith DJ, et al. Mapping the antigenic and genetic evolution of influenza virus. Science. 2004;305(5682):371–376. - PubMed
    1. Bedford T, et al. Integrating influenza antigenic dynamics with molecular evolution. eLife. 2014;3:e01914. - PMC - PubMed

Publication types

MeSH terms

Substances