. 2016 Mar 22;113(12):3305-10.
doi: 10.1073/pnas.1524473113. Epub 2016 Mar 7.

Computer vision cracks the leaf code

Affiliations

Computer vision cracks the leaf code

Peter Wilf et al. Proc Natl Acad Sci U S A. .

Abstract

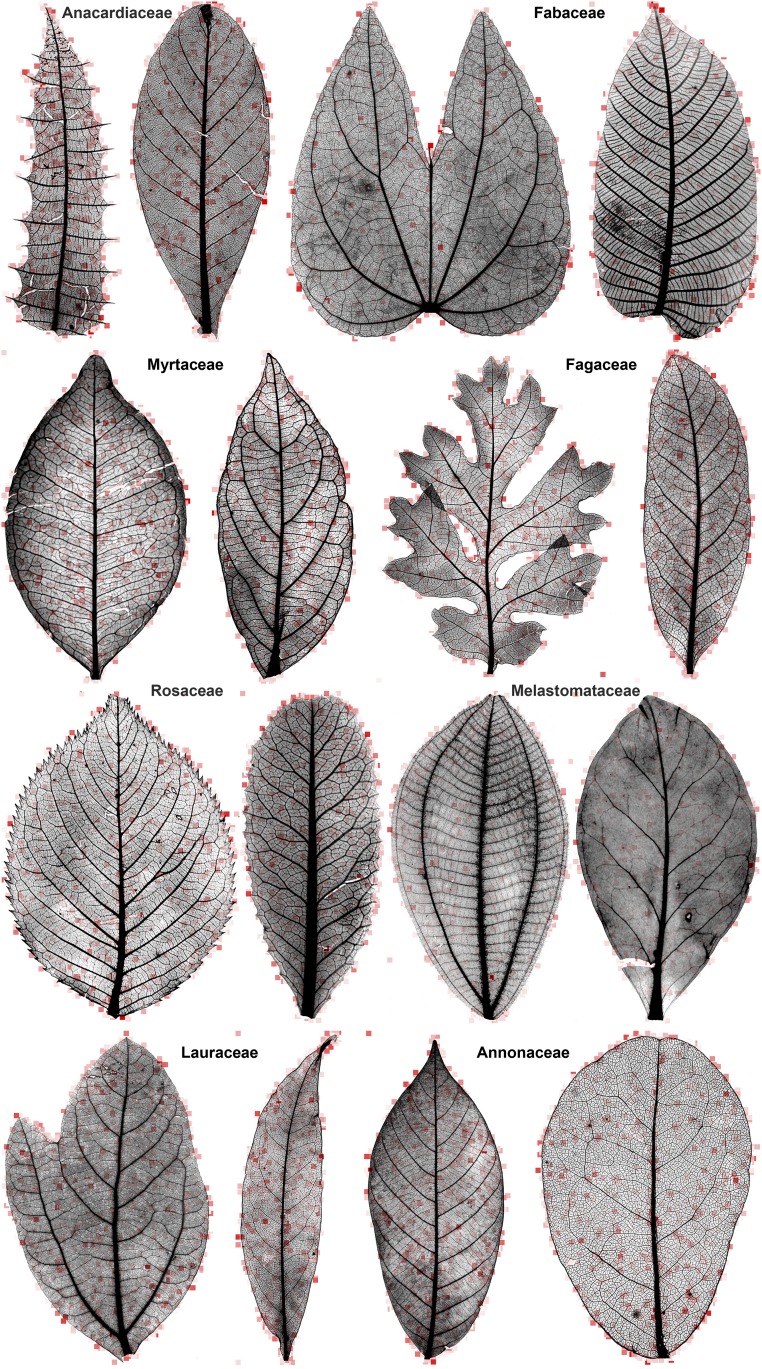
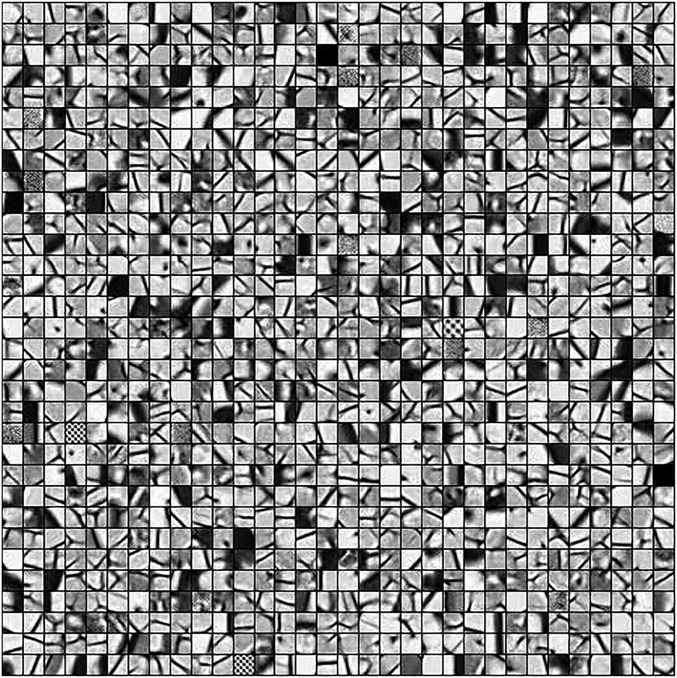
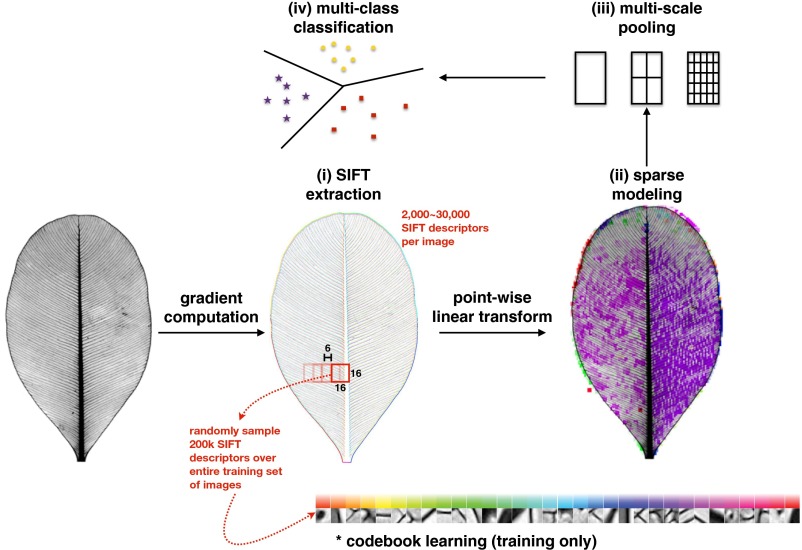
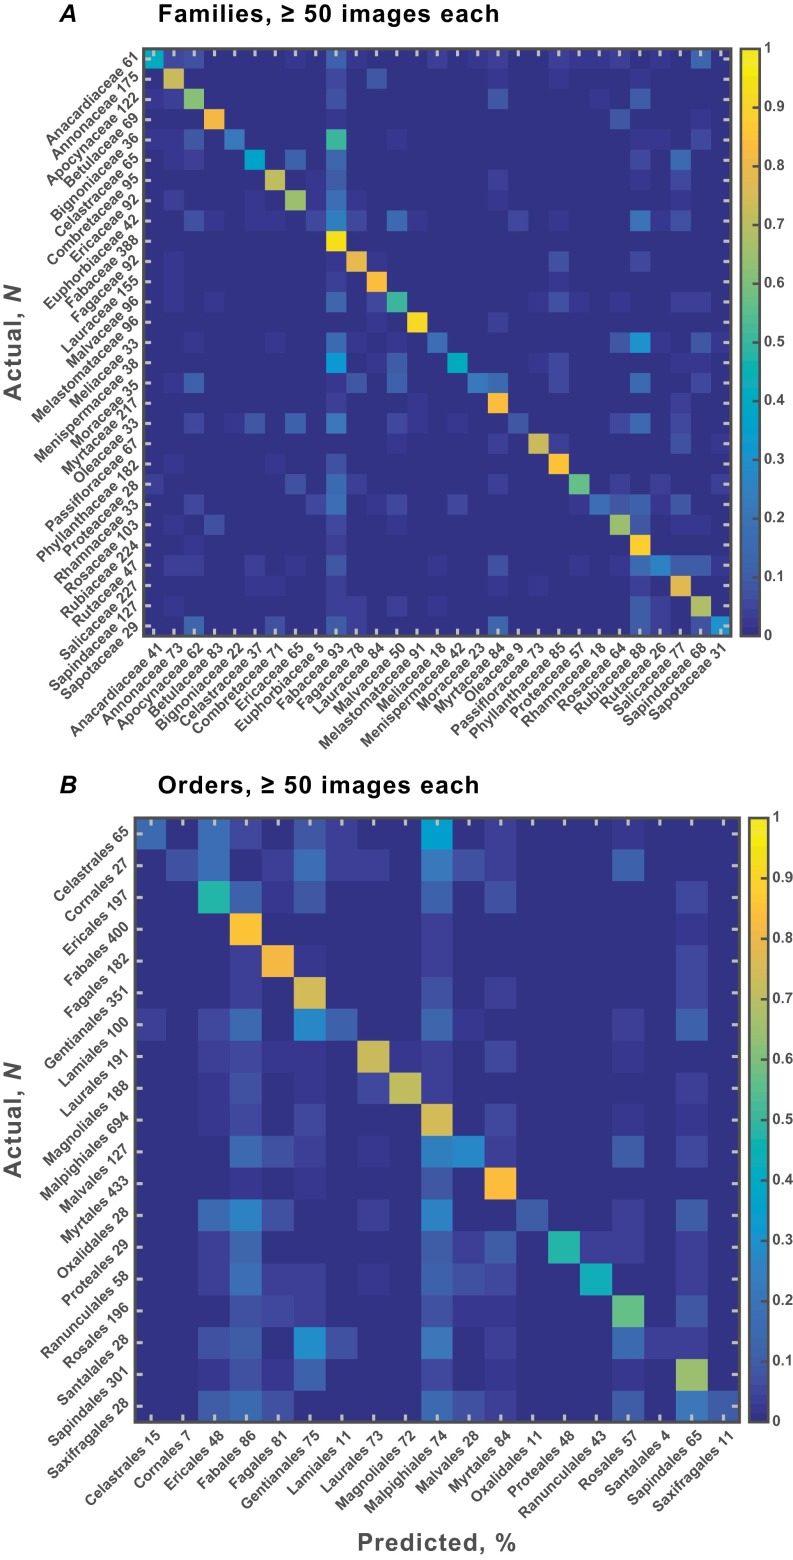
Understanding the extremely variable, complex shape and venation characters of angiosperm leaves is one of the most challenging problems in botany. Machine learning offers opportunities to analyze large numbers of specimens, to discover novel leaf features of angiosperm clades that may have phylogenetic significance, and to use those characters to classify unknowns. Previous computer vision approaches have primarily focused on leaf identification at the species level. It remains an open question whether learning and classification are possible among major evolutionary groups such as families and orders, which usually contain hundreds to thousands of species each and exhibit many times the foliar variation of individual species. Here, we tested whether a computer vision algorithm could use a database of 7,597 leaf images from 2,001 genera to learn features of botanical families and orders, then classify novel images. The images are of cleared leaves, specimens that are chemically bleached, then stained to reveal venation. Machine learning was used to learn a codebook of visual elements representing leaf shape and venation patterns. The resulting automated system learned to classify images into families and orders with a success rate many times greater than chance. Of direct botanical interest, the responses of diagnostic features can be visualized on leaf images as heat maps, which are likely to prompt recognition and evolutionary interpretation of a wealth of novel morphological characters. With assistance from computer vision, leaves are poised to make numerous new contributions to systematic and paleobotanical studies.

Keywords: computer vision; leaf architecture; leaf venation; paleobotany; sparse coding.


Conflict of interest statement

The authors declare no conflict of interest.

Figures

Fig. 1.
Fig. 1.
Representative heat maps on selected pairs of leaves from analyzed families, showing typical variation among species within families. Red intensity indicates the diagnostic importance of an individual codebook element at a leaf location for classifying the leaf into the correct family in the scenario of Fig. 3A. The locations and intensities correspond to the maximum classifier weights associated with the individual codebook elements (Materials and Methods). For readability, only coefficients associated with the 1 × 1 scale of the spatial pyramid grid are shown; most elements have zero activation on a given leaf. Background areas show some responses to minute stray objects. All images are shown with equal longest dimensions (here, height), as processed by the machine-vision system; see Dataset S1 for scaling data. Specimens from Wolfe National Cleared Leaf Collection as follows. First row, left to right: Anacardiaceae, Comocladia acuminata, Wolfe (catalog no. 8197) and Campnosperma minus (catalog no. 8193); Fabaceae, Bauhinia glabra (catalog no. 30215) and Dussia micranthera (catalog no. 9838). Second row: Myrtaceae, Myrcia multiflora (catalog no. 3543) and Campomanesia guaviroba (catalog no. 3514); Fagaceae, Quercus lobata (catalog no. 1366) and Chrysolepis sempervirens (catalog no. 7103). Third row: Rosaceae, Prunus subhirtella (catalog no. 8794) and Heteromeles arbutifolia (catalog no. 11992); Melastomataceae, Conostegia caelestis (catalog no. 7575) and Memecylon normandii (catalog no. 14338). Fourth row: Lauraceae, Sassafras albidum (catalog no. 771) and Aiouea saligna (catalog no. 2423); Annonaceae, Neostenanthera hamata (catalog no. 4481) and Monanthotaxis fornicata (catalog no. 2866). Extended heat-map outputs are hosted on Figshare, dx.doi.org/10.6084/m9.figshare.1521157.
Fig. 2.
Fig. 2.
Learned visual codebook (n =1,024 coding elements) obtained from one random split of the image library. Ten splits were done to compute the reported accuracies (Table 1). A few codebook elements are moiré dots from background areas of scanned book pages (see Materials and Methods). Precisely visualizing the codebook is an unsolved problem, and we used a computational approximation (38) to produce this figure.
Fig. S1.
Fig. S1.
Computer vision system summary.
Fig. 3.
Fig. 3.
Confusion matrices for family (A) and order (B) classification at the 100-image minimum per category. Colors indicate the proportion of images from the actual categories at left that the algorithm classified into the predicted categories along bottom of each graph (also see Fig. S2 and Dataset S1). Based on a single randomized test trial (of 10 total) on half of the image set, following training on the other half. Note that the sample sizes (N) shown along the left sides equal half the total processed because the sample sizes represent the number of testing samples used, which is half the total number of samples available for each training/test split. Numbers along horizontal axes show the percentage correctly identified. For example, at top left corner, 36% of 61 Anacardiaceae leaves (22 of the 61 leaves) were correctly identified to that family. Identification (chance) accuracies and SDs across 10 trials show negligible variance (see also Table 1): (A) 72.14 ± 0.75% (5.61 ± 0.54%) for 19 families; (B) 57.26 ± 0.81% (7.27 ± 0.44%) for 14 orders.
Fig. S2.
Fig. S2.
Confusion matrices for family (A) and order (B) classification at the 50-image minima, as in Fig. 3. Identification (chance) accuracies and SDs: (A) 55.84 ± 0.86% (3.53 ± 0.34%), for 29 families; (B) 46.14 ± 0.79% (5.17 ± 0.17%), for 19 orders.
Fig. S3.
Fig. S3.
System accuracy as a function of the number of training samples available per category, for five orders with at least 400 images each (Fabales, Gentianales, Malpighiales, Myrtales, and Sapindales).

References

    1. Hickey LJ, Wolfe JA. The bases of angiosperm phylogeny: Vegetative morphology. Ann Mo Bot Gard. 1975;62(3):538–589.
    1. Hickey LJ, Doyle JA. Early Cretaceous fossil evidence for angiosperm evolution. Bot Rev. 1977;43(1):2–104.
    1. Doyle JA. Systematic value and evolution of leaf architecture across the angiosperms in light of molecular phylogenetic analyses. Cour Forschungsinst Senckenb. 2007;258:21–37.
    1. Soltis DE, Soltis PS, Endress PK, Chase MW. Phylogeny and Evolution of Angiosperms. Sinauer; Sunderland, MA: 2005.
    1. Friis EM, Crane PR, Pedersen KR. Early Flowers and Angiosperm Evolution. Cambridge Univ Press; Cambridge, UK: 2011.

Publication types

LinkOut - more resources