. 2016 Mar 8:6:22291.
doi: 10.1038/srep22291.

Towards population-level conservation in the critically endangered Antarctic blue whale: the number and distribution of their populations

Affiliations

Towards population-level conservation in the critically endangered Antarctic blue whale: the number and distribution of their populations

Catherine R M Attard et al. Sci Rep. .

Abstract

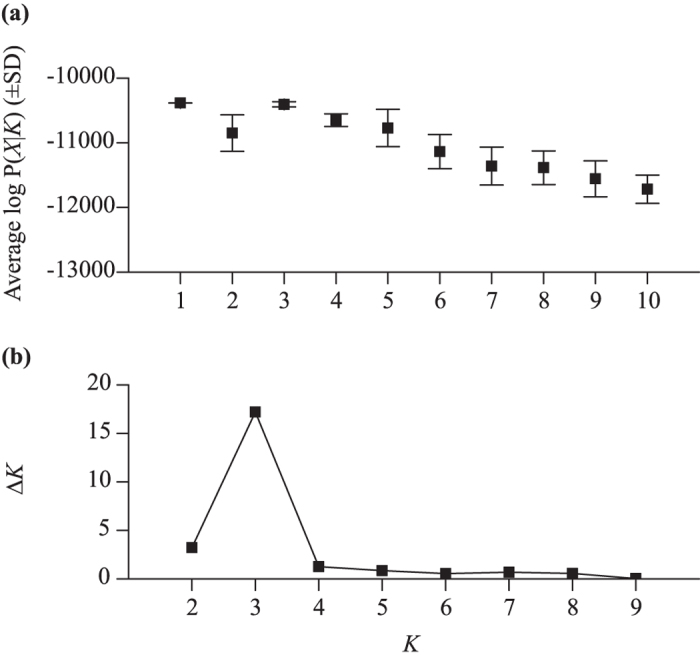
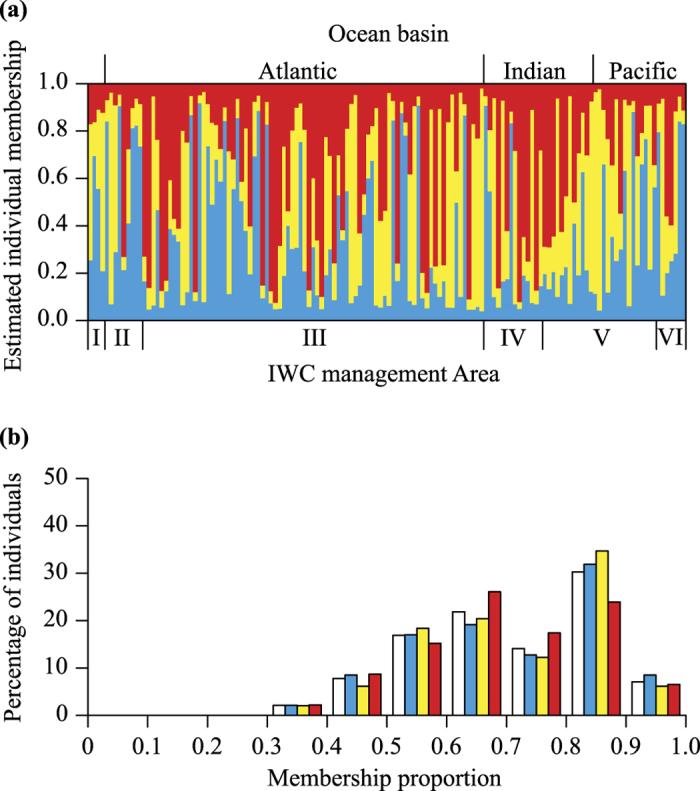
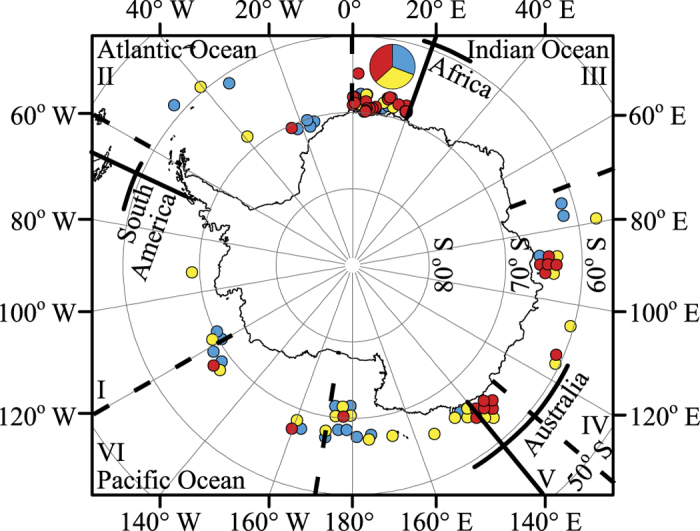
Population-level conservation is required to prevent biodiversity loss within a species, but it first necessitates determining the number and distribution of populations. Many whale populations are still depleted due to 20th century whaling. Whales are one of the most logistically difficult and expensive animals to study because of their mobility, pelagic lifestyle and often remote habitat. We tackle the question of population structure in the Antarctic blue whale (Balaenoptera musculus intermedia) - a critically endangered subspecies and the largest extant animal - by capitalizing on the largest genetic dataset to date for Antarctic blue whales. We found evidence of three populations that are sympatric in the Antarctic feeding grounds and likely occupy separate breeding grounds. Our study adds to knowledge of population structure in the Antarctic blue whale. Future research should invest in locating the breeding grounds and migratory routes of Antarctic blue whales through satellite telemetry to confirm their population structure and allow population-level conservation.


Figures

Figure 1
Figure 1. Inference of the number of genetic clusters detected by STRUCTURE for Antarctic blue whales using microsatellites.
(a) Average estimate (±standard deviation) of the log of the probability of the data for each tested value of K, which was used to calculate (b) ΔK for tested values of K.
Figure 2
Figure 2. Clustering results of the STRUCTURE analysis for Antarctic blue whales using microsatellites when K is set to 3 and as summarized using CLUMPAK.
Population 1, blue or medium grey in greyscale; population 2, yellow or light grey in greyscale; population 3, red or dark grey in greyscale. (a) Estimated membership of each individual to each cluster. Each individual is represented by a column. Individuals are ordered according to the longitude at which they were sampled, starting from the western border of IWC management Area I. Individuals sampled at the same longitude were ordered from the oldest to the newest sample. The colouring of each column represents the proportion of estimated membership of each individual to each population. (b) Percentage distribution histogram of the highest membership proportion of Antarctic blue whales (white) and blue whales from each population.
Figure 3
Figure 3. Polar map showing the biopsy sampling locations of individual blue whales off Antarctica.
Each individual is represented by a circle, which is shaded according to its highest cluster membership as estimated in STRUCTURE using microsatellites (population 1, blue or medium grey in greyscale; population 2, yellow or light grey in greyscale; population 3, red or dark grey in greyscale). Only the first recorded location is shown for individuals sampled more than once. The map position of individuals sampled from the same or similar locations has been slightly altered so that all individuals are visible, with the exception of individuals located from 0° to 20°E due to extensive sampling from this area (n = 81). A pie chart shows the proportion of individuals that belong to each STRUCTURE cluster in the area from 0° to 20°E. Borders of IWC management Areas I to VI (dashed, black latitudinal lines) and ocean basins (solid, black latitudinal lines; borders according to International Hydrographic Organization definitions110) are shown. The longitudes of the southern coasts of South America, Africa and Australia are indicated (solid, black longitudinal lines). The map was created using ARCGIS 10.0 (Esri).

References

    1. Purvis A. & Hector A. Getting the measure of biodiversity. Nature 405, 212–219 (2000). - PubMed
    1. Stockwell C. A., Hendry A. P. & Kinnison M. T. Contemporary evolution meets conservation biology. Trends Ecol. Evol. 18, 94–101 (2003).
    1. Pressey R. L., Cabeza M., Watts M. E., Cowling R. M. & Wilson K. A. Conservation planning in a changing world. Trends Ecol. Evol. 22, 583–592 (2007). - PubMed
    1. Garner A., Rachlow J. L. & Hicks J. F. Patterns of genetic diversity and its loss in mammalian populations. Conserv. Biol. 19, 1215–1221 (2005).
    1. Clapham P. J., Young S. B. & Brownell R. L. Jr. Baleen whales: conservation issues and the status of the most endangered populations. Mamm. Rev. 29, 35–60 (1999).

Publication types

LinkOut - more resources