. 2016 Mar 8:7:10899.
doi: 10.1038/ncomms10899.

A ligand-independent integrin β1 mechanosensory complex guides spindle orientation

Affiliations

A ligand-independent integrin β1 mechanosensory complex guides spindle orientation

Nicoletta I Petridou et al. Nat Commun. .

Abstract

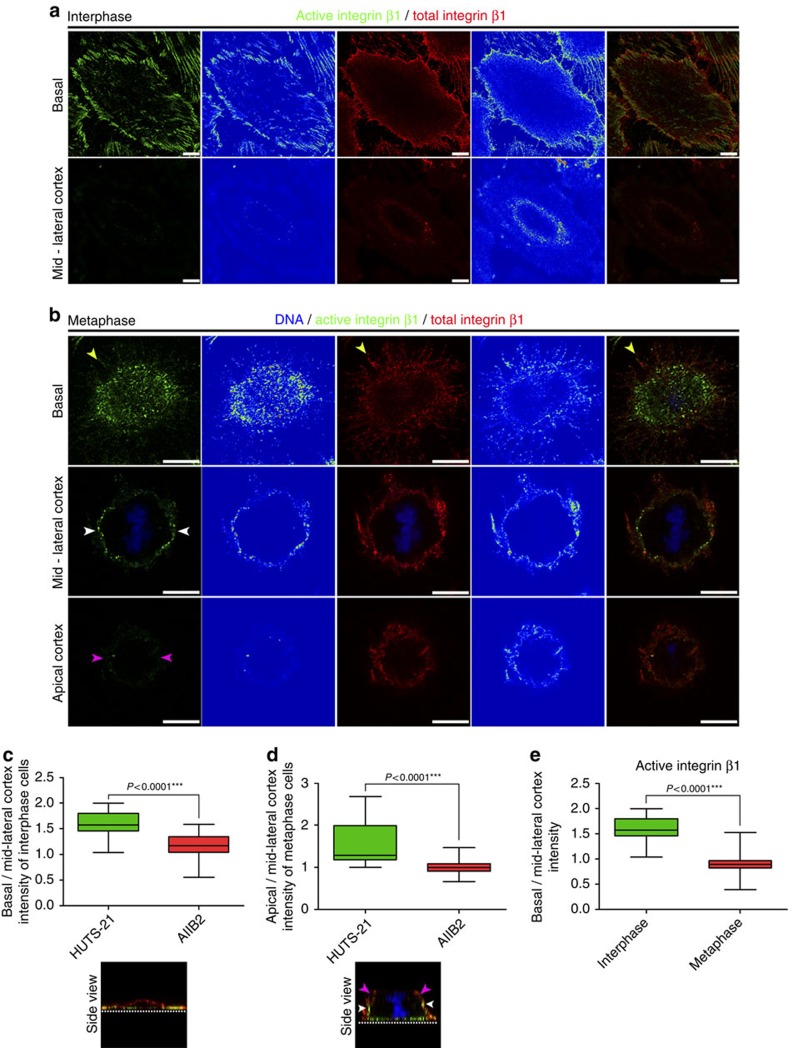
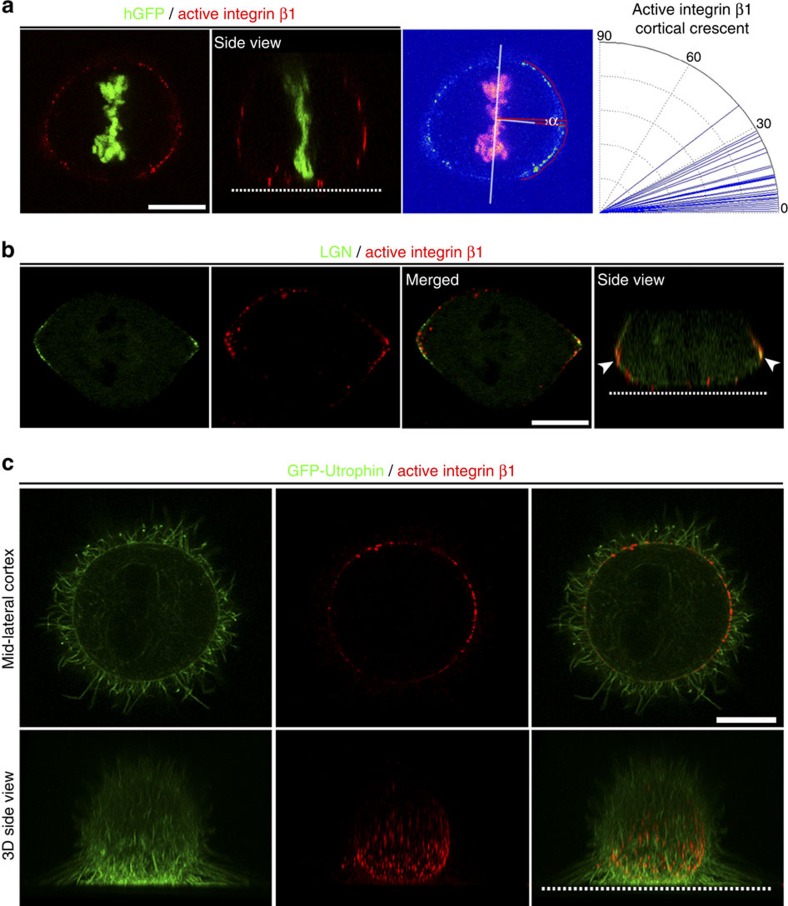
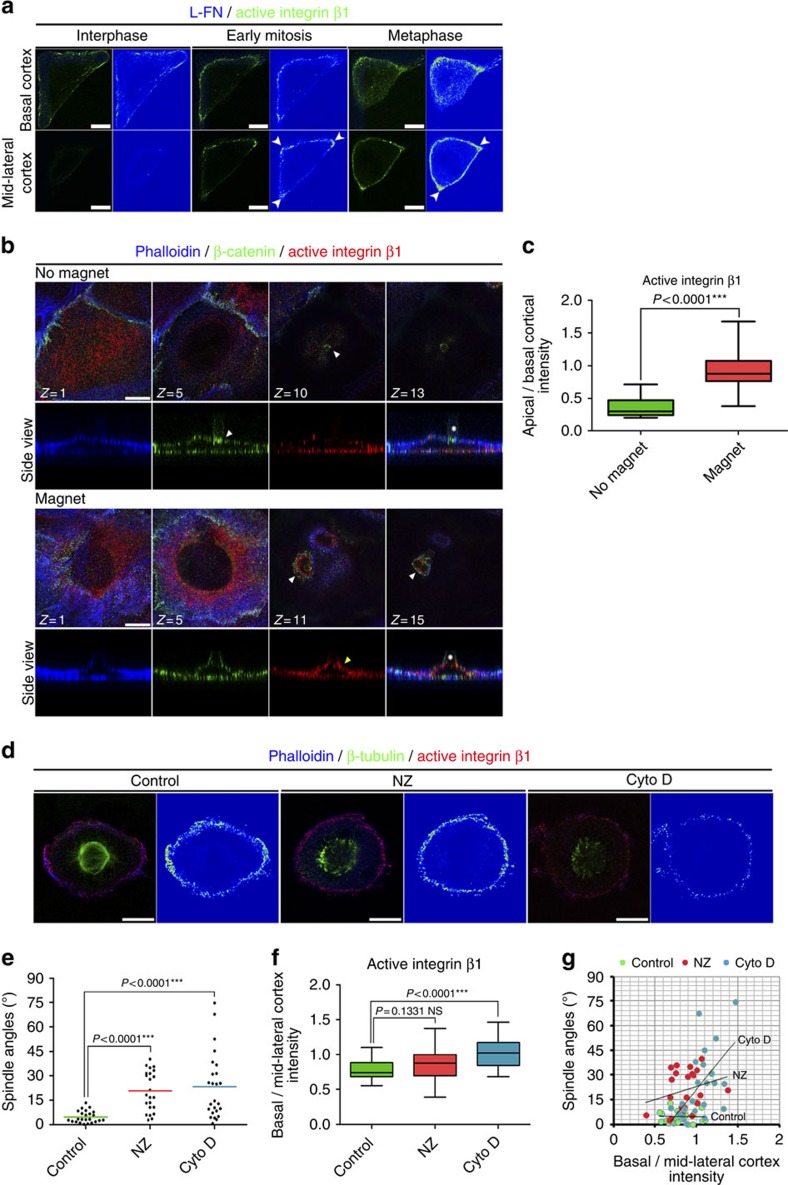
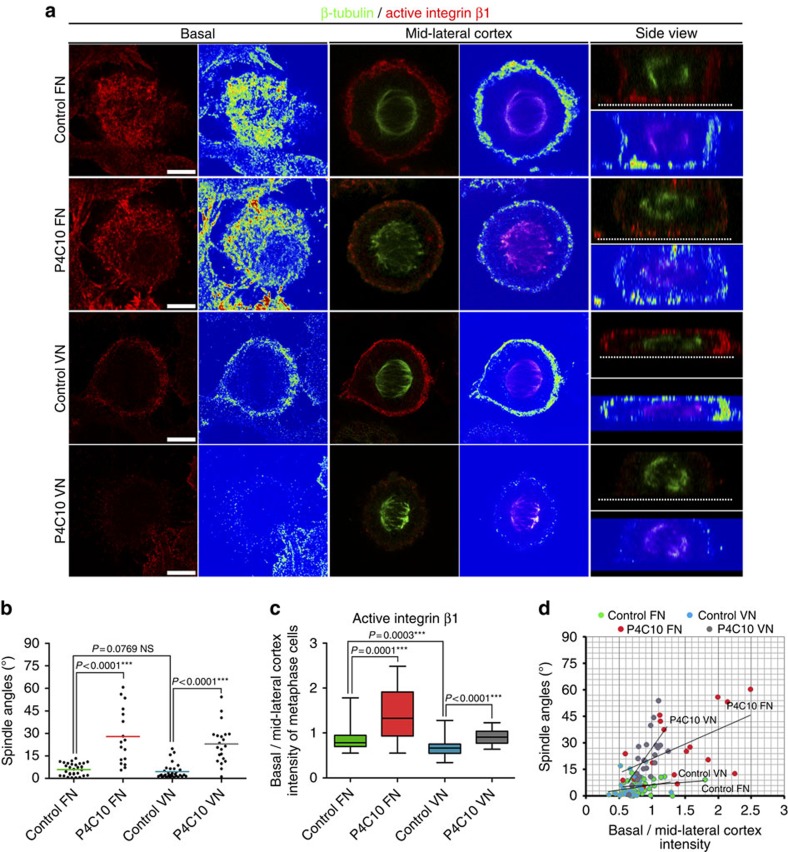
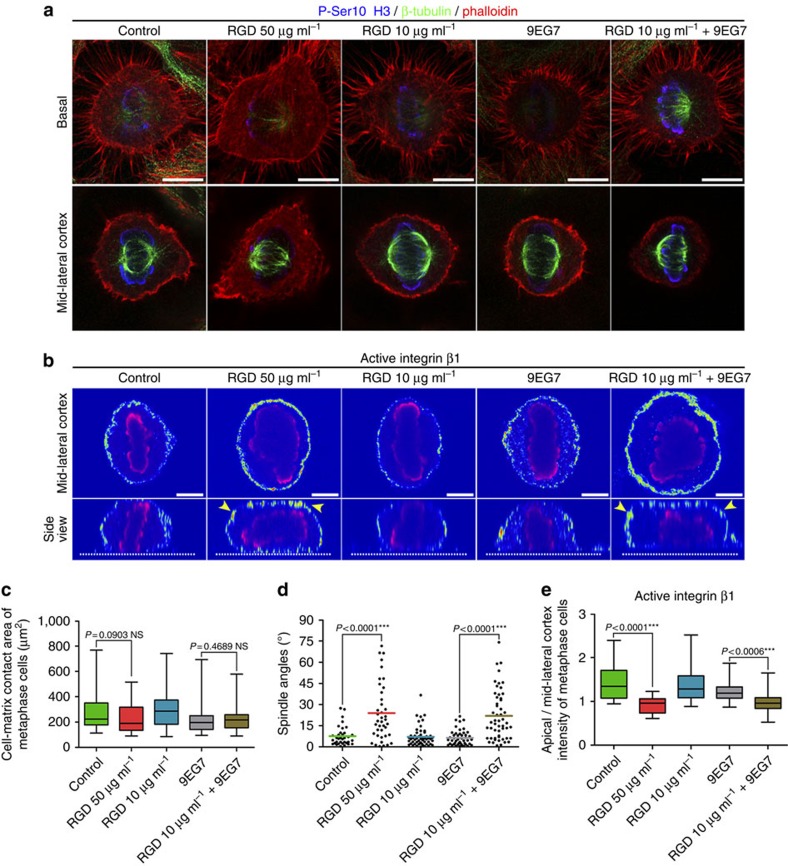
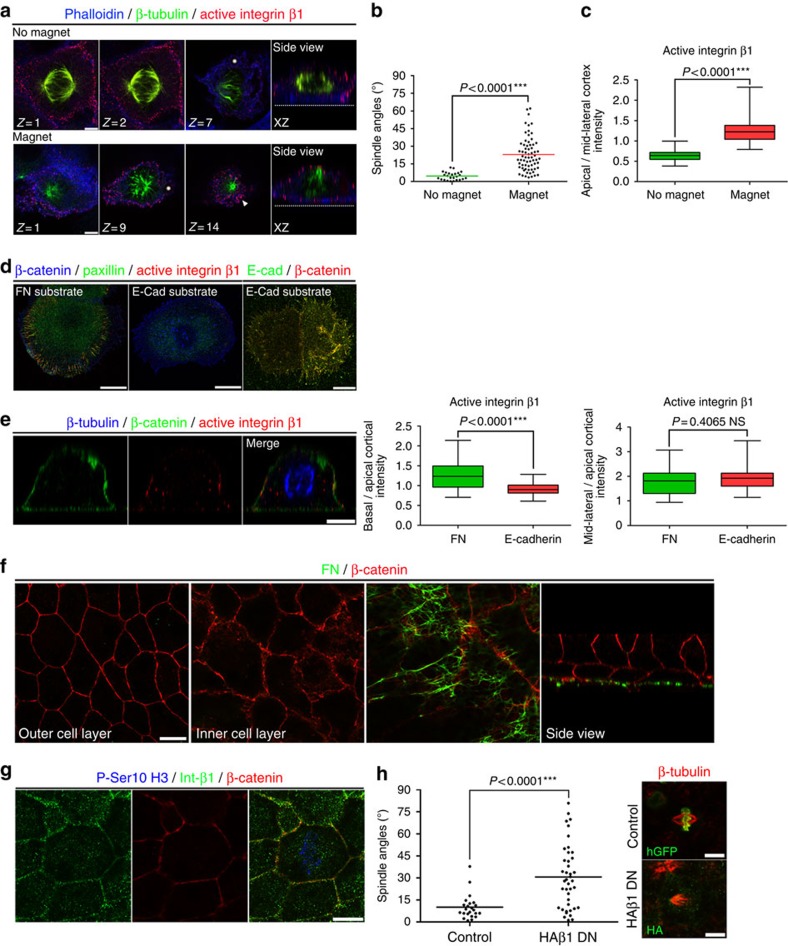
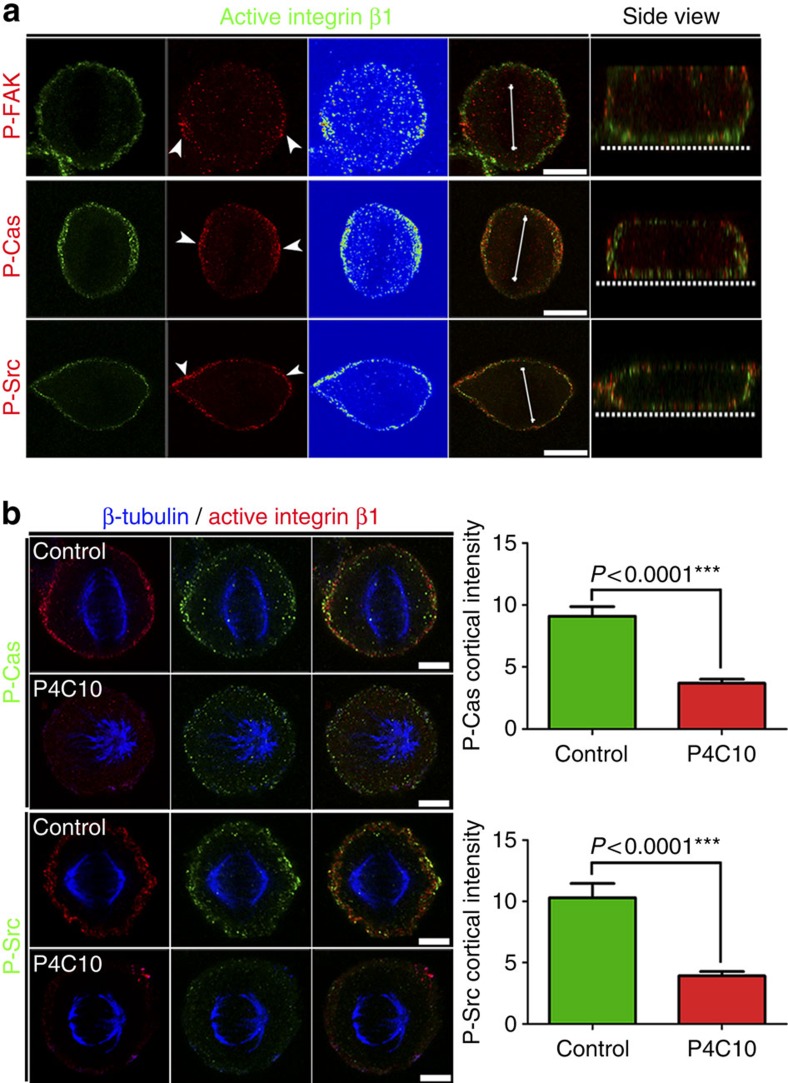
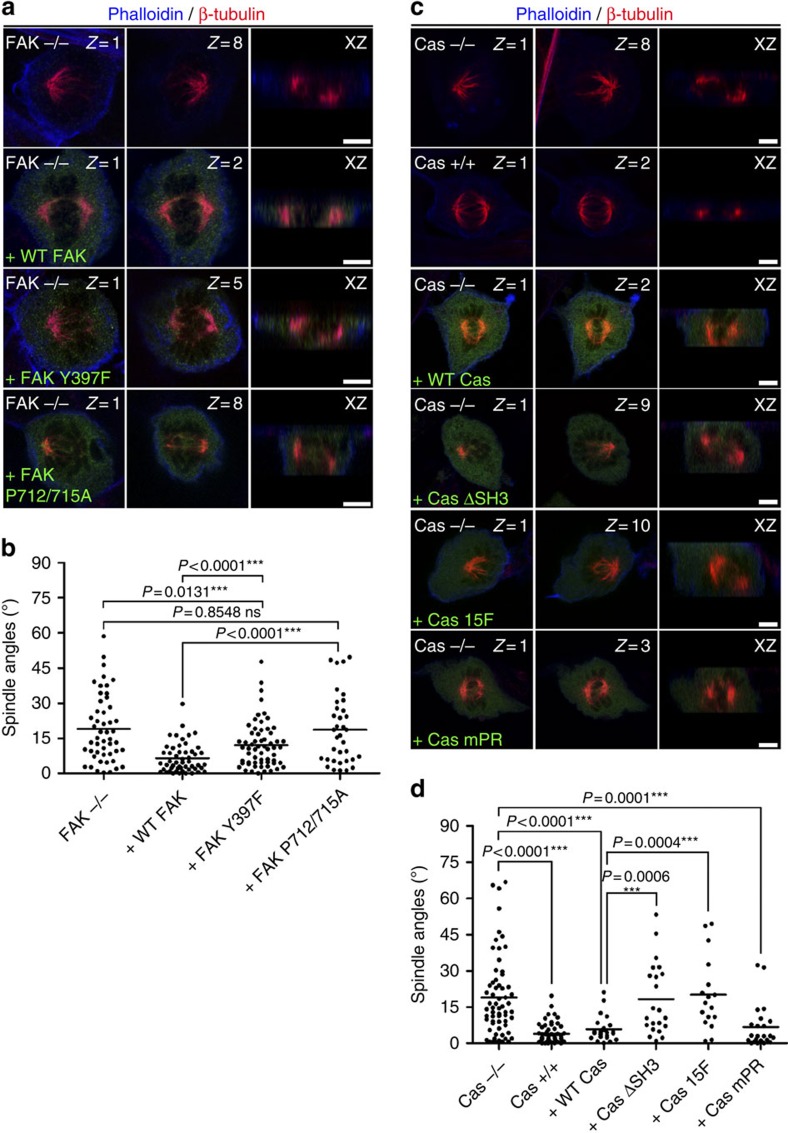
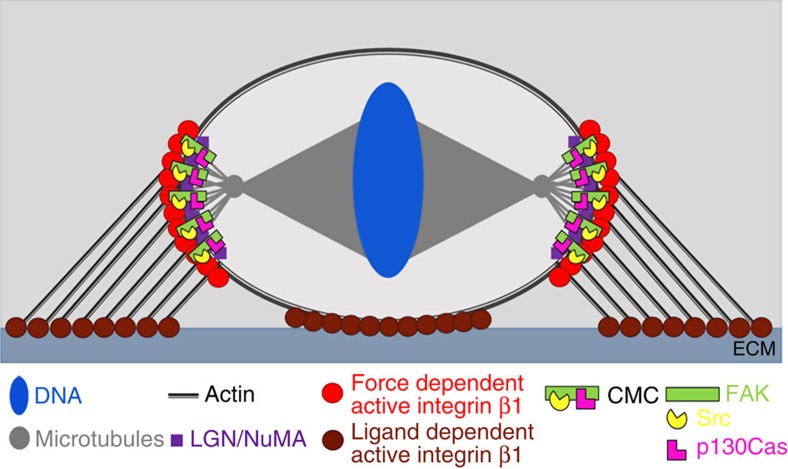
Control of spindle orientation is a fundamental process for embryonic development, morphogenesis and tissue homeostasis, while defects are associated with tumorigenesis and other diseases. Force sensing is one of the mechanisms through which division orientation is determined. Here we show that integrin β1 plays a critical role in this process, becoming activated at the lateral regions of the cell cortex in a ligand-independent manner. This activation is force dependent and polar, correlating with the spindle capture sites. Inhibition of integrin β1 activation on the cortex and disruption of its asymmetric distribution leads to spindle misorientation, even when cell adhesion is β1 independent. Examining downstream targets reveals that a cortical mechanosensory complex forms on active β1, and regulates spindle orientation irrespective of cell context. We propose that ligand-independent integrin β1 activation is a conserved mechanism that allows cell responses to external stimuli.


Figures

Figure 1
Figure 1. Integrin β1 becomes activated at the lateral cortex of mitotic cells.
(a) Representative optical sections, intensity-coded and merged images at the cell–ECM interface and the lateral cortex of interphase HeLa cells stained for active (HUTS-21) and total (AIIB2) integrin β1. (b) Representative optical sections, colour intensity-coded and merged images at the cell–ECM interface, mid-lateral and apical areas of the cortex of metaphase cells stained as indicated. Yellow arrowheads show integrin β1-positive RFs. White arrowheads indicate active β1 at the lateral cortex at the plane of the spindle. Magenta arrowheads show absence of active β1 from the apical cortex. (c) Box-plot of the basal to mid-lateral cortex intensity ratio of active and total integrin β1 in interphase cells and a side view of the cell shown in a (dashed line shows the ECM). Mean±s.e.m.: HUTS-21 1.572±0.05921, n=20; AIIB2 1.158±0.05203, n=20; P values calculated by t-test; n, number of interphase cells, two independent experiments (one-way analysis of variance (ANOVA) for variability between replicates: HUTS-21 P=0.0643, ns, AIIB2 P=0.1955, ns). (d) Box-plot of the mid-lateral to apical cortex intensity ratio of active and total integrin β1 in metaphase cells and a side view of the cell shown in b (dashed line represents the ECM, white arrowheads indicate integrin β1 activation at the lateral cortex, magenta arrowheads show absence of active β1 at the apical areas of the cortex). Mean±s.e.m.: HUTS-21 1.523±0.1099, n=20; AIIB2 1.010±0.03892, n=20; P values calculated by t-test; n, number of metaphase cells, two independent experiments (one-way ANOVA: HUTS-21 P=0.5479, ns, AIIB2 p-0.2055, ns). (e) Box-plot of the basal to mid-lateral cortex intensity ratio of active integrin β1 in interphase and metaphase cells. Mean±s.e.m.: interphase 1.572±0.05921, n=20; metaphase 0.8887±0.04829, n=20; P values calculated by Mann–Whitney test; n, number of cells, two independent experiments (Kruskal–Wallis: interphase P=0.0643, ns, metaphase P=0.2879, ns). Scale bar, 10 μm (a,b) .
Figure 2
Figure 2. Active integrin β1 is distributed asymmetrically at the lateral cortex of mitotic cells.
(a) A representative optical section and a side view of a live metaphase cell expressing histone GFP and stained for active integrin β1 (9EG7). Colour intensity image showing how the polarity crescent of active β1 was correlated with the spindle capture sites and an angular distribution plot of the angle α; mean±s.e.m.: 11.34±1.55°, n=35; n, number of metaphase cells, two independent experiments (two replicates each). (b) Labelling of active β1 in live metaphase cells expressing GFP–LGN and a side view showing active β1 at the cell–ECM interface and co-localization with LGN at the lateral cortex of the cell (white arrowheads). (c) Optical section at the mid-lateral cortex and a side view of a 3D reconstruction of a representative live metaphase cell expressing GFP–Utrophin stained for active β1 (9EG7) showing integrin activation at the areas where the RFs merge with the cell cortex. Scale bar, 10 μm (ac).
Figure 3
Figure 3. Force-dependent activation of cortical integrin β1.
(a) Optical sections and colour intensity-coded images at the cell–ECM interface and mid-lateral cortex of interphase, early mitotic and metaphase cells seeded on L-FN microprints. Arrowheads indicate areas where maximal forces are exerted. (b) Z-stacks and side view of MCF10A cells with attached E-cadherin-coated beads (asterisk) on their apical surface in the absence or presence of a magnet, imaged under the same conditions. The white arrowhead shows AJs formation between the apical surface and the bead. The yellow arrowhead shows β1 activation at apical surface on force application. (c) Box-plot of the apical to basal cortex intensity ratio of active β1 in the presence or absence of force. Mean±s.e.m.: no magnet 0.3745±0.03963, n=17; magnet 0.9211±0.06990, n=20; P values calculated by t-test; n, number of cells, three independent experiments (one-way analysis of variance: no magnet P=0.8469, ns, magnet P=0.5004, ns). (d) Optical sections at the plane of the spindle and colour intensity-coded image of control, NZ or Cyto D-treated cells, imaged under the same conditions. (e) Scatter plot of substrate to spindle angles of the cells in d. Mean±s.e.m.: control 4.696±0.7338°, n=24; NZ 20.60±2.527°, n=23; Cyto D 23.20±4.037°, n=25; P values calculated by Mann–Whitney test; n, number of metaphase cells, two independent experiments (Kruskal–Wallis: Control P=0.1615, ns, NZ P=0.6323, ns, Cyto D P=0.4075, ns). (f) Box-plot of the basal to mid-lateral cortex intensity ratio of active integrin β1 of the cells analysed in e. Mean±s.e.m.: control 0.7807±0.03210, n=24; NZ 0.8597±0.04068, n=23; Cyto D 1.030±0.03908, n=25; P values calculated by t-test; n, number of metaphase cells, two independent experiments (one-way analysis of variance: control P=0.2332, ns, NZ P=0.1480, ns, Cyto D P=0.7993, ns). (g) Correlation of the degree of spindle misorientation with the ratio of basal to mid-lateral cortex intensity of active β1. Pearson's correlation coefficients: control r=−0.0289, weak correlation, NZ r=0.2547 weak correlation, Cyto D r=0.5919 moderate positive correlation. Scale bar, 10 μm (a,b,d).
Figure 4
Figure 4. Inhibition of integrin β1 cortical activation leads to spindle misorientation.
(a) Optical sections at the cell-ECM interface and at the spindle plane, colour intensity-coded images and side views of representative metaphase control or P4C10 antibody-treated HeLa cells seeded on FN or VN. All cells were imaged under the same conditions. Cells were stained with β-tubulin and 9EG7 antibodies. The dashed lines show the cell–ECM interface. (b) Scatter plot of substrate to spindle angles of metaphase cells from the above conditions. Mean±s.e.m.: Control FN 5.920±0.7391°, n=30; P4C10 FN 27.76±4.455°, n=17; Control VN 4.427±0.8606°, n=33; P4C10 VN 22.84±2.824°, n=21; P values calculated by Mann–Whitney test; n, number of metaphase cells, two independent experiments (Kruskal–Wallis: control FN P=0.3414, ns, P4C10 FN P=0.2055, ns, control VN P=0.1060, ns, control VN P=0.6050, ns). (c) Box-plot of the basal to mid-lateral cortex intensity ratio of active integrin β1 of the cells analysed in (b). Mean±s.e.m.: control FN 0.8482±0.04543, n=30; P4C10 FN 1.388±0.1422, n=17; control VN 0.6639±0.02926, n=33; P4C10 VN 0.9175±0.03423, n=21; P values calculated by Mann–Whitney test; n, number of metaphase cells, two independent experiments (Kruskal–Wallis: control FN P=0.0852, ns, P4C10 FN P=0.3592, ns, control VN P=0.3051, ns, P4C10 VN P=0.5787, ns). (d) Correlation of the spindle angle and the ratio of basal to mid-lateral cortex intensity of active integrin β1. Pearson's correlation coefficient: control FN r=0.1755 weak correlation, control VN r=0.2006 weak correlation, P4C10 FN r=0.5601 moderate positive correlation, P4C10 VN r=0.645 moderate positive correlation. Scale bar, 5 μm (a).
Figure 5
Figure 5. Disruption of the asymmetric distribution of cortically active β1 leads to spindle misorientation.
(a) Optical sections at the RF and spindle planes of control and treated metaphase cells with RGD 50 μg ml−1, RGD 10 μg ml−1, 9EG7 antibody, RGD 10 μg ml−1+9EG7 antibody. (b) Colour intensity-coded optical sections at the spindle plane and side views from metaphase cells under the conditions in a. All cells were imaged under the same conditions. The dashed lines show the cell–ECM interface. Yellow arrowheads indicate β1 activation throughout the cortex. (c) Box-plot of the cell–matrix contact area. Mean±s.e.m.: control 278.4±24.09 μm2, n=35; RGD 50 μg ml−1 235.0±19.48 μm2, n=40; RGD 10 μg ml−1 298.6±20.95 μm2, n=54; 9EG7 225.1±18.42 μm2, n=48; RGD 10 μg ml−1+9EG7 216.5±11.43 μm2, n=53; P values calculated by Mann–Whitney test; n, number of metaphase cells, three independent experiments (Kruskal–Wallis: control P=0.0997, ns, RGD 50 μg ml−1 P=0.1880, ns, RGD 10 μg ml−1 P=0.7515, ns, 9EG7 P=0.1049, ns, RGD 10 μg ml−1+9EG7 P=0.0557, ns). (d) Scatter plot of substrate to spindle angles of cells analysed in c. Mean±s.e.m.: control 7.607±1.163°, n=35; RGD 50 μg ml−1 23.91±3.219°, n=40; RGD 10 μg ml−1 7.100±0.9431°, n=54; 9EG7 6.385±0.7696°, n=48; RGD 10 μg ml−1+9EG7 21.97±2.408°, n=53; P values calculated by Mann–Whitney test; n, number of metaphase cells, three independent experiments (Kruskal–Wallis: control 0.5484, ns, RGD 50 μg ml−1 P=0.5495, ns, RGD 10 μg ml−1 P=0.6883, ns, 9EG7 P=0.5275, ns, RGD 10 μg ml−1+9EG7 P=0.8523, ns). (e) Box-plot of the apical to mid-lateral cortex intensity ratio of the cells in b. Mean±s.e.m.: Control 1.438±0.09659, n=21; RGD 50 μg ml−1 0.9443±0.04263, n=19; RGD 10 μg ml−1 1.393±0.08771, n=20; 9EG7 1.222±0.04880, n=20; RGD 10 μg ml−1+9EG7 0.9646±0.05918, n=19; P values calculated by Mann–Whitney test; n, number of metaphase cells, two independent experiments (Kruskal–Wallis: Control P=0.9148, ns, RGD 50 μg ml−1 P=0.0777, ns, RGD 10 μg ml−1 P=0.5638, ns, 9EG7 P=0.4708, RGD 10 μg ml−1+9EG7 P=0.3762, ns). Scale bars 10 μm (a), 5 μm (b).
Figure 6
Figure 6. Force-dependent and ligand-independent activation of integrin β1 on the lateral mitotic cortex.
(a) Optical sections of MCF10A metaphase cells with attached E-cadherin-coated magnetic beads (asterisk) in the presence or absence of a magnet. The white arrowhead indicates β1 activation at the apical surface. (b) Scatter plot of substrate to spindle angles for the cells shown in (a). Mean±s.e.m.: no magnet 4.604±0.6672°, n=25; magnet 22.91±1.745°, n=67; number of metaphase cells, three independent experiments (Kruskal–Wallis: no magnet P=0.0963, ns, magnet P=0.5604, ns) (c) Box-plot of the ratio of apical to mid-lateral cortex intensity of active β1 for the cells in a. Mean±s.e.m.: no magnet 0.6418±0.02712, n=25; magnet 1.256±0.03875, n=67; P values calculated by Mann–Whitney test; n, number of metaphase cells, three independent experiments (Kruskal–Wallis: no magnet P=0.5099, ns, magnet P=0.7475, ns). (d) Confocal images of MCF10A interphase cells seeded on FN or E-cadherin-Fc-coated silanized coverslips. (e) Side view of an MCF10A metaphase cell seeded on E-cadherin-Fc and box-plots of basal/apical and mid-lateral/apical cortex intensity ratio of active β1 on FN versus E-cadherin substrate. Mean±s.e.m.: basal/apical: FN 1.260±0.07387, n=21; E-cadherin 0.9181±0.03399, n=21; mid-lateral/apical: FN 1.800±0.1238, n=21; E-cadherin 1.948±0.1149, n=21; P values calculated by Mann–Whitney test; n, number of metaphase cells, three independent experiments (Kruskal–Wallis for basal/apical: FN P=0.4231, ns, E-cadherin P=0.3451, ns; for mid-lateral/apical: FN P=0.7960, ns, E-cadherin P=0.754 ns). (f) Optical sections at the Xenopus outermost epithelial layer, innermost epithelial layer, basal surface of the inner epithelial layer and a side view. (g) Optical section at the mid-lateral cortex of a mitotic cell of the Xenopus outermost epithelium. (h) Representative top views of mitotic control cells (histone GFP injected) or cells injected with integrin β1 dominant-negative (HAβ1-DN) of the Xenopus epidermis and a scatter plot of the apical surface to spindle angles of these cells. Mean±s.e.m.: control 10.06±1.758°, n=23; HAβ1-DN 30.66±3.389°, n=41; P value analysed by Mann–Whitney test; n, number of metaphase cells, two independent experiments (Kruskal–Wallis: Control P=0.7215, ns, HAβ1 P=0.92 ns). Scale bar, 5 μm (a,e), 10 μm (d,fh).
Figure 7
Figure 7. An integrin β1-based cortical mechanosensory complex is formed at the lateral cortex of mitotic cells.
(a) Optical sections, colour intensity-coded images and side views of representative metaphase HeLa cells co-stained for active β1 and phosphorylated active forms of FAK, Cas or Src. The white arrowheads indicate the polarized cortical crescent of the phosphorylated forms of the above proteins. The white line represents the metaphase plate and the dashed line shows the basal surface. (b) Optical sections at the spindle plane of metaphase control HeLa cells or cells treated with the P4C10 antibody. All cells were imaged under the same conditions. Cells were co-stained for β-tubulin, active β1 (9EG7) and phosphorylated Cas or Src. The plots show the average cortical intensity of P-Cas and P-Src in control and P4C10-treated cells. mean±s.e.m.: P-Cas control 9.106±0.7618, n=33; P-Cas P4C10 3.691±0.3323, n=34; P-Src control 10.30±1.155, n=35; P-Src P4C10 3.916±0.3537, n=30. Analysed by Mann–Whitney test; n, number of metaphase cells, two independent experiments (Kruskal–Wallis: for P-Cas Control P=0.0715, ns, P4C10 P=0.2177, ns; for P-Src Control P=0.0657, ns, P4C10 P=0.2510, ns). Scale bar, 10 μm (a), 5 μm (b).
Figure 8
Figure 8. Interactions between the members of the CMC guide mitotic spindle orientation.
(a) Optical sections at the plane of each spindle pole and side views of FAK nulls, or FAK nulls transfected with the indicated constructs (signal shown in green) stained for β-tubulin and actin. (b) Scatter plot of the substrate to spindle angles of metaphases cells described in a. Mean±s.e.m.: FAK−/− 19.04±2.028°, n=50; FAK−/− +WT FAK 6.507±0.8685°, n=52; FAK−/− +FAK Y397F 12.14±1.263°, n=61; FAK−/− +FAK P712/715 A 18.63±2.501°, n=35; P values calculated by Mann–Whitney test; n, number of metaphase cells, two independent experiments (Kruskal–Wallis: FAK−/− P=0.5405, ns, +WT FAK P=0.2432, ns, +FAK Y397F P=0.1732, ns, +FAK P712/715 A P=0.0.8886, ns). (c) Optical sections at the plane of each spindle pole and side views of Cas nulls, Cas reconstituted cells or Cas nulls transfected with the indicated constructs (shown in green) stained for β-tubulin and actin. (d) Scatter plot of the substrate to spindle angles of metaphases cells described in c. Mean±s.e.m.: Cas−/− 18.97±2.102°, n=63; Cas+/+ 3.825±0.5526°, n=57; Cas−/−+WT Cas 5.805±1.062°, n=24; Cas−/−+Cas ΔSH3 18.24±3.173°, n=22; Cas−/−+Cas 15 F 20.09±3.660°, n=17; Cas−/−+Cas mPR 6.703±1.882°, n=23; P values calculated by Mann–Whitney test; n, number of metaphase cells, two independent experiments (Kruskal–Wallis: Cas−/− P=0.6765, ns, Cas+/+ P=0.1978, ns, +WT Cas P=3967, ns, +Cas ΔSH3 P=0.7745, ns, +Cas 15 F P=0.2913, ns, +Cas mPR P=0.1564, ns). Scale bar, 5 μm (a,c).
Figure 9
Figure 9. Ligand-independent integrin β1 activation guides spindle orientation.
Schematic illustration of the distribution of the two pools of active integrin β1 in mitotic cells: Ligand-dependent active β1 is localized at the cell–ECM interphase whereas the ligand-independent and force-dependent active β1 is enriched at the areas where the RFs terminate on the lateral cortex and specifically enriched at the spindle capture sites. Integrin β1 activation on the lateral cortex results in the establishment of the CMC, which guides spindle capture in response to force.

Similar articles

Cited by

References

    1. Morin X. & Bellaiche Y. Mitotic spindle orientation in asymmetric and symmetric cell divisions during animal development. Dev. Cell 21, 102–119 (2011). - PubMed
    1. Pease J. C. & Tirnauer J. S. Mitotic spindle misorientation in cancer--out of alignment and into the fire. J. Cell Sci. 124, 1007–1016 (2011). - PubMed
    1. McNally F. J. Mechanisms of spindle positioning. J. Cell Biol. 200, 131–140 (2013). - PMC - PubMed
    1. Fink J. et al. External forces control mitotic spindle positioning. Nat. Cell Biol. 13, 771–778 (2011). - PubMed
    1. Petridou N. I. & Skourides P. A. FAK transduces extracellular forces that orient the mitotic spindle and control tissue morphogenesis. Nat. Commun. 5, 5240 (2014). - PubMed

Publication types

LinkOut - more resources