. 2016 Mar 8:7:10976.
doi: 10.1038/ncomms10976.

A general approach to visualize protein binding and DNA conformation without protein labelling

Affiliations

A general approach to visualize protein binding and DNA conformation without protein labelling

Dan Song et al. Nat Commun. .

Abstract

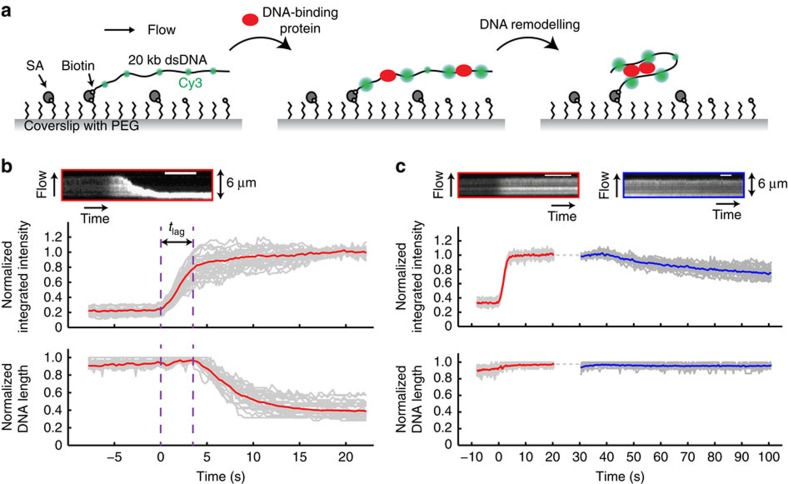
Single-molecule manipulation methods, such as magnetic tweezers and flow stretching, generally use the measurement of changes in DNA extension as a proxy for examining interactions between a DNA-binding protein and its substrate. These approaches are unable to directly measure protein-DNA association without fluorescently labelling the protein, which can be challenging. Here we address this limitation by developing a new approach that visualizes unlabelled protein binding on DNA with changes in DNA conformation in a relatively high-throughput manner. Protein binding to DNA molecules sparsely labelled with Cy3 results in an increase in fluorescence intensity due to protein-induced fluorescence enhancement (PIFE), whereas DNA length is monitored under flow of buffer through a microfluidic flow cell. Given that our assay uses unlabelled protein, it is not limited to the low protein concentrations normally required for single-molecule fluorescence imaging and should be broadly applicable to studying protein-DNA interactions.


Figures

Figure 1
Figure 1. Rationale and validation of the single-molecule PIFE assay.
(a) Left: a 20-kilobase (kb) dsDNA sparsely labelled with Cy3 dyes (green) is tethered to the surface of a functionalized glass coverslip and extended under a buffer flow. PEG, polyethylene glycol; SA, streptavidin. Middle: on addition of unlabelled DNA-binding proteins (red), fluorescence of the Cy3 dyes increases due to nearby protein binding and the resulting PIFE effect. Right: protein-induced changes in DNA conformation can be simultaneously monitored. Figures are not drawn to scale. (b) Binding of wild-type Spo0J (100 nM) to Cy3-labelled DNAs. Top: kymograph of a single DNA. Scale bar, 6 s. Bottom: trajectories of individual DNAs (grey) and the average over all trajectories (red). Integrated intensity and DNA length were normalized to the maximum values in individual trajectories. Time zero was defined as the starting point of protein association. tlag, lag time between protein binding and initiation of DNA compaction. (c) Interaction between Spo0J R82A (100 nM) and Cy3-labelled DNAs. Top: kymographs of a single DNA molecule showing protein association (red) under the same conditions as in b and dissociation after correction for photobleaching (blue) in binding buffer without any protein. Scale bar, 6 s. Bottom: trajectories of individual DNAs (grey) and average (red or blue). Dotted grey line indicates time when changing to the dissociation buffer after a brief stop in flow.
Figure 2
Figure 2. Measuring the binding affinity (Kd) of the Spo0J R82A mutant on individual DNA molecules.
(a) Trajectories of integrated intensity measuring association of Spo0J R82A at indicated concentrations to Cy3-labelled DNAs in binding buffer containing 150 mM NaCl. Each trajectory was averaged over 20–30 DNAs. Fold increase in integrated intensity was calculated by dividing each trajectory by the value averaged for the first few seconds before protein binding. Time zero was defined as the starting point of protein association. (b) Fold increase in integrated intensity at steady state after subtracting the baseline (onefold) fitted with a Hill equation (see Methods). (c) Observed rate constant for association (kobs) and linear fit (red line), to obtain the rate constant for association (kon). (d) Rate constant for dissociation (koff) and linear fit (red line). The average value was estimated from the y intercept, as the slope does not significantly differ from zero. All data points shown in bd are mean±s.e.m. between at least three replicates.
Figure 3
Figure 3. Dual binding modes of HBsu revealed by the single-molecule PIFE assay.
(a) Trajectories and kymographs showing interactions between HBsu at indicated concentrations and the Cy3-labelled DNAs. Each trajectory was averaged over 20–30 DNAs. Fold increase in integrated intensity (top) and normalized DNA length (bottom) were calculated by dividing each trajectory by the values averaged for the first few seconds before protein binding. Time zero was defined as the starting point of protein association. Scale bar, 10 s. (b) Steady-state measurements of fold increase in integrated intensity (top) and in DNA length (bottom) at different concentrations (log-scale) of HBsu, fitted with a two-state binding model (red line). All data points shown are mean±s.e.m. between at least three replicates.
Figure 4
Figure 4. Biphasic dissociation of HBsu.
Trajectories (log-scale in time) and kymographs showing dissociation of HBsu at indicated concentrations from the Cy3-labelled DNAs when washing with binding buffer without any protein. Each trajectory was corrected for photobleaching and averaged over 20–30 DNAs. Integrated intensity (top) and DNA length (bottom) were normalized by the maximum values. Time zero was defined as the starting point of protein dissociation and was shifted by 10 s for visualization. Scale bar, 10 s. Purple dotted lines indicate transitions from the fast to the slow dissociation phase for high protein concentrations.

References

    1. Gruber S. Multilayer chromosome organization through DNA bending, bridging and extrusion. Curr. Opin. Microbiol. 22, 102–110 (2014). - PubMed
    1. Song D. & Loparo J. J. Building bridges within the bacterial chromosome. Trends Genet. 31, 164–173 (2015). - PubMed
    1. Wang X., Montero Llopis P. & Rudner D. Z. Organization and segregation of bacterial chromosomes. Nat. Rev. Genet. 14, 191–203 (2013). - PMC - PubMed
    1. Forget A. L. & Kowalczykowski S. C. Single-molecule imaging brings Rad51 nucleoprotein filaments into focus. Trends Cell Biol. 20, 269–276 (2010). - PMC - PubMed
    1. Robinson A. & van Oijen A. M. Bacterial replication, transcription and translation: mechanistic insights from single-molecule biochemical studies. Nat. Rev. Microbiol. 11, 303–315 (2013). - PubMed

Publication types

MeSH terms

LinkOut - more resources