. 2016 Jun:95:43-54.
doi: 10.1016/j.freeradbiomed.2016.02.032. Epub 2016 Mar 4.

Glutathione-deficient Plasmodium berghei parasites exhibit growth delay and nuclear DNA damage

Affiliations

Glutathione-deficient Plasmodium berghei parasites exhibit growth delay and nuclear DNA damage

Vivian Padín-Irizarry et al. Free Radic Biol Med. 2016 Jun.

Abstract

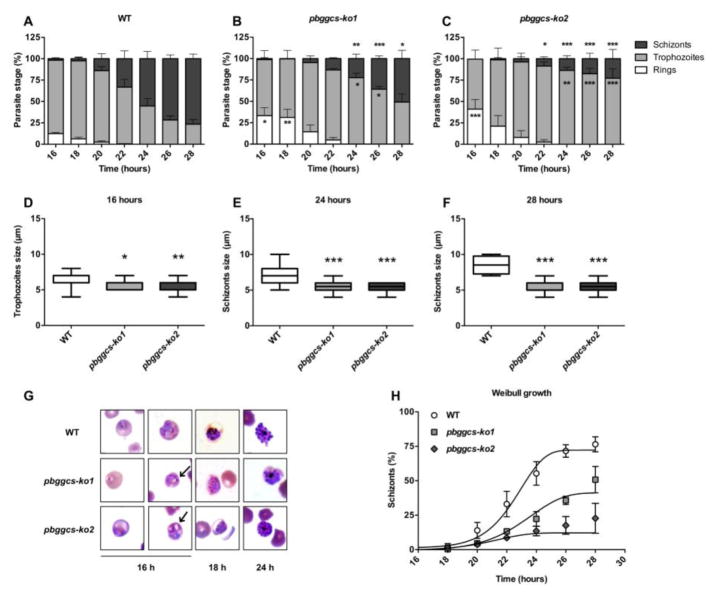
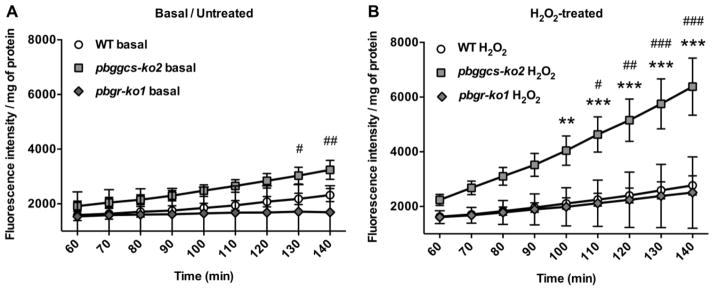
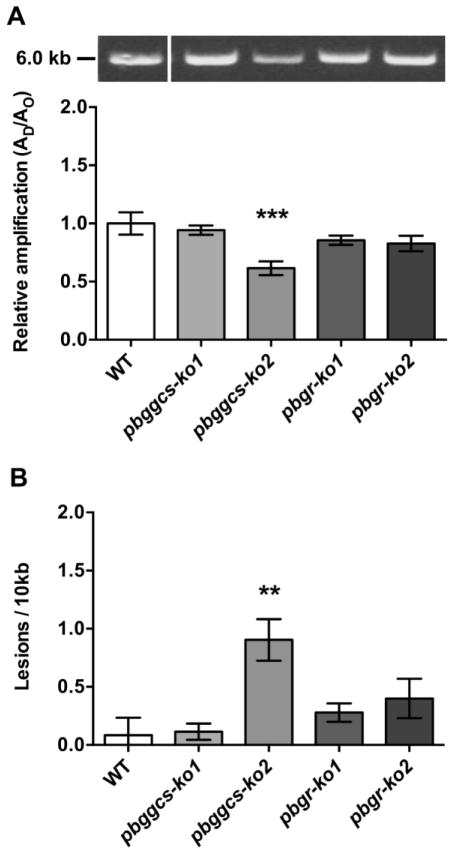
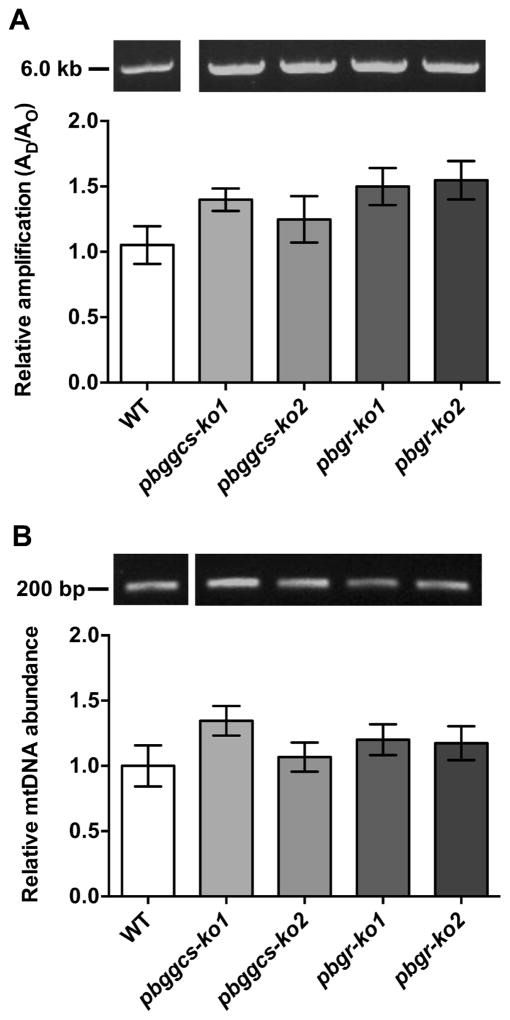
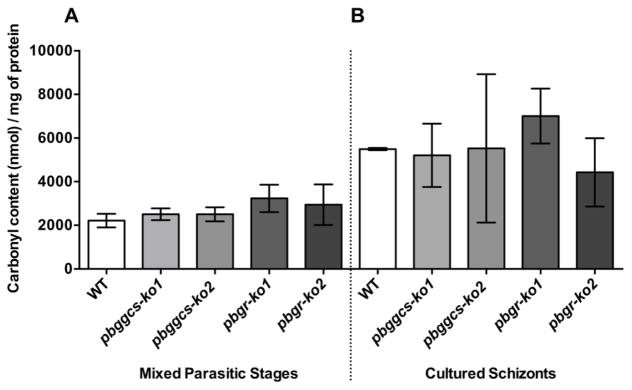
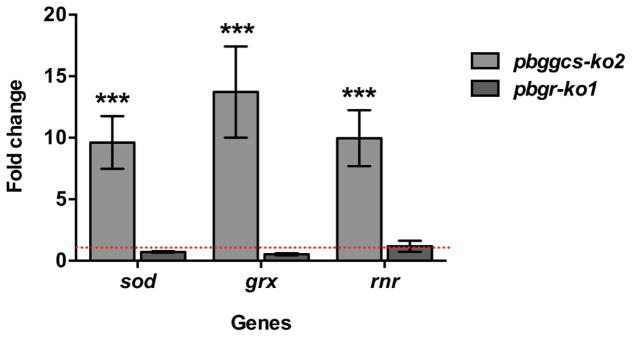
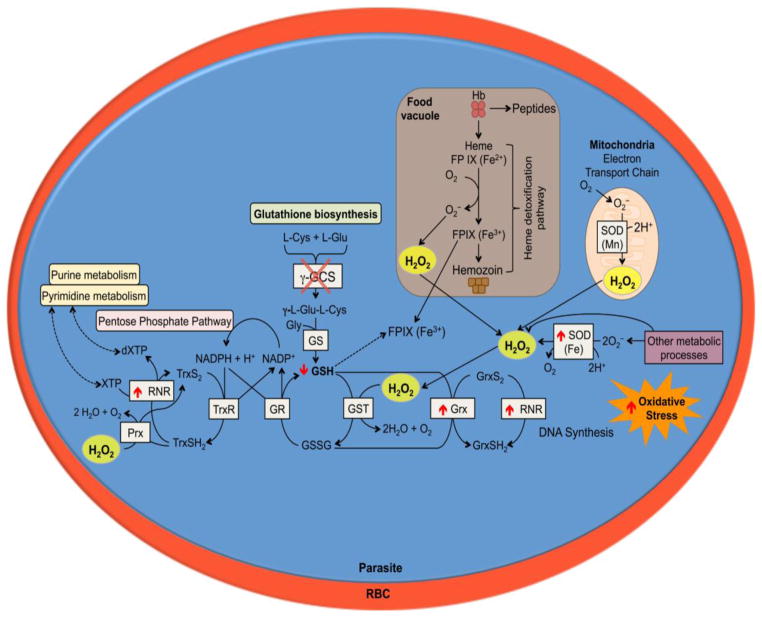
Plasmodium parasites are exposed to endogenous and exogenous oxidative stress during their complex life cycle. To minimize oxidative damage, the parasites use glutathione (GSH) and thioredoxin (Trx) as primary antioxidants. We previously showed that disruption of the Plasmodium berghei gamma-glutamylcysteine synthetase (pbggcs-ko) or the glutathione reductase (pbgr-ko) genes resulted in a significant reduction of GSH in intraerythrocytic stages, and a defect in growth in the pbggcs-ko parasites. In this report, time course experiments of parasite intraerythrocytic development and morphological studies showed a growth delay during the ring to schizont progression. Morphological analysis shows a significant reduction in size (diameter) of trophozoites and schizonts with increased number of cytoplasmic vacuoles in the pbggcs-ko parasites in comparison to the wild type (WT). Furthermore, the pbggcs-ko mutants exhibited an impaired response to oxidative stress and increased levels of nuclear DNA (nDNA) damage. Reduced GSH levels did not result in mitochondrial DNA (mtDNA) damage or protein carbonylations in neither pbggcs-ko nor pbgr-ko parasites. In addition, the pbggcs-ko mutant parasites showed an increase in mRNA expression of genes involved in oxidative stress detoxification and DNA synthesis, suggesting a potential compensatory mechanism to allow for parasite proliferation. These results reveal that low GSH levels affect parasite development through the impairment of oxidative stress reduction systems and damage to the nDNA. Our studies provide new insights into the role of the GSH antioxidant system in the intraerythrocytic development of Plasmodium parasites, with potential translation into novel pharmacological interventions.

Keywords: DNA damage; Glutathione; Growth delay; Malaria; Oxidative stress; Plasmodium berghei; Protein carbonylations.


Conflict of interest statement

Competing interests

The authors have no competing interests to declare.

Figures

Figure 1
Figure 1. In vitro development of WT and pbggcs-ko parasites
(A–C) Percentage of intraerythrocytic stages of WT (A), pbggcs-ko1 (B), and pbggcs-ko2 (C) parasites throughout a 28 h time course. Three morphological stages were distinguished by microscopy: rings (white bars), trophozoites (light grey bars), and schizonts (dark grey bars). (D–F) The size of trophozoites and schizonts stages from WT (white box), pbggcs-ko1 (light grey box) and pbggcs-ko2 (dark grey box) parasites are shown at 16 (D), 24 (E) and 28 h (F) (n=20). (G) Representative images of intraerythrocytic stages of WT, pbggcs-ko1 and pbggcs-ko2 parasites at 16, 24 and 28 h of in vitro culture. Cytoplasmic vacuoles are indicated by arrows. (H) Weibull growth model for the percentage of schizonts for WT (circle), pbggcs-ko1 (square) and pbggcs-ko2 (diamond) parasites. Significant differences were observed between the WT parasites and the pbggcs-ko1 and pbggcs-ko2 mutant parasites (*p<0.05, **p<0.01, ***p<0.001) analyzed by Two-way repeated measures ANOVA with Bonferroni multiple comparison test. Bars represent the SEM from 3 independent experiments.
Figure 2
Figure 2. P. berghei ggcs-ko parasites show increased levels of intracellular oxidative stress
DCF fluorescence intensity was determined at various time points in basal/untreated and H2O2-treated in vitro cultures of WT, pbggcs-ko2 and pbgr-ko1 parasites. Cultures were treated with 2 mM H2O2 for 1 h. (A) Basal levels of DCF fluorescence in WT, pbggcs-ko2 and pbgr-ko1 parasites. (B) H2O2-induced DCF fluorescence intensity in WT, pbggcs-ko2 and pbgr-ko1 parasites. Significant differences were observed between the H2O2-treated WT and pbggcs-ko2 (**p<0.01, ***p<0.001) and pbggcs-ko2 and pbgr-ko1 mutant parasites (#p<0.05, ##p<0.01, ###p<0.001) at different time points analyzed by Two-way repeated measures ANOVA with Bonferroni multiple comparison test. Bars represent the SD from 2 (pbgr-ko1) and SEM from 4 (pbggcs-ko2) independent experiments.
Figure 3
Figure 3. P. berghei ggcs-ko2 mutant shows increased levels of nDNA damage
(A) Upper panel, representative gel showing the amplification of a 6.1 kb nDNA fragment of the seryl t-RNA synthetase gene from WT, pbggcs-ko and pbgr-ko parasites. Lower panel, relative amplification levels of the 6.1 kb nDNA fragment from WT and mutant parasites. (B) Frequency of nDNA lesions per 10 kb per strand was calculated as described in Materials and Methods. Representative results of the 6.1 kb amplified fragment are shown in the upper panel. The 6 kb molecular weight marker is indicated in the left. Significant differences were observed between WT and pbggcs-ko2 parasites (**p<0.01, ***p<0.001) analyzed by One-way ANOVA with Bonferroni multiple comparison test. Bars represent the SEM from 3 independent experiments and 10 QPCR analyses.
Figure 4
Figure 4. Mutant parasites show no changes in the levels of mtDNA damage or mtDNA abundance
(A) Upper panel, representative gel showing the amplification of a 5.7 kb mtDNA fragment from WT, pbggcs-ko and pbgr-ko parasites. Lower panel, relative amplification of a 5.7 kb mtDNA fragment that was normalized for changes in mtDNA abundance. (B) Upper panel, representative gel showing the amplification of the 186 bp mtDNA fragment. Lower panel, relative amplification of a 186 bp mtDNA fragment representative of mitochondrial abundance. No significant differences in mtDNA damage or mtDNA abundance were observed between WT and mutant parasites. Bars represent the SEM from 3 independent experiments, and 14 and 12 QPCR analyses for mtDNA damage or mtDNA abundance, respectively.
Figure 5
Figure 5. Levels of protein carbonylation in intraerythrocytic stages from WT and mutant parasites
Levels of protein carbonylation were assessed in WT, pbggcs-ko, and pbgr-ko parasites using the FTC fluorescent assay. Panel A: protein carbonyl content in intraerythrocytic asynchronous blood stages. Panel B: protein carbonyl content in cultured schizonts. No significant differences in the levels of protein carbonylations were observed between WT and mutant intraerythrocytic asynchronous parasites and cultured schizonts. Bars represent the SEM of 4 independent experiments from intraerythrocytic stages and SD of 2 independent experiments from cultured schizonts.
Figure 6
Figure 6. P. berghei ggcs-ko parasites show upregulated levels of sod, grx and rnr mRNA expression
The relative gene expression was determined by RT-qPCR and expressed as fold change for the pbggcs-ko2 and pbgr-ko2 as compared to WT. The data was normalized against the expression of 18S rRNA. The sod (superoxide dismutase), grx (glutaredoxin) and rnr (ribonucleotide reductase) genes showed increased gene expression in the pbggcs-ko2 mutant parasites (***p<0.001) analyzed by Two-way ANOVA with Bonferroni multiple comparison test. Bars represent the SEM from 3 independent experiments. Red dotted line represents the expression level in WT parasites.
Figure 7
Figure 7. Proposed effects of GSH deficiency in P. berghei during asexual blood stages
Representation of the P. berghei intracellular blood stage with the biochemical processes involved in the antioxidant defense. The red circle represents the red blood cell and the blue circle represents the parasite and the biochemical antioxidant pathways. The pbggcs-ko mutant parasites with significantly low GSH levels exhibit growth delay during intraerythrocytic development probably due to an impaired response to oxidative stress and nDNA damage. As a result of increased oxidative stress, the pbggcs-ko mutant parasites increase expression of sod for cytosolic dismutation of the superoxide, and grx and rnr to support dNTP synthesis. These events may be necessary to sustain development of P. berghei parasite in the absence of GSH.

Similar articles

Cited by

References

    1. World Health Organization (WHO) [accessed 11.19.14];World Malaria Report 2014. 2014 http://www.who.int/malaria/publications/world_malaria_report_2014/en/ind....
    1. Becker K, Tilley L, Vennerstrom JL, Roberts D, Rogerson S. Oxidative stress in malaria parasite-infected erythrocytes: host-parasite interactions. Int J Parasitol. 2004;34:163–189. - PubMed
    1. Müller S. Redox and antioxidant systems of the malaria parasite Plasmodium falciparum. Mol Microbiol. 2004;53(5):1291–305. - PubMed
    1. Tilley L, Loria P, Foley M, editors. Antimalarial Chemotherapy. Vol. 2001. Humana Press; 2001. Chloroquine and other quinoline antimalarials; pp. 87–121.
    1. Krauth-Siegel RL, Bauer H, Schirmer RH. Dithiol proteins as guardians of the intracellular redox milieu in parasites: old and new drug targets in trypanosomes and malaria-causing plasmodia. Angew Chem Int Ed Engl. 2005;44:690–715. - PubMed

Publication types

MeSH terms