. 2016 Jul;1863(7 Pt B):1772-81.
doi: 10.1016/j.bbamcr.2016.03.002. Epub 2016 Mar 4.

Epigenetic response to environmental stress: Assembly of BRG1-G9a/GLP-DNMT3 repressive chromatin complex on Myh6 promoter in pathologically stressed hearts

Affiliations

Epigenetic response to environmental stress: Assembly of BRG1-G9a/GLP-DNMT3 repressive chromatin complex on Myh6 promoter in pathologically stressed hearts

Pei Han et al. Biochim Biophys Acta. 2016 Jul.

Abstract

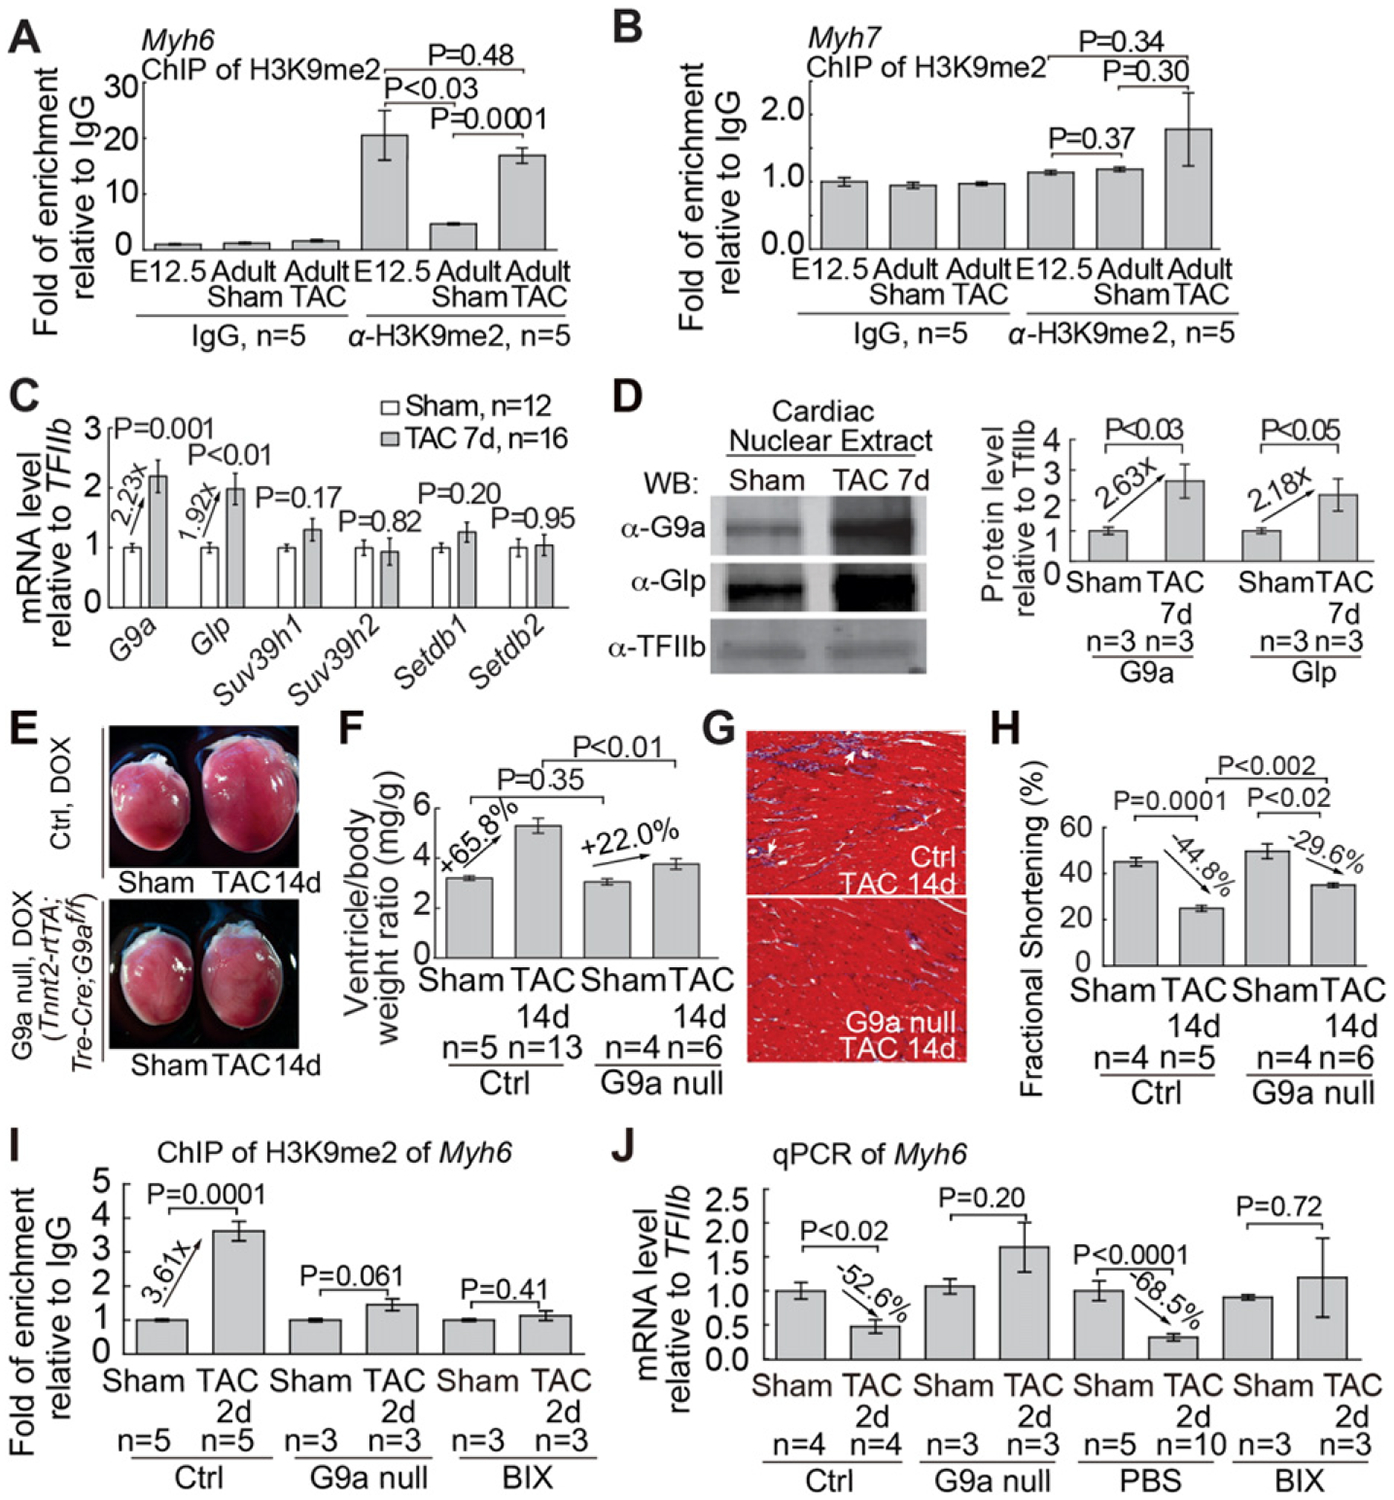
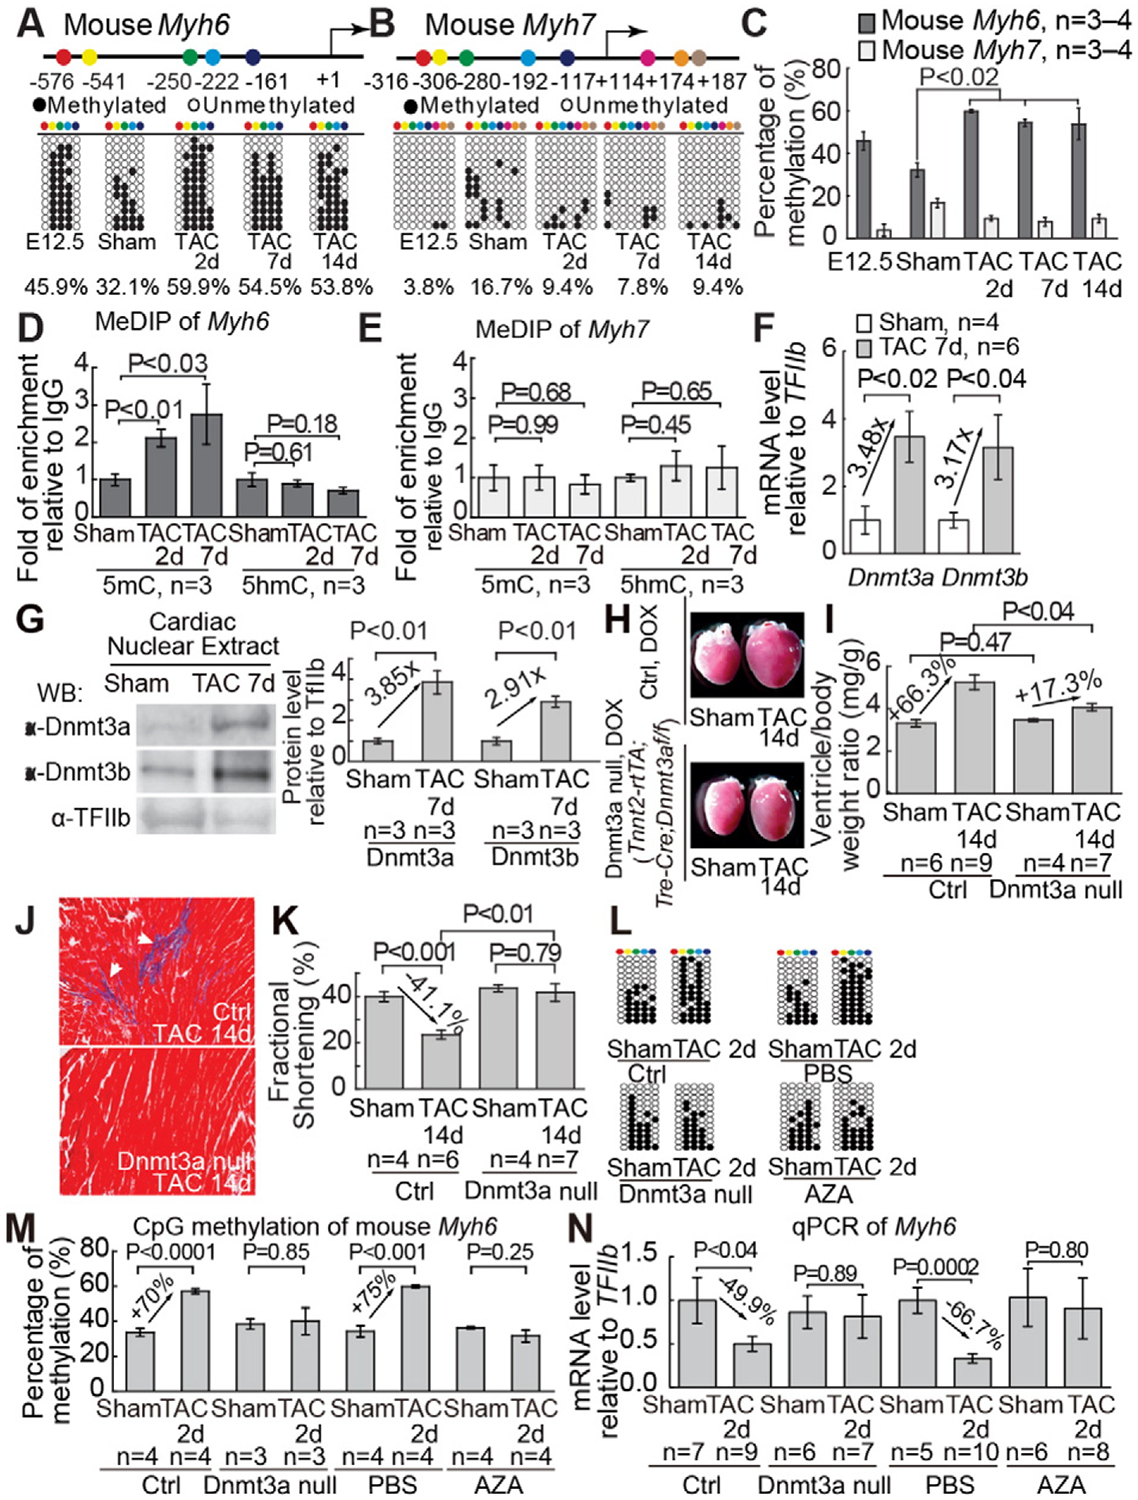
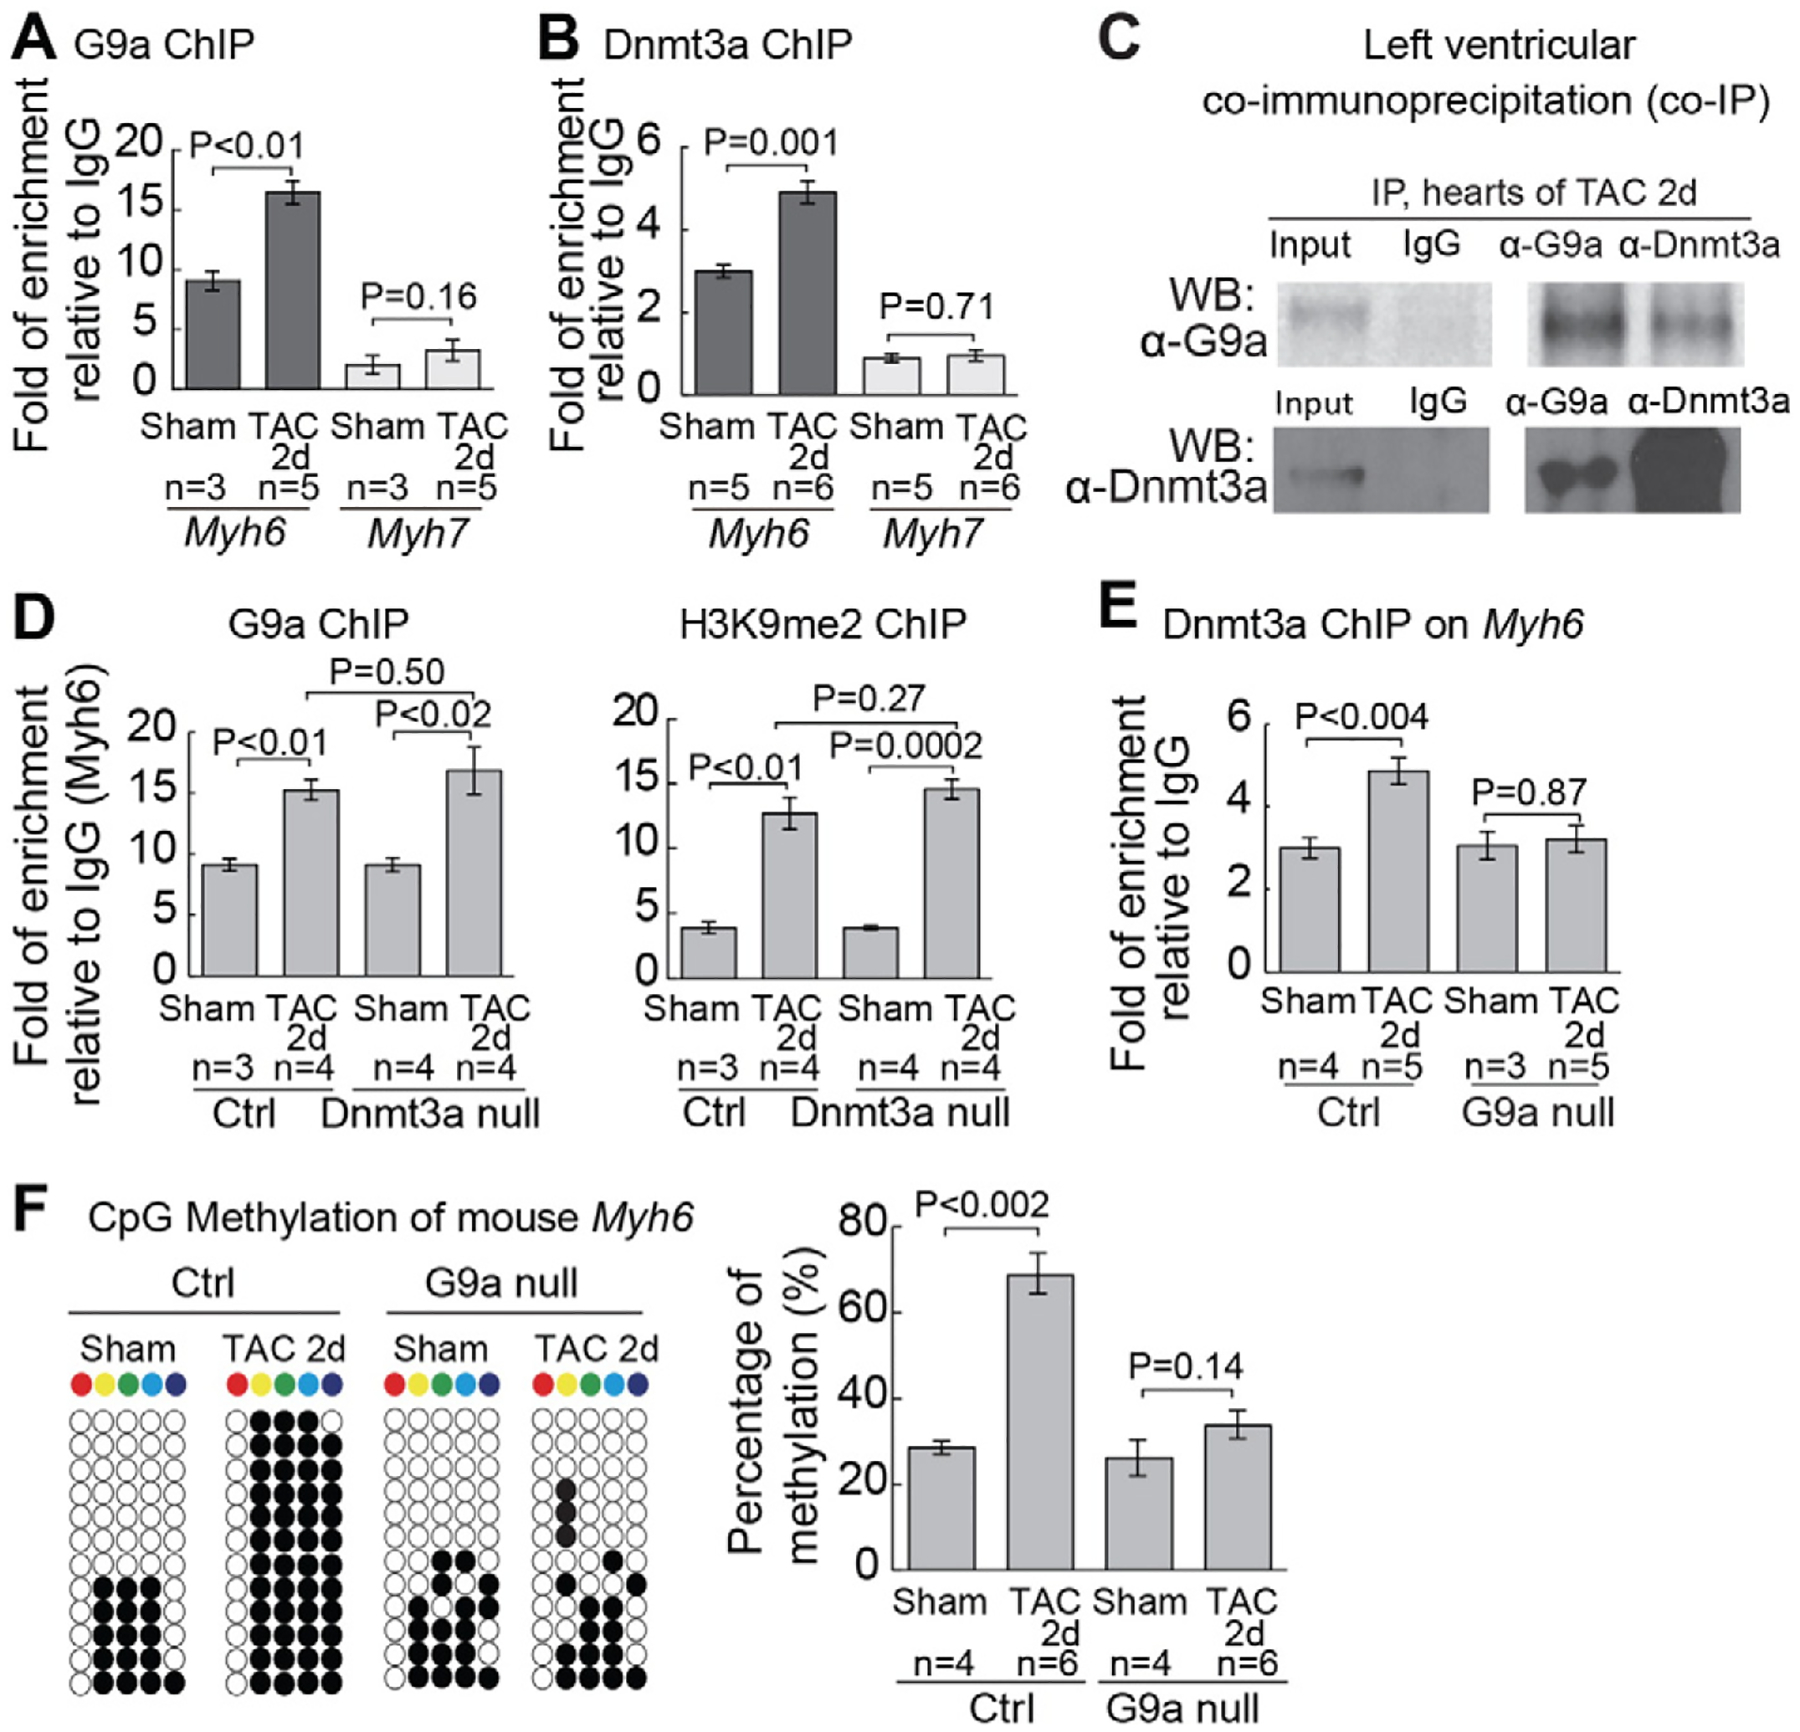
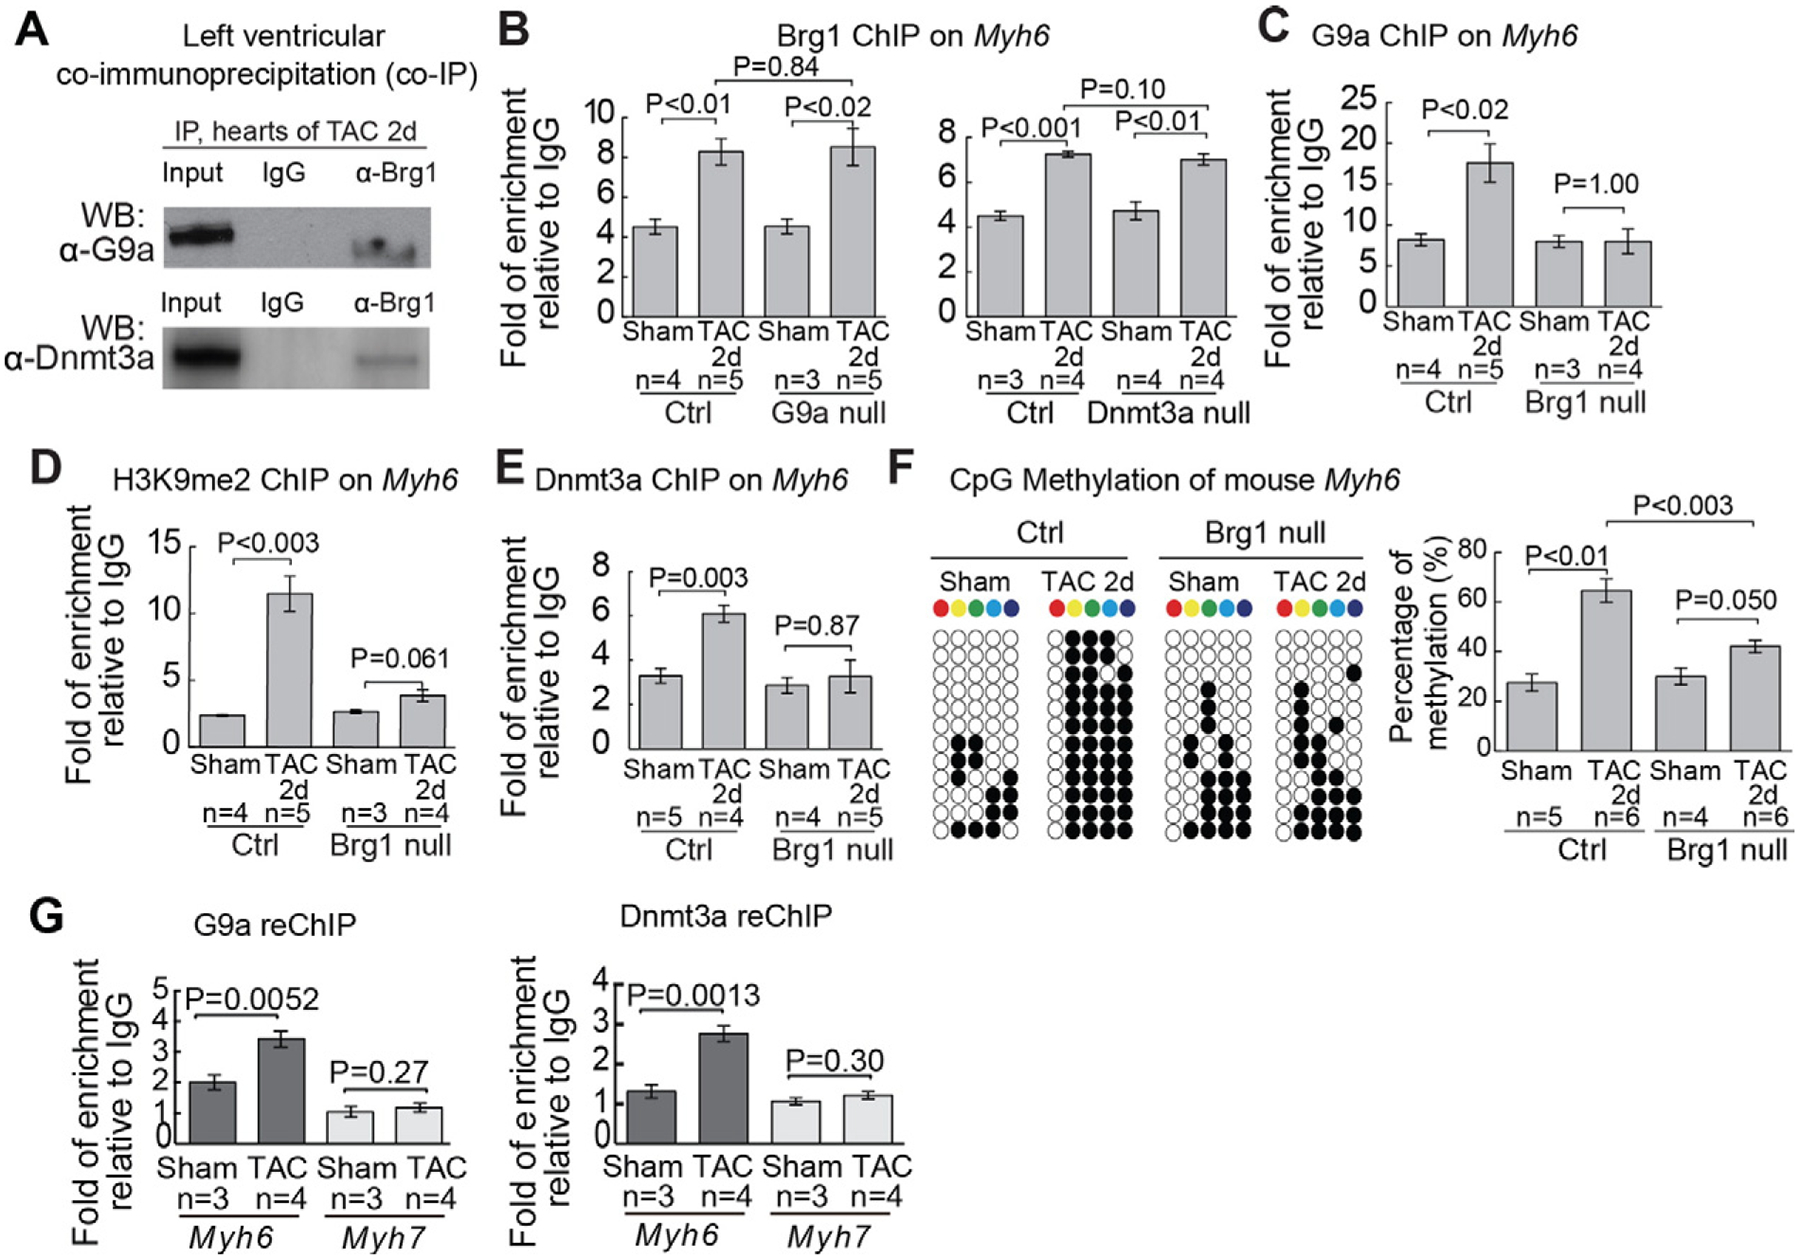
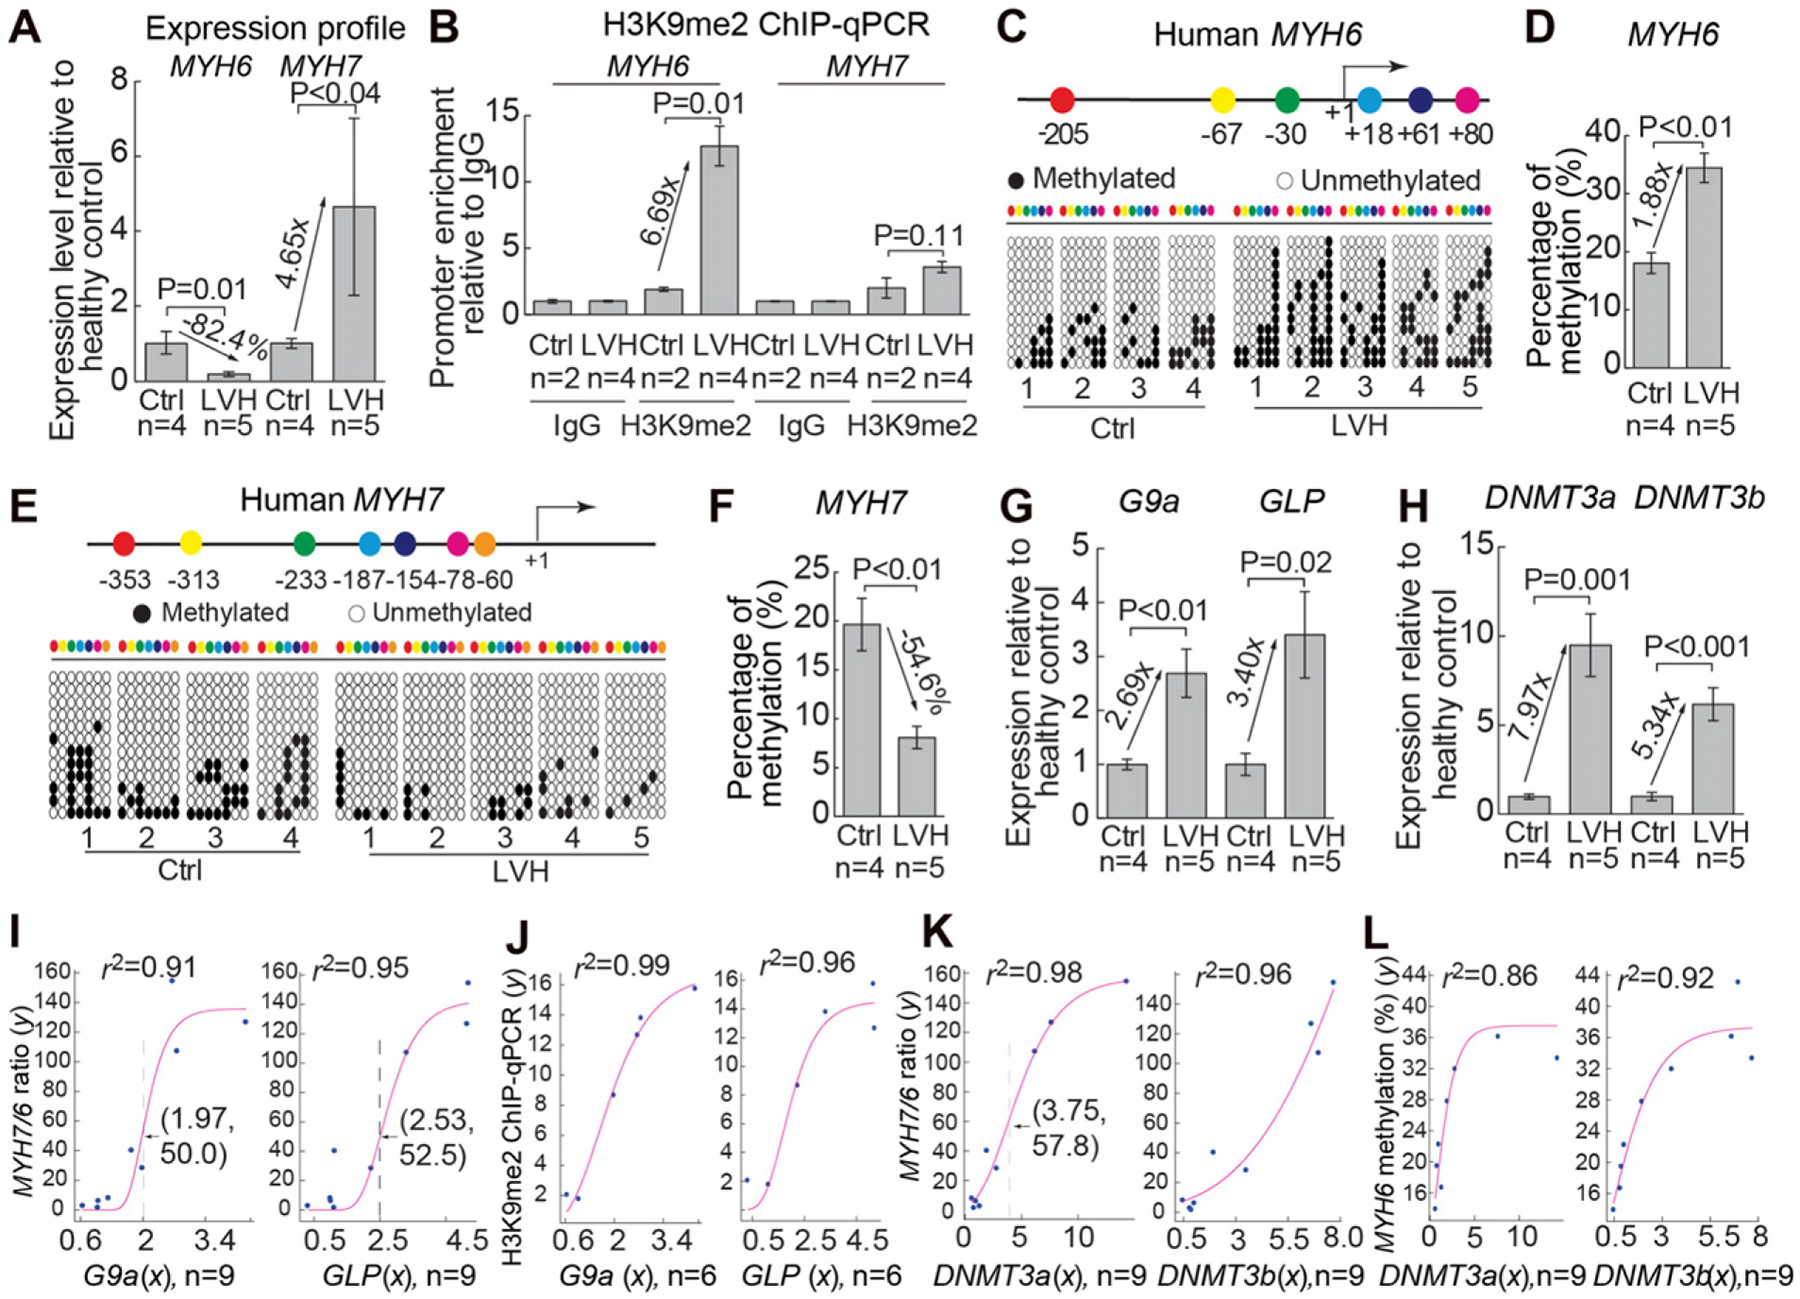
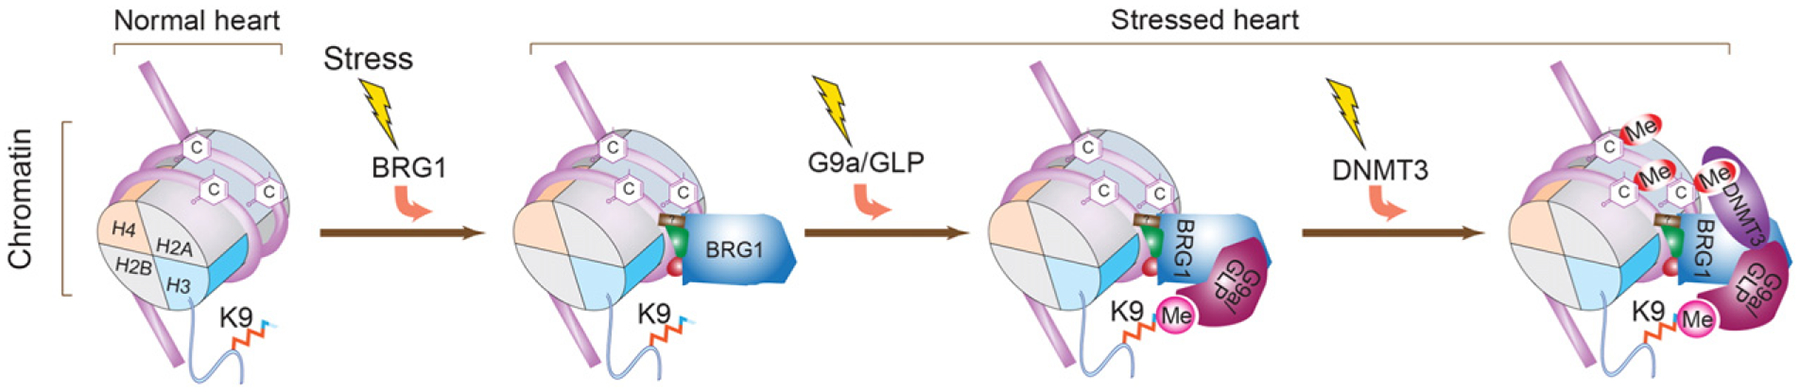
Chromatin structure is determined by nucleosome positioning, histone modifications, and DNA methylation. How chromatin modifications are coordinately altered under pathological conditions remains elusive. Here we describe a stress-activated mechanism of concerted chromatin modification in the heart. In mice, pathological stress activates cardiomyocytes to express Brg1 (nucleosome-remodeling factor), G9a/Glp (histone methyltransferase), and Dnmt3 (DNA methyltransferase). Once activated, Brg1 recruits G9a and then Dnmt3 to sequentially assemble repressive chromatin-marked by H3K9 and CpG methylation-on a key molecular motor gene (Myh6), thereby silencing Myh6 and impairing cardiac contraction. Disruption of Brg1, G9a or Dnmt3 erases repressive chromatin marks and de-represses Myh6, reducing stress-induced cardiac dysfunction. In human hypertrophic hearts, BRG1-G9a/GLP-DNMT3 complex is also activated; its level correlates with H3K9/CpG methylation, Myh6 repression, and cardiomyopathy. Our studies demonstrate a new mechanism of chromatin assembly in stressed hearts and novel therapeutic targets for restoring Myh6 and ventricular function. The stress-induced Brg1-G9a-Dnmt3 interactions and sequence of repressive chromatin assembly on Myh6 illustrates a molecular mechanism by which the heart epigenetically responds to environmental signals. This article is part of a Special Issue entitled: Cardiomyocyte Biology: Integration of Developmental and Environmental Cues in the Heart edited by Marcus Schaub and Hughes Abriel.

Keywords: Brg1; Cardiac hypertrophy; Cardiomyopathy; Chromatin remodeling; DNA methylation; Dnmt; G9a; Gene silencing; H3K9me2; Heart failure; Histone methylation; Myosin heavy chain.


Conflict of interest statement

Conflict of interest

The authors have not conflict of interest to report at this time.

Figures

Fig. 1.
Fig. 1.
G9a/Glp is essential for cardiac hypertrophy and dysfunction. (A and B) Quantitation of H3K9me2 ChIP of the proximal promoters of Myh6 (A) and Myh7. (B) in fetal hearts (E12.5), sham-operated adult hearts, and TAC-operated adult hearts. Data are presented as H3K9me2 enrichment relative to IgG control. (C) mRNA expression of H3K9 methyltransferases in adult hearts 7 days after TAC. (D) Western blot and quantitation of G9a, Glp proteins 7 days after TAC. TFIIb proteins were used as the internal control. (E–H) Gross morphology of ventricle (E), quantitation of ventricle/body weight ratio (F), trichrome staining of left ventricles (G), and echocardiographic measurement of left ventricular fractional shortening (H) in littermate control and mutant mice lacking myocardial G9a 14 days after sham or TAC operation. Ctrl: control mice. G9a null: Tnnt2-rtTA;Tre-Cre;G9af/f mice. (I) Quantitation of H3K9me2 on the Myh6 proximal promoter (I) and Myh6 mRNA (J) 2 days after sham or TAC operation. BIX: BIX-treated heart. H3K9me2 ChIP data are presented as the enrichment normalized to the sham-operated hearts in control mice. Myh6 mRNA data are presented as mRNA levels normalized to the sham-operated hearts in control mice or PBS-treated mice, respectively. P-value: Student’s t-test. Error bar: SEM, standard error of the mean.
Fig. 2.
Fig. 2.
Dnmt3a is essential for cardiac hypertrophy and dysfunction. (A and B) Distribution of CpG sites across proximal promoters or 5′-untranslated regions of mouse Myh6 (A) and Myh7 (B), as well as the methylation of CpG sites in fetal heart ventricles (E12.5) and adult heart ventricles after 2–14 days of sham/TAC operation. The numbers denote CpG sites relative to the transcriptional start site (+1). CpG sites are color coded. Open and closed circles represent unmethylated and methylated CpG sites, respectively. (C) Quantification of the percentage of methylated CpG sites on mouse Myh6 and Myh67 indicated in Fig. 2A, B. “n” represents the number of different hearts used for analysis, with each heart having 12 randomly selected clones sequenced. (D and E) Quantitation of MeDIP of 5-methylcytosine (5mC), 5-hydroxymethylcytosine (5hmC) on the proximal promoters of Myh6 (D) and Myh7 (E) in adult heart ventricles after 2 days and 7 days of sham/TAC operation. Data are presented as enrichment relative to IgG control. (F) Quantitation of mRNA of Dnmt3a and Dnmt3b in adult hearts 7 days after sham/TAC operation. (G) Western blot and quantitation of Dnmt3a, Dnmt3b proteins 7 days after TAC. Internal control: TFIIb. (H–K) Gross morphology of ventricle (H), quantitation of ventricle/body weight ratio (I), trichrome staining of left ventricles (J), and echocardiographic measurement of left ventricular fractional shortening (K) in littermate control and mutant mice lacking myocardial Dnmt3a 14 days after sham/TAC operation. Ctrl: control mice. Dnmt3a null: Tnnt2-rtTA;Tre-Cre;Dnmt3af/f mice. (L and M) Methylation of CpG sites on the proximal promoter of Myh6 in hearts 2 days after sham or TAC operation. Representative sequencing results (L) and quantitation (M) of CpG methylation of individual hearts are shown. “n” represents the number of different hearts used for analysis, with each heart having 12 randomly selected clones sequenced. (N) Quantitation of Myh6 mRNA 2 days after sham or TAC operation. Data are presented as mRNA levels normalized to the sham-operated hearts in control mice or PBS-treated mice, respectively. Ctrl: control heart. P-value: Student’s t-test. Error bar: SEM, standard error of the mean.
Fig. 3.
Fig. 3.
G9a recruits Dnmt3a to Myh6 promoter for CpG methylation (A) Quantitation of G9a ChIP on proximal promoters of Myh6 and Myh7 two days after sham/TAC operation. Data are presented as G9a enrichment relative to IgG control. (B) Quantitation of Dnmt3a ChIP on proximal promoters of Myh6 and Myh7 2 days after sham/TAC operation. Data are presented as Dnmt3a enrichment relative to IgG control. (C) Co-immunoprecipitation of G9a and Dnmt3a in left ventricles 2 days after TAC. (D) Quantitation of G9a and H3K9me2 ChIP on the proximal promoter of Myh6 2 days after sham/TAC operation in control and Dnmt3a null hearts. Data are presented as G9a or H3K9me2 enrichment normalized to sham-operated hearts in control mice. (E) Quantitation of Dnmt3a ChIP on the proximal promoter of Myh6 in control and G9a null hearts 2 days after sham/TAC operation. G9a null: Tnnt2-rtTA;Tre-Cre;G9af/f heart. (F) Quantitation of CpG methylation of Myh6 in control and G9a null hearts. Representative sequencing results and quantitation analysis of CpG methylation of individual hearts are shown. “n” represents the number of different hearts used for analysis, with each heart having 12 randomly selected clones sequenced.
Fig. 4.
Fig. 4.
Brg1 recruits G9a and Dnmt3a to Myh6 promoter for H3K9 and CpG methylation (A) Co-immunoprecipitation of Brg1 with G9a and Dnmt3a in left ventricles 2 days after TAC. (B) Quantitation of Brg1 ChIP on the proximal promoter of Myh6 in control, G9a null, and Dnmt3a null hearts 2 days after sham/TAC operation. (C and D) Quantitation of G9a (C) and H3K9me2 (D) ChIP on the proximal promoter of Myh6 in control and Brg1 null hearts 2 days after sham/TAC operation. Brg1 null: Tnnt2-rtTA;Tre-Cre;Brg1f/f heart. (E) Quantitation of Dnmt3a ChIP on the proximal promoter of Myh6 in control and Brg1 null hearts 2 days after sham/TAC operation. (F) Quantitation of CpG methylation of Myh6 in control and Brg1 null hearts. Representative sequencing results and quantitation analysis of CpG methylation of individual hearts are shown. “n” represents the number of different hearts used for analysis, with each heart having 12 randomly selected clones sequenced. (G) Quantitation of G9a and Dnmt3a on Brg1-immunoprecipitated proximal promoters of Myh6 and Myh7 after 7 days of sham/TAC operation. Data are presented as G9a or Dnmt3a enrichment relative to IgG control. P-value: Student’s t-test. Error bar: SEM, standard error of the mean.
Fig. 5.
Fig. 5.
G9a/GLP, DNMT3, and chromatin methylation in human hypertrophic hearts. (A) Quantitation of Myh6 and Myh7 mRNAs in normal and hypertrophic left ventricles of human hearts. Ctrl: control. LVH: left ventricular hypertrophy. (B) Quantitation of H3K9me2 ChIP on proximal promoters of human MYH6 and MYH7 in normal and hypertrophic left ventricles of human hearts. (C and D) Distribution of the CpG sites across the proximal promoter of human MYH6 (C) and quantitation of CpG methylation on MYH6 (D). The numbers denote CpG sites relative to the transcriptional start site (+1). The CpG sites are color coded. Open and closed circles represent unmethylated and methylated CpG sites, respectively. “n” represents the number of different hearts, with each heart having 12 randomly selected clones sequenced. (E and F) Distribution of the CpG sites across the proximal promoter of human MYH7 (E) and quantitation of CpG methylation on MYH7 (F). “n” represents the number of different hearts used for analysis. (G) Quantitation of human G9a and GLP mRNAs. (H) Quantitation of human DNMT3a and DNMT3b mRNA levels. (I and J) Correlation of G9a and GLP mRNA level (x axis) with Myh7/Myh6 mRNA ratio (y axis) (I) and with H3K9 methylation of Myh6 (y axis) (J). Red: regression curve. e, the base of natural logarithm (~2.718). Arrow and dashed line, the inflection point. (K and L) Correlation of DNMT3a and DNMT3b mRNA level (x axis) with Myh7/Myh6 mRNA ratio (y axis) (K) and with CpG methylation of Myh6 (y axis) (L). Red: regression curve. e, the base of natural logarithm (~2.718).
Fig. 6.
Fig. 6.
A model of how chromatin remodeling is mechanistically linked to histone (H3K9) and DNA (CpG) methylation on Myh6 promoter Working model showing that cardiac stress triggers sequential recruitment of chromatin regulators on the Myh6 locus to establish a repressive chromatin scaffold. H: histone. K9: the ninth lysine residue of histone H3 N-terminal tail. C: cytosine at the CpG site. Me: methyl group on H3K9 or CpG sites.

Similar articles

Cited by

References

    1. Abraham WT, Gilbert EM, Lowes BD, Minobe WA, Larrabee P, Roden RL, Dutcher D, Sederberg J, Lindenfeld JA, Wolfel EE, et al., Coordinate changes in Myosin heavy chain isoform gene expression are selectively associated with alterations in dilated cardiomyopathy phenotype, Mol. Med 8 (2002) 750–760. - PMC - PubMed
    1. Bestor TH, The DNA methyltransferases of mammals, Hum. Mol. Genet 9 (2000) 2395–2402. - PubMed
    1. Bird A, Putting the DNA back into DNA methylation, Nat. Genet 43 (2011) 1050–1051. - PubMed
    1. Cedar H, Bergman Y, Linking DNA methylation and histone modification: patterns and paradigms, Nat. Rev. Genet 10 (2009) 295–304. - PubMed
    1. Clapier CR, Cairns BR, The biology of chromatin remodeling complexes, Annu. Rev. Biochem 78 (2009) 273–304. - PubMed

Publication types

MeSH terms

LinkOut - more resources