. 2016 Apr 15;143(8):1271-83.
doi: 10.1242/dev.131961. Epub 2016 Mar 7.

The BAF chromatin remodelling complex is an epigenetic regulator of lineage specification in the early mouse embryo

Affiliations

The BAF chromatin remodelling complex is an epigenetic regulator of lineage specification in the early mouse embryo

Maryna Panamarova et al. Development. .

Abstract

Dynamic control of gene expression is essential for the development of a totipotent zygote into an embryo with defined cell lineages. The accessibility of genes responsible for cell specification to transcriptional machinery is dependent on chromatin remodelling complexes such as the SWI\SNF (BAF) complex. However, the role of the BAF complex in early mouse development has remained unclear. Here, we demonstrate that BAF155, a major BAF complex subunit, regulates the assembly of the BAF complex in vivo and regulates lineage specification of the mouse blastocyst. We find that associations of BAF155 with other BAF complex subunits become enriched in extra-embryonic lineages just prior to implantation. This enrichment is attributed to decreased mobility of BAF155 in extra-embryonic compared with embryonic lineages. Downregulation of BAF155 leads to increased expression of the pluripotency marker Nanog and its ectopic expression in extra-embryonic lineages, whereas upregulation of BAF155 leads to the upregulation of differentiation markers. Finally, we show that the arginine methyltransferase CARM1 methylates BAF155, which differentially influences assembly of the BAF complex between the lineages and the expression of pluripotency markers. Together, our results indicate a novel role of BAF-dependent chromatin remodelling in mouse development via regulation of lineage specification.

Keywords: BAF complex; Chromatin remodelling; Epigenetics; Lineage specification; Mouse embryo; Pluripotency; SMARCC1.


Figures

Fig. 1.
Fig. 1.
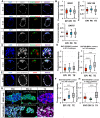
Associations between the BAF complex subunits are upregulated in extra-embryonic lineages at the late blastocyst stage. (A) Antibody staining of BAF complex subunits (n≥9 each). (B) Automated quantification of fluorescence intensity of z-stacks in the three distinct cell types of the blastocyst. (C) Fluorescent signal generated by PLA shows the interaction between BAF155 and BRG1 in early and late blastocysts. (D) The fluorescence intensity of BAF155-BRG1 contact is similar among the lineages at E3.5, but higher in TE and PE at E4.5. (E) The fluorescence intensity from BAF155-BAF57 interaction is increased in TE and PE. (F) Quantification of fluorescent signal from BAF155-BAF57 PLA between the embryonic lineages. (G) Fluorescent signal generated by BAF155-BRG1 PLA in stem cell lines. Troma1 antibody detects the TE marker cytokeratin 8. (H) The fluorescence intensity of BAF155-BRG1 contact is higher in TSC (median, 0.73; mean, 0.88) versus ESC (median, 0.50; mean, 0.52) and ESC 2i (median and mean, 0.37). Error bars represent s.d. **P<0.01, ***P<0.001, ANOVA. Scale bars: 10 µm.
Fig. 2.
Fig. 2.
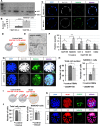
Upregulation of BAF155 causes upregulation of BAF complex components. (A) HA-tagged human BAF155, mouse Baf57 or Ruby mRNAs were injected into one blastomere at the 2-cell stage and analysed at the 8-cell stage. (B-B″) Clonal overexpression of BAF155 results in the upregulation of protein levels of the complex subunits (B′), whereas overexpression of Ruby (B) or BAF57 (B″) does not. (C) The protein levels of BAF57 and BRG1 upon BAF155 overexpression (OE) were upregulated by ∼3-fold. (D) qRT-PCR analysis of transcripts for key components of the BAF complex 24 h after BAF155 OE. INI1 refers to Baf47 (Smarcb1). (E) HA-tagged BAF155 mRNA was injected into one blastomere at the 2-cell stage and analysed at the 4-cell stage by PLA. (F) Clonal BAF155 OE caused an increase in BAF155-BRG1 interaction in the injected clones (dashed outline). (G) Overexpression of exogenous BAF155 resulted in 2-fold upregulation of BAF155-BRG1 contact. Error bars represent s.d. *P<0.05, **P<0.01, ***P<0.001, Student's t-test.
Fig. 3.
Fig. 3.
BAF155 is required for Nanog downregulation during lineage specification at the blastocyst stage. (A) Three-primer single-embryo PCR analysis from Baf155 heterozygous intercrosses showing wild-type (450 bp) and mutated (250 bp) alleles. The first lane contains a size marker (1 kb HyperLadder). (B) Baf155−/− embryos have a significantly increased number of NANOG+ cells compared with control littermate embryos (***P<0.01, Student's t-test). (C) Baf155−/− embryos exhibit ectopic nuclear expression of NANOG in TE (determined morphologically), unlike Baf155+/+ littermates that only have nuclear NANOG expression in the EPI cells. (D) Downregulation of BAF155 at the zygote stage was performed using dsRNA against the 3′UTR (dsBAF155), or control dsRNA. (E) DIC images of embryos injected with control dsRNA or dsBAF155. (F) qRT-PCR of whole embryos, comparing lineage marker transcripts of control and dsBAF155 blastocysts. (G) z-projections of immunofluorescent images of control and dsBAF155 E4.5 blastocysts. (H) The total number of cells in control E4.5 blastocysts (88±4) was slightly reduced compared with dsBAF155 blastocysts (76±7). The number of NANOG+ cells in dsBAF155 blastocysts was increased (17±4) compared with the control (9±3). (I) Rescue experiment of BAF155-depleted embryos. (J) Rescue blastocysts had fewer cells (77±9) than control blastocysts (87±5), but the same number of NANOG+ cells. (K) No ectopic expression of NANOG in TE was detected in the majority of rescued blastocysts. Error bars represent s.d. *P<0.05, **P<0.01, ***P<0.001, Student's t-test. Scale bars: 10 µm.
Fig. 4.
Fig. 4.
Upregulation of BAF155 shifts the developmental programme towards the extra-embryonic lineage. (A) Overexpression (OE) experiments of BAF155 using the HA-tagged BAF155 construct or of Ruby (control). (B) qRT-PCR on whole embryos, comparing lineage marker transcripts of control and BAF155 OE blastocysts. (C) Immunofluorescence images of control and BAF155 OE blastocysts at E4.5. (D) Total cell number was reduced in BAF155 OE blastocysts (61±6) compared with the control (90±5). (E) The total number of ICM cells was reduced in BAF155 OE blastocysts (14±2) compared with the control (21±3); the majority of ICM cells in BAF155 OE blastocysts co-express NANOG and SOX17 (9±3), unlike control blastocysts (1±2). (F) z-projections of control and BAF155 OE blastocysts: Ruby blastocyst contributes equally to the ICM and CDX2+ TE cell populations, whereas BAF155 OE blastocyst infrequently contributes to the CDX2 ICM cells (arrows). (G) The percentage of clones injected with BAF155 contributing to the total blastocyst was lower than that injected with Ruby. (H) Clones injected with BAF155 showed a higher contribution to the CDX2+ TE lineage compared with Ruby+ clones. Error bars represent s.d. *P<0.05, **P<0.01, ***P<0.001, Student's t-test. Scale bars: 10 µm.
Fig. 5.
Fig. 5.
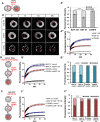
The mobility of BAF57 is dependent on the level of BAF155 expression. (A) The live kinetics of BAF155, BAF57 and CENPA proteins tagged with mCherry were measured at the 8-cell stage. (A′) Recovery kinetics were estimated by measuring fluorescence intensity (within the boxed region) prior to photobleaching (P) and during 40 s after photobleaching. (A″) The immobile pool was significantly greater for BAF155 (78.61±2.4%) than BAF57 (59.97±5.0%); the immobile fraction of CENPA was the highest (93.9±1.7%). (A‴) Greater mobility of BAF57 than of BAF155 or CENPA was detected by greater FRAP recovery. (B) The kinetics of BAF57 and CENPA measured at the 8-cell stage of embryos zygotically depleted with dsBAF155. (B′) Recovery of BAF57 was increased in dsBAF155 embryos compared with the controls, whereas CENPA mobility was unaffected. (B″) The immobile fraction of BAF57 in dsBAF155 embryos was reduced, but remained unaffected for CENPA. (C) Kinetics of BAF57 and CENPA estimated at the 8-cell stage of embryos injected with BAF155-HA. (C′) The recovery of BAF57 was reduced in BAF155 OE embryos compared with the control, whereas in CENPA embryos the rate was unchanged. (C″) The immobile fraction of BAF57 was significantly increased in BAF155 OE (83.4±3.6%) compared with control (60±5.6%), whereas CENPA was unaffected. Error bars represent s.e.m. ***P<0.001, F-test.
Fig. 6.
Fig. 6.
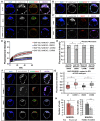
NANOG+ cells contain more mobile BAF155 than NANOG cells. (A) Rescue conditions in Nanog-YFP transgenic embryos were applied to measure the live kinetics of BAF155 between the lineages at E4.5. The kinetics of CENPA were measured in embryos injected with control RNAi at the zygote stage (n=11). (B,C) The recovery kinetics of BAF155 and CENPA were assessed in a rectangular region of nuclei after photobleaching. The fluorescence intensity was measured prior to photobleaching (P) and for 40 s during the recovery phase after photobleaching (0 s). (D) NANOG+ cells show greater recovery of BAF155 than NANOG cells, whereas recovery of CENPA is similar. (E) NANOG cells have a significantly higher immobile fraction of BAF155 protein (87.7±4.3%) than NANOG+ cells (72.06±6.2%); *P<0.05, F-test. The difference in the size of the immobile fraction of CENPA between NANOG (95.17±1.2%) and NANOG+ (96.31±3.6%) cells was not statistically significant (P>0.05, F-test). Error bars represent s.e.m.
Fig. 7.
Fig. 7.
CARM1-mediated methylation of BAF155 influences assembly of the BAF complex and lineage specification. (A) Methylated BAF155 in E3.5 and E4.5 embryos. Methylated BAF155 was detectable at only low levels in Carm1−/− embryos. (B) The distribution of H3R17me2 at E4.5. (C) Methylation of BAF155 is reduced in embryos treated with a CARM1-specific inhibitor (CARMi) and is unaffected by DMSO carrier. (D) NANOG+ cells in CARMi-treated embryos show reduced FRAP recovery of BAF155-mCherry compared with NANOG+ in DMSO-treated embryos. (E) NANOG+ cells (CARMi) have a higher immobile fraction of BAF155 protein (75±3.6%) than NANOG+ cells in DMSO (86.87±2%). (F) The frequency of interactions between BAF155 and BRG1 is comparably increased in EPI cells (dashed outline) of Carm1 null and CARMi E4.5 embryos (arrows), in contrast to EPI cells of wild-type and DMSO-treated embryos. (G) The fluorescence intensity generated by BAF155-BRG1 association is increased in EPI cells of Carm1−/− compared with wild-type embryos, and in CARMi-treated compared with DMSO-treated embryos. (H) The number of NANOG+ cells is decreased in Carm1 null and CARMi embryos. Error bars represent s.e.m. *P<0.05, **P<0.001, Student's t-test. Scale bars: 10 μm.
Fig. 8.
Fig. 8.
Model for CARM1-mediated regulation of Nanog expression by the BAF complex. Prior to implantation, expression of the pluripotency gene Nanog needs to be repressed in TE and tightly controlled in EPI. BAF complexes in TE, which have an increased stability of BAF155-BRG1 contact, act to repress the expression of Nanog. In EPI, however, the stability of the BAF complex is decreased through CARM1-mediated methylation of subunit BAF155. This mechanism modulates the expression of Nanog that is compatible with further embryonic development.

Similar articles

Cited by

References

    1. Bischoff M., Parfitt D.-E. and Zernicka-Goetz M. (2008). Formation of the embryonic-abembryonic axis of the mouse blastocyst: relationships between orientation of early cleavage divisions and pattern of symmetric/asymmetric divisions. Development 135, 953-962. 10.1242/dev.014316 - DOI - PMC - PubMed
    1. Boroviak T., Loos R., Bertone P., Smith A. and Nichols J. (2014). The ability of inner-cell-mass cells to self-renew as embryonic stem cells is acquired following epiblast specification. Nat. Cell Biol. 16, 513-525. 10.1038/ncb2965 - DOI - PMC - PubMed
    1. Bultman S., Gebuhr T., Yee D., La Mantia C., Nicholson J., Gilliam A., Randazzo F., Metzger D., Chambon P., Crabtree G. et al. (2000). A Brg1 null mutation in the mouse reveals functional differences among mammalian SWI/SNF complexes. Mol. Cell 6, 1287-1295. 10.1016/S1097-2765(00)00127-1 - DOI - PubMed
    1. Carey T. S., Cao Z., Choi I., Ganguly A., Wilson C. A., Paul S. and Knott J. G. (2015). BRG1 governs Nanog transcription in early mouse embryos and embryonic stem cells via antagonism of histone H3 lysine 9/14 acetylation. Mol. Cell. Biol. 35, 4158-4169. 10.1128/MCB.00546-15 - DOI - PMC - PubMed
    1. Carrero G., McDonald D., Crawford E., de Vries G. and Hendzel M. J. (2003). Using FRAP and mathematical modeling to determine the in vivo kinetics of nuclear proteins. Methods 29, 14-28. 10.1016/S1046-2023(02)00288-8 - DOI - PubMed

Publication types

Substances