. 2016 Mar 14;212(6):647-59.
doi: 10.1083/jcb.201408089. Epub 2016 Mar 7.

ARHGEF17 is an essential spindle assembly checkpoint factor that targets Mps1 to kinetochores

Affiliations

ARHGEF17 is an essential spindle assembly checkpoint factor that targets Mps1 to kinetochores

Mayumi Isokane et al. J Cell Biol. .

Abstract

To prevent genome instability, mitotic exit is delayed until all chromosomes are properly attached to the mitotic spindle by the spindle assembly checkpoint (SAC). In this study, we characterized the function of ARHGEF17, identified in a genome-wide RNA interference screen for human mitosis genes. Through a series of quantitative imaging, biochemical, and biophysical experiments, we showed that ARHGEF17 is essential for SAC activity, because it is the major targeting factor that controls localization of the checkpoint kinase Mps1 to the kinetochore. This mitotic function is mediated by direct interaction of the central domain of ARHGEF17 with Mps1, which is autoregulated by the activity of Mps1 kinase, for which ARHGEF17 is a substrate. This mitosis-specific role is independent of ARHGEF17's RhoGEF activity in interphase. Our study thus assigns a new mitotic function to ARHGEF17 and reveals the molecular mechanism for a key step in SAC establishment.


Figures

Figure 1.
Figure 1.
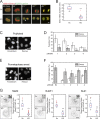
ARHGEF17 is required for SAC. (A and B) Knockdown (KD) of hARHGEF17 in HeLa Kyoto cells stably expressing H2B-mCherry and EGFP-laminA. (A) Time series of cells treated with si(Scrambled) (Sc) or si(hARHGEF17) (KD). Arrowhead marks a chromosome bridge. (B) Comparison of early mitotic duration (prometaphase + metaphase) from >22 mitosis/three independent experiments. (C and D) Validation of siRNA targeting of hARHGEF17 by phenotypic rescue through LAP-mARHGEF17-BAC. (C) Nuclei (H2B-mCherry) 48 h after siRNA transfection with or without LAP-mARHGEF17-BAC rescue. (D) Comparison of polylobed nuclei populations (normalized to Scrambled in each condition) from >6,000 cells/three independent experiments. siRNA number indicated (see Materials and methods). (E and F) SAC activity of ARHGEF17. (E) Nuclei (H2B-mCherry) treated with 0.33 µM nocodazole 48 h after siRNA transfection with or without LAP-mARHGEF17-BAC rescue. (F) Comparison of cell populations in prometaphase of >4,500 cells/three independent experiments. siRNA number indicated. (G) Quantitative expression analysis of checkpoint proteins at kinetochores in prometaphase. (left) Localization of Mad2, BubR1, or Bub1 after Scrambled or hARHGEF17-KD. (inset) High magnification of kinetochores. Black lines outline segmented chromosomes. (right) Comparison of mean intensity ratio between checkpoint proteins and CENP-A at >1,300 individual sister kinetochores/three independent experiments. Bar graphs show mean ± SD; boxes show median, 25–75%; whiskers show 1.5× interquartile range. Bars: (A and G) 5 µm; (G, inset) 0.5 µm; (C and E) 10 µm. **, P < 0.01 by two-tailed unpaired Student’s t test, compared with si(Scrambled) (B and G) or without a rescue construct (D).
Figure 2.
Figure 2.
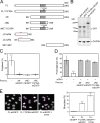
ARHGEF17 fragment restores SAC function independently of catalytic activity for Rho GEF of ARHGEF17. (A) Schematic depiction of hARHGEF17 variants used in phenotypic rescue assays: FL: hARHGEF17 (1–2,063)-mEGFP; FL Y1216A: hARHGEF17 (1–2,063)-Y1216A-mEGFP; ΔN: hARHGEF17 (667–2,063)-mEGFP; ΔNC: hARHGEF17 (667–1,306)-mEGFP; ΔNC Y1216A: hARHGEF17 (667–1,306)-Y1216A-mEGFP; ΔC-siRa: hARHGEF17 (1–582)-mEGFP; ΔC-siRb: hARHGEF17 (109–664)-mEGFP; ΔN1: mEGFP-hARHGEF17 (1,304–2,063)-mEGFP; and ΔN2: hARHGEF17 (1,304–2,063)-mEGFP. Gray boxes indicate GEF activity domain (Dbl-homologous domain); Y1216A indicates the inactivating mutation in the GEF domain; red lines indicate sites for mutations for siRNA resistance. (B) Immunoblot analysis of hARHGEF17 fragments fused to GFP (detected with anti-GFP). GAPDH, loading control. (C and D) Rescue of hARHGEF17 knockdown-induced polylobulation (C) or SAC defect (D). Comparison of polylobed (C; normalized to Scrambled) or prometaphase population (D; nocodazole treated) rescued with hARHGEF17 fragments (ΔN-mEGFP, ΔNC-mEGFP, and ΔNC Y1216A-mEGFP) of >11,500 (C) or >6,300 (D) cells/three independent experiments. (E) Phenotypic analysis of cytokinesis defects (binucleation) of a catalytically inactive mutant of full-length ARHGEF17 (FL Y1216A) during mitosis. (left) H2B-mCherry, wild-type full-length (FL-mEGFP), catalytically inactive (FL Y1216A-mEGFP), or cells 24 h after CT04 treatment (0.25 mg/ml; FL + CT04). (right) Comparison of binuclear population of >3,000 cells/three independent experiments. Bar graphs show mean ± SD. **, P < 0.01 by two-tailed unpaired Student’s t test, compared with no rescue construct (C), si(Scrambled) without a rescue construct (D), or FL-mEGFP (E). Cells automatically segmented/analyzed by CellCognition. Bars, 10 µm.
Figure 3.
Figure 3.
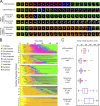
ARHGEF17 knockdown phenocopies Mps1 inhibition. Mitosis and nuclear morphology automatically extracted after si(Scrambled), si(hARHGEF17) knockdown (KD), reversine, and hesperadin treatment conditions. Colors indicate H2B-mCherry morphology classes. (A) Examples of single mitotic events. Δt is 9 min. Bar, 10 µm. (B) Automated extraction of mitotic events and morphology classes. (C) Comparison of early mitotic duration (prometa + metaphase) of >21 mitotic events (n indicated for each condition)/three independent experiments. Early mitotic duration in hesperadin-treated conditions was underestimated because of fixed analysis time (3 h). Boxes show median, 25–75%; whiskers show 1.5× interquartile range. **, P < 0.01 by two-tailed unpaired Student’s t test compared with si(Scrambled).
Figure 4.
Figure 4.
ARHGEF17 and Mps1 interact during mitosis. (A) Coimmunoprecipitation of ARHGEF17 with Mps1: LAP-tagged Mps1 (LAP-Mps1) and mCherry-tagged ARHGEF17 (ARHGEF17-mCherry) were immunoprecipitated using GFP-binding protein coupled to agarose beads. Input, supernatants (Unbound), and immunoprecipitates (Bound) were analyzed by Western Blot (anti-GFP and anti-mCherry). (B and C) FCCS of Mps1 and ARHGEF17. Exemplary cells (B; yellow crosses mark position for FCCS measurement) and normalized cross-correlation (C) of ARHGEF17-mCherry and LAP-Mps1 with or without reversine treatment of >40 cells (specific numbers indicated)/three independent experiments. (D) Coimmunoprecipitation of ARHGEF17 fragments with Mps1: LAP-Mps1 and mCherry-tagged ARHGEF17 fragments (ΔNC-mCherry and ΔNC Y1216A-mCherry) were precipitated using GFP-binding protein coupled to agarose beads. Input and precipitates were analyzed by Western blot (anti-GFP and anti-mCherry). (E and F) FCCS of Mps1 and ARHGEF17 fragments. Exemplary cells (E) and normalized cross-correlation (F) of LAP-Mps1 and ARHGEF17 fragments (ΔNC-mCherry and ΔNC Y1216A-mCherry) of >40 cells (specific numbers indicated)/three independent experiments. (G) In vitro pull-down of ARHGEF17 fragments with Mps1. His-tagged Mps1 (bait) and untagged ARHGEF17 fragments (ΔNC; target) were precipitated using His-tag binding protein coupled to Talon beads. Input, supernatants (Unbound), and precipitates (Bound) were analyzed by Western blot (anti–His-tag [middle] and anti-ARHGEF17 [bottom]). Coomassie brilliant blue staining was used as internal protein control in each condition. Boxes show median, 25–75%; whiskers show 1.5× interquartile range. **, P < 0.01 by two-tailed unpaired Student’s t test, compared with mEGFP and mCherry (C and F) or between metaphase and metaphase with reversine treatment (F). Slower migration of Mps1/ARHGEF17 bands could be caused by phosphorylation (A and D). Bars, 5 µm.
Figure 5.
Figure 5.
Mps1 phosphorylates ARHGEF17 in vitro. (A) In vitro kinase assay of Mps1 and ARHGEF17. Recombinant His-tag fused Mps1 (kinase) and untagged ARHGEF17-ΔNC or BSA (substrate) were incubated in the presence or absence of ATP. Total protein was visualized with Coomassie brilliant blue (CBB; left), and phosphorylated protein was visualized with Pro-Q Diamond (right). (B) Comparison of normalized mean intensity ratio between phosphorylated protein and total protein in each condition. Quantification was performed from single experiment. (C) Potential phosphorylation sites of ARHGEF17 by Mps1 identified by LC-MS/MS. Andromeda score, probability, and delta score are indicated for each site (see Materials and methods).
Figure 6.
Figure 6.
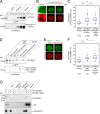
ARHGEF17 is required for targeting of Mps1 at kinetochores, and constitutive tethering of Mps1 to the kinetochore replaces ARHGEF17’s SAC function. (A and B, left) Exemplary prometaphase cells with LAP-Mps1 and phospho-KNL1 labeled at kinetochores. Overlay shows LAP-Mps1 (A) or ph-KNL1 (Thr875; B; green) and CENP-A (red) after knockdown of ARHGEF17. (insets) High magnification of kinetochores. (right) Quantitative ratiometric comparison of LAP-Mps1 (A) or ph-KNL1 (B). Box plot comparing the mean intensity ratio between LAP-Mps1/CENP-A or ph-KNL1/CENP-A ratio of >600 individual sister kinetochores/three independent experiments. Bars: (main) 5 µm; (insets) 0.5 µm. (C and D) Phenotypic rescue by artificial kinetochore tethering of Mps1 in the absence of ARHGEF17. (C) Mitotic events were automatically extracted after knockdown in cells stably expressing H2B-mCherry and mEGFP-CENP-B-Mps1 with or without 0.5 µM reversine treatment. Colors indicate H2B-mCherry morphology classes. (D) Comparison of early mitotic duration. Box plot comparing the duration of prometaphase and metaphase in each condition. Mean and standard deviation of >120 mitotic events (n indicated for each condition)/three independent experiments. Boxes show median, 25–75%; whiskers show 1.5× interquartile range. **, P < 0.01 by two-tailed unpaired Student’s t test, compared with si(Scrambled) (A and B), si(Scrambled) versus si(ARHGEF17); si(hARHGEF17) versus mEGFP-CENP-B-Mps1 expression with or without reversine (D). Sc, Scrambled; KD, knockdown.
Figure 7.
Figure 7.
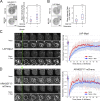
ARHGEF17–Mps1 interaction is regulated by Mps1 activity. (A and B, left) ARHGEF17 (ARHGEF17-mCherry; A) or Mps1 (LAP-Mps1; B) localization at kinetochores in prometaphase with 0.5 µM reversine (Rev; 2 h before fixation). (insets) High magnification of kinetochores. (right) Quantitative comparison of ARHGEF17-mCherry/ACA and LAP-Mps1/ACA ratios on >260 individual sister kinetochores/three independent experiments. (C and D) FRAP of Mps1 (LAP-Mps1; C) and ARHGEF17 (ARHGEF17-mCherry; D) at kinetochores in nocodazole (Noco)-treated mitotic cells with or without reversine treatment. The kinetochore region of the cell was bleached (white circles) and imaged every 0.4 s for 40 s (100 frames). (bottom) High magnification of kinetochores. FRAP curves were normalized between 1 (prebleach value) and 0 (postbleach value) and plotted over time. Boxes show median, 25–75%; whiskers show 1.5× interquartile range. **, P < 0.01 by two-tailed unpaired Student’s t test compared with si(Scrambled). Bars: (A–D) 5; (A and B, insets) 1 µm.
Figure 8.
Figure 8.
Model for the recruitment of ARHGEF17 and Mps1 at kinetochores in early mitosis. ARHGEF17 forms a complex with Mps1 in the cytoplasm, which binds to the kinetochore (KT) and allows Mps1 to phosphorylate local target substrates. Because Mps1 also phosphorylates ARHGEF17, the Mps1–ARHGEF17 complex is short lived and promotes its own dissociation, which in turn releases Mps1 and ARHGEF17 from the kinetochore. The dissociated proteins are then available to form new Mps1–ARHGEF17 complexes, presumably after dephosphorylation of ARHGEF17 by a counteracting phosphatase.

Comment in

Similar articles

Cited by

References

    1. Abrieu A., Magnaghi-Jaulin L., Kahana J.A., Peter M., Castro A., Vigneron S., Lorca T., Cleveland D.W., and Labbé J.-C.. 2001. Mps1 is a kinetochore-associated kinase essential for the vertebrate mitotic checkpoint. Cell. 106:83–93. 10.1016/S0092-8674(01)00410-X - DOI - PubMed
    1. Alexandru G., Zachariae W., Schleiffer A., and Nasmyth K.. 1999. Sister chromatid separation and chromosome re-duplication are regulated by different mechanisms in response to spindle damage. EMBO J. 18:2707–2721. 10.1093/emboj/18.10.2707 - DOI - PMC - PubMed
    1. Bacia K., Petrášek Z., and Schwille P.. 2012. Correcting for spectral cross-talk in dual-color fluorescence cross-correlation spectroscopy. ChemPhysChem. 13:1221–1231. 10.1002/cphc.201100801 - DOI - PMC - PubMed
    1. Boeke D., Trautmann S., Meurer M., Wachsmuth M., Godlee C., Knop M., and Kaksonen M.. 2014. Quantification of cytosolic interactions identifies Ede1 oligomers as key organizers of endocytosis. Mol. Syst. Biol. 10:756 10.15252/msb.20145422 - DOI - PMC - PubMed
    1. Erfle H., Neumann B., Rogers P., Bulkescher J., Ellenberg J., and Pepperkok R.. 2008. Work flow for multiplexing siRNA assays by solid-phase reverse transfection in multiwell plates. J. Biomol. Screen. 13:575–580. 10.1177/1087057108320133 - DOI - PubMed

Publication types

MeSH terms

Substances