. 2016 Mar 8;11(3):e0148413.
doi: 10.1371/journal.pone.0148413. eCollection 2016.

Global Neuromagnetic Cortical Fields Have Non-Zero Velocity

Affiliations

Global Neuromagnetic Cortical Fields Have Non-Zero Velocity

David M Alexander et al. PLoS One. .

Abstract

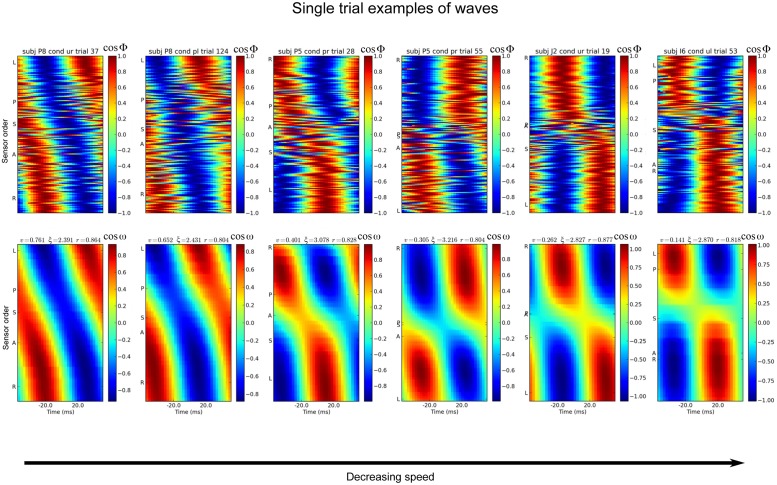
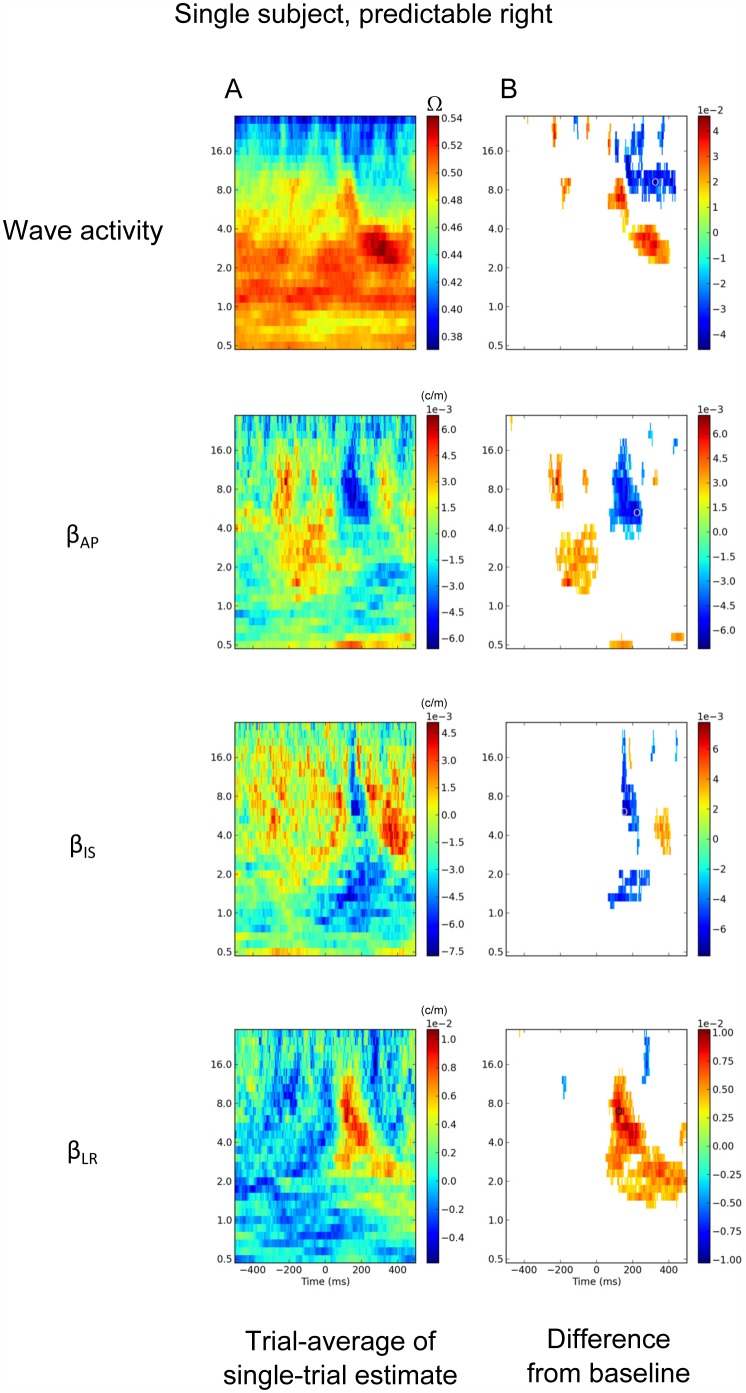
Globally coherent patterns of phase can be obscured by analysis techniques that aggregate brain activity measures across-trials, whether prior to source localization or for estimating inter-areal coherence. We analyzed, at single-trial level, whole head MEG recorded during an observer-triggered apparent motion task. Episodes of globally coherent activity occurred in the delta, theta, alpha and beta bands of the signal in the form of large-scale waves, which propagated with a variety of velocities. Their mean speed at each frequency band was proportional to temporal frequency, giving a range of 0.06 to 4.0 m/s, from delta to beta. The wave peaks moved over the entire measurement array, during both ongoing activity and task-relevant intervals; direction of motion was more predictable during the latter. A large proportion of the cortical signal, measurable at the scalp, exists as large-scale coherent motion. We argue that the distribution of observable phase velocities in MEG is dominated by spatial filtering considerations in combination with group velocity of cortical activity. Traveling waves may index processes involved in global coordination of cortical activity.


Conflict of interest statement

Competing Interests: The authors have declared that no competing interests exist.

Figures

Fig 1
Fig 1. Examples of single trials with good fit to the wave model.
The top row shows the cosine of the phase, at 9.2 Hz, across all sensors. Examples are taken from a variety of subjects and experimental trials. The times shown on the x-axis are relative to the center time of one cycle of the wave. The bottom row shows the model wave that was fit to the data. v is the normalized velocity of the wave, ξ is the wavenumber (cycles/m) and r is the fit of the model wave to the data. On the y-axes, some sensors are labeled to indicate the approximate spatial ordering of the wave: ‘A’ is the most-anterior sensor, ‘P’ posterior, ‘I’ inferior, ‘S’ superior, ‘L’ left, and ‘R’ right. The sensors are ordered along the y-axis by values of the wave map calculated from the phases of the center time-sample.
Fig 2
Fig 2. Typical wavelength spectrum and distribution of peak wavelengths over all samples.
The top panel shows the spatial frequency spectrum for a single sample of one subject’s MEG. The peak in the wavelength spectrum in this case was at 27cm. The bottom panel shows the distribution of peak spatial frequencies over the entire population of samples. The bulk of waves have wavelength between 25 and 35cm, with delta band (1 to 4Hz) having slightly higher wavelengths compared to beta band (16 to 28 Hz).
Fig 3
Fig 3. Clustering trials by phase values reveals a wide range of dynamics in sub-averages.
These data are taken from subject ‘P8’, conditions predictable-left and unpredictable-left. The data are shown for one temporal cycle at 9.2Hz i.e. 108ms. Time at the center of the temporal window was 150ms post-button press. The trials were clustered using k-means (k = 6), with input vector being the phase at over the cycle centred at 150ms and over all sensors. A. The trial-averaged data from all the trials. B. The sub-averaged data from each of the six clusters. The top row shows the raw MEG signal, in units of Tesla. The number of trials in each average is indicated by n. The second row shows the cosine of the trial-averaged phase. The third row shows the model wave estimated from the trial-averaged phase. The sensor labeling on the y-axis is the same as for Fig 1.
Fig 4
Fig 4. Distribution of wave velocities.
A: Distribution of velocities at 5.3Hz, collated over all subjects and conditions at -32ms. Upper figure indicates the distribution of trajectories. Lower figure shows the speed of the waves. B: Same as A, except the best fitting wave from each trial is included, rather than the fit at a specific time. C: Distribution of velocities at 9.2Hz, 150ms, collated over all subjects and conditions. Upper figure shows the distribution of trajectories. Lower figure shows the speed of the waves. D. Same at C, except the best fitting wave from each trial is included, rather than the fit at a specific time.
Fig 5
Fig 5. Single subject example of time by frequency statistics (subject H8).
A. Mean log power and normalized velocity are averaged over all trials and all conditions. B. Regions that are significantly different (p<0.05, Wilcoxon signed-rank test) from the baseline level are shown in colour (ntrials = 475).
Fig 6
Fig 6. Single subject example of time by frequency statistics (subject O9).
A. Wave activity, βAP, βIS and βLR are calculated at the single trial level, then averaged over trials. B. Regions significantly different (p<0.05, Wilcoxon, ntrials = 433) from the baseline levels for (A) are shown as non-white.

References

    1. Freeman WJ, Holmes MD, Burke BC, Vanhatalo S. Spatial spectra of scalp EEG and EMG from awake humans. Clin Neurophysiol Off J Int Fed Clin Neurophysiol. 2003;114: 1053–1068. - PubMed
    1. Bressler SL. Large-scale cortical networks and cognition. Brain Res Rev. 1995;20: 288–304. 10.1016/0165-0173(94)00016-I - DOI - PubMed
    1. Raichle ME, MacLeod AM, Snyder AZ, Powers WJ, Gusnard DA, Shulman GL. A default mode of brain function. Proc Natl Acad Sci U S A. 2001;98: 676–682. 10.1073/pnas.98.2.676 - DOI - PMC - PubMed
    1. Fries P. A mechanism for cognitive dynamics: neuronal communication through neuronal coherence. Trends Cogn Sci. 2005;9: 474–480. 10.1016/j.tics.2005.08.011 - DOI - PubMed
    1. Salinas E, Sejnowski TJ. Correlated neuronal activity and the flow of neural information. Nat Rev Neurosci. 2001;2: 539–550. 10.1038/35086012 - DOI - PMC - PubMed

Publication types

LinkOut - more resources