

CLUSTOM-CLOUD: In-Memory Data Grid-Based Software for Clustering 16S rRNA Sequence Data in the Cloud Environment
- PMID: 26954507
- PMCID: PMC4783016
- DOI: 10.1371/journal.pone.0151064
CLUSTOM-CLOUD: In-Memory Data Grid-Based Software for Clustering 16S rRNA Sequence Data in the Cloud Environment
Abstract
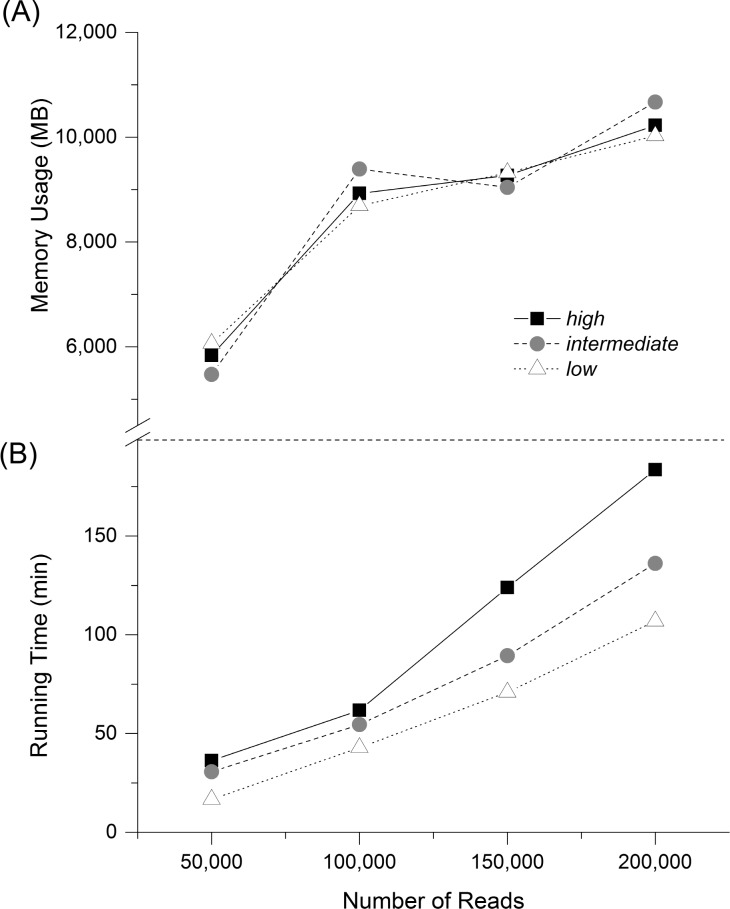
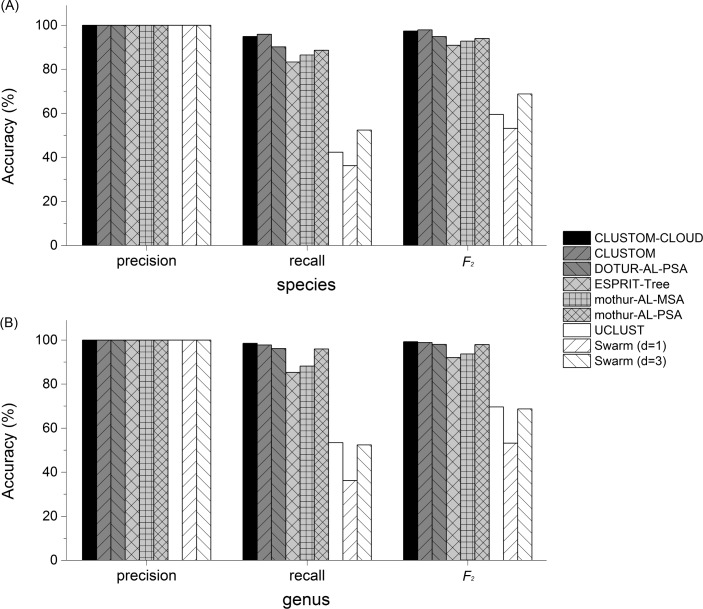
High-throughput sequencing can produce hundreds of thousands of 16S rRNA sequence reads corresponding to different organisms present in the environmental samples. Typically, analysis of microbial diversity in bioinformatics starts from pre-processing followed by clustering 16S rRNA reads into relatively fewer operational taxonomic units (OTUs). The OTUs are reliable indicators of microbial diversity and greatly accelerate the downstream analysis time. However, existing hierarchical clustering algorithms that are generally more accurate than greedy heuristic algorithms struggle with large sequence datasets. To keep pace with the rapid rise in sequencing data, we present CLUSTOM-CLOUD, which is the first distributed sequence clustering program based on In-Memory Data Grid (IMDG) technology-a distributed data structure to store all data in the main memory of multiple computing nodes. The IMDG technology helps CLUSTOM-CLOUD to enhance both its capability of handling larger datasets and its computational scalability better than its ancestor, CLUSTOM, while maintaining high accuracy. Clustering speed of CLUSTOM-CLOUD was evaluated on published 16S rRNA human microbiome sequence datasets using the small laboratory cluster (10 nodes) and under the Amazon EC2 cloud-computing environments. Under the laboratory environment, it required only ~3 hours to process dataset of size 200 K reads regardless of the complexity of the human microbiome data. In turn, one million reads were processed in approximately 20, 14, and 11 hours when utilizing 20, 30, and 40 nodes on the Amazon EC2 cloud-computing environment. The running time evaluation indicates that CLUSTOM-CLOUD can handle much larger sequence datasets than CLUSTOM and is also a scalable distributed processing system. The comparative accuracy test using 16S rRNA pyrosequences of a mock community shows that CLUSTOM-CLOUD achieves higher accuracy than DOTUR, mothur, ESPRIT-Tree, UCLUST and Swarm. CLUSTOM-CLOUD is written in JAVA and is freely available at http://clustomcloud.kopri.re.kr.
Conflict of interest statement
Figures

Similar articles
-
CLUSTOM: a novel method for clustering 16S rRNA next generation sequences by overlap minimization.PLoS One. 2013 May 1;8(5):e62623. doi: 10.1371/journal.pone.0062623. Print 2013. PLoS One. 2013. PMID: 23650520 Free PMC article.
-
hc-OTU: A Fast and Accurate Method for Clustering Operational Taxonomic Units Based on Homopolymer Compaction.IEEE/ACM Trans Comput Biol Bioinform. 2018 Mar-Apr;15(2):441-451. doi: 10.1109/TCBB.2016.2535326. Epub 2016 Feb 26. IEEE/ACM Trans Comput Biol Bioinform. 2018. PMID: 26930691
-
DBH: A de Bruijn graph-based heuristic method for clustering large-scale 16S rRNA sequences into OTUs.J Theor Biol. 2017 Jul 21;425:80-87. doi: 10.1016/j.jtbi.2017.04.019. Epub 2017 Apr 26. J Theor Biol. 2017. PMID: 28454900
-
Considerations For Optimizing Microbiome Analysis Using a Marker Gene.Front Nutr. 2016 Aug 8;3:26. doi: 10.3389/fnut.2016.00026. eCollection 2016. Front Nutr. 2016. PMID: 27551678 Free PMC article. Review.
-
Reintroducing mothur: 10 Years Later.Appl Environ Microbiol. 2020 Jan 7;86(2):e02343-19. doi: 10.1128/AEM.02343-19. Print 2020 Jan 7. Appl Environ Microbiol. 2020. PMID: 31704678 Free PMC article. Review.
Cited by
-
Changes in the intestinal microbiota of superobese patients after bariatric surgery.Clinics (Sao Paulo). 2019 Oct 28;74:e1198. doi: 10.6061/clinics/2019/e1198. eCollection 2019. Clinics (Sao Paulo). 2019. PMID: 31664418 Free PMC article.
References
-
- Hill MO. Diversity and evenness: a unifying notation and its consequences. Ecology. 1973;54(2):427–32.
Publication types
MeSH terms
Substances
LinkOut - more resources
Full Text Sources
Other Literature Sources
