. 2016 Mar 9:7:10934.
doi: 10.1038/ncomms10934.

Editing of mouse and human immunoglobulin genes by CRISPR-Cas9 system

Affiliations

Editing of mouse and human immunoglobulin genes by CRISPR-Cas9 system

Taek-Chin Cheong et al. Nat Commun. .

Abstract

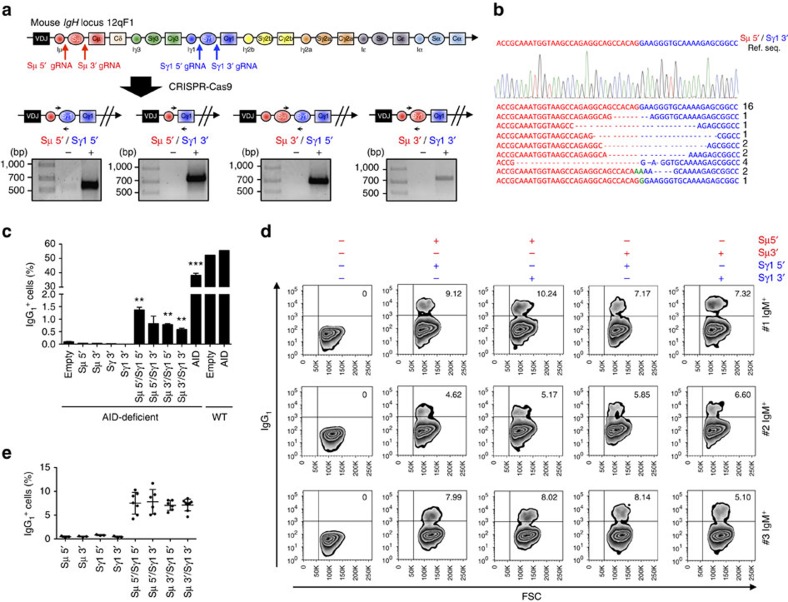
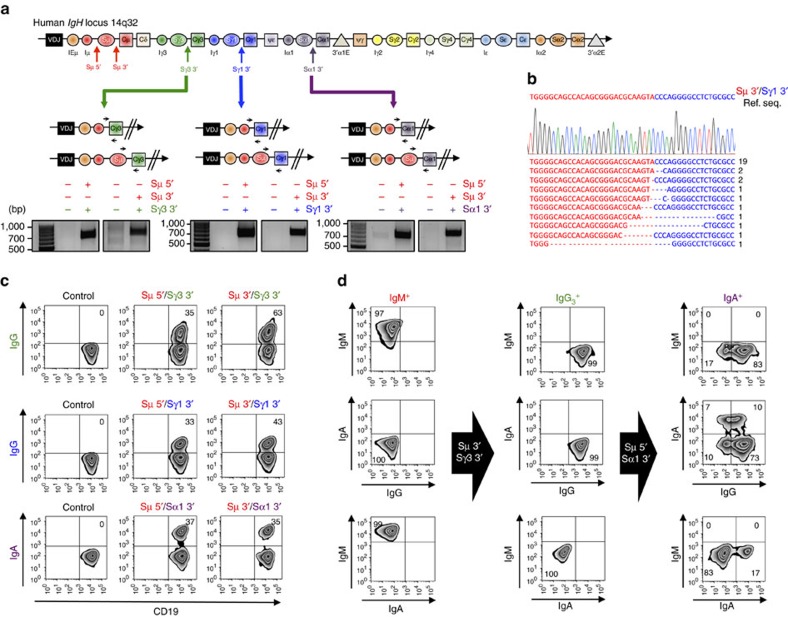
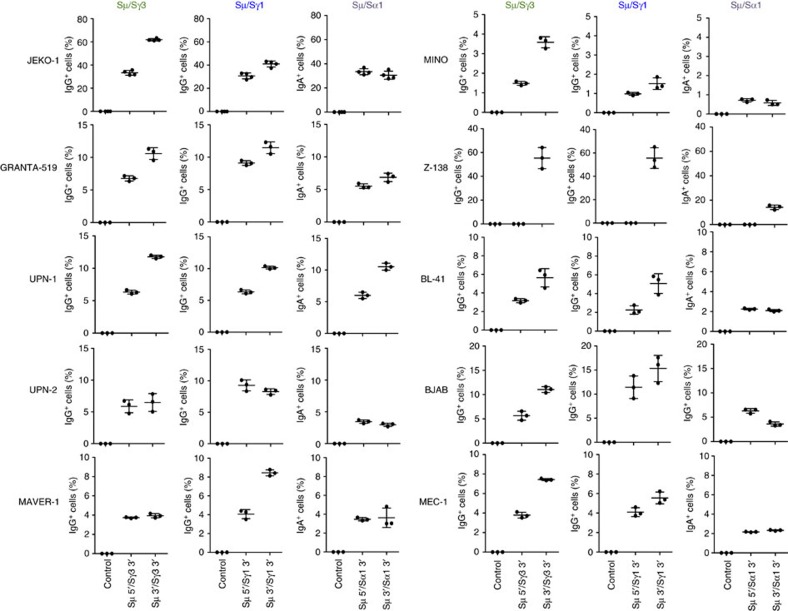
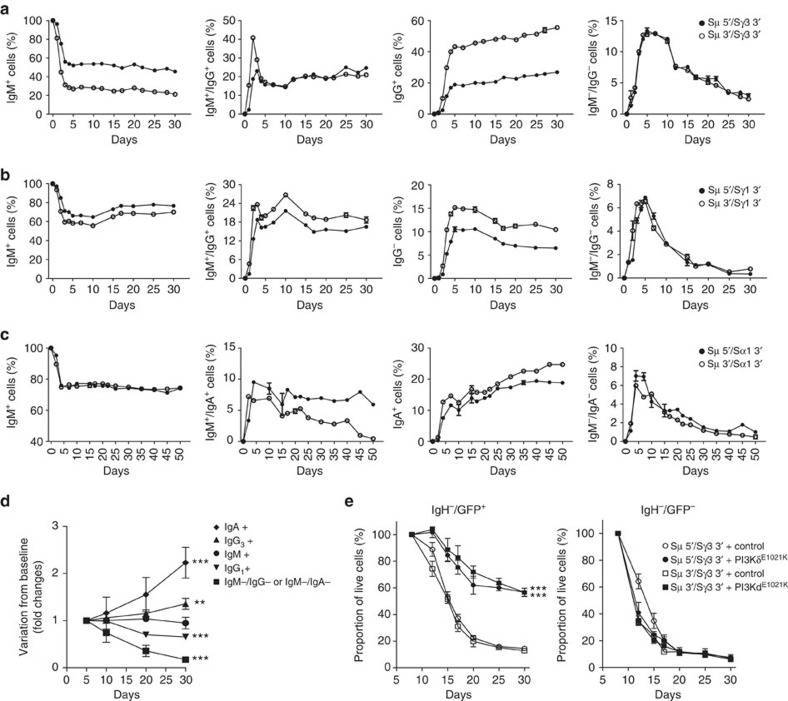
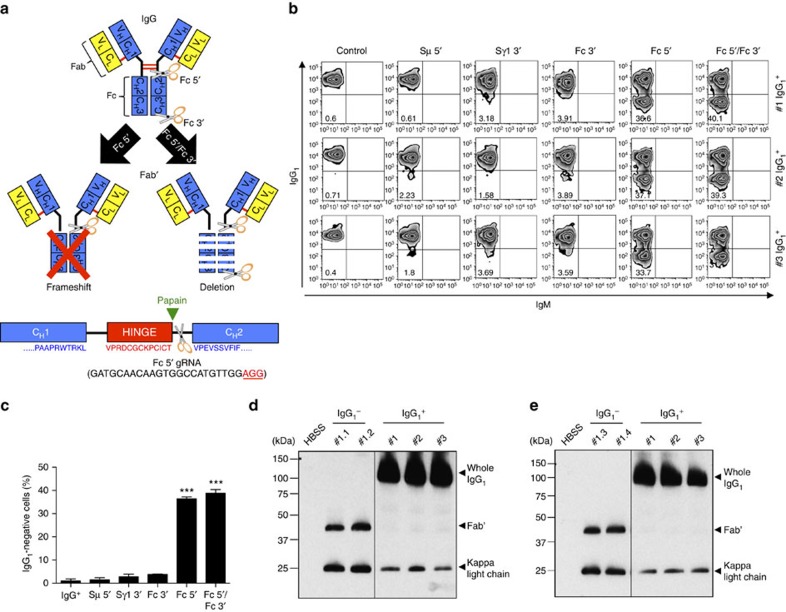
Applications of the CRISPR-Cas9 system to edit the genome have widely expanded to include DNA gene knock-out, deletions, chromosomal rearrangements, RNA editing and genome-wide screenings. Here we show the application of CRISPR-Cas9 technology to edit the mouse and human immunoglobulin (Ig) genes. By delivering Cas9 and guide-RNA (gRNA) with retro- or lenti-virus to IgM(+) mouse B cells and hybridomas, we induce class-switch recombination (CSR) of the IgH chain to the desired subclass. Similarly, we induce CSR in all human B cell lines tested with high efficiency to targeted IgH subclass. Finally, we engineer mouse hybridomas to secrete Fab' fragments instead of the whole Ig. Our results indicate that Ig genes in mouse and human cells can be edited to obtain any desired IgH switching helpful to study the biology of normal and lymphoma B cells. We also propose applications that could transform the technology of antibody production.


Figures

Figure 1
Figure 1. Induction of class-switch recombination (CSR) by CRISPR-Cas9 system in mouse cells.
(a) Top: genomic organization of the mouse IgH constant region locus and position of the gRNAs used in this study. Bottom: schematic representation of four possible CSR products induced by deletion of DNA segments between Sμ and Sγ1 regions. Black arrows indicate the PCR primers designed to sequence the deletions. Gels show PCR amplicons obtained with the indicated primers. (b) An example chromatogram showing a perfect Sμ 5′ and Sγ1 3′ genomic junction, as well as representative sequences of junctions identified from 30 clones. Ref. Seq., sequence of the predicted genomic junction between Sμ 5′ and Sγ1 3′ regions. Green: insertions; Dashes: deleted bases. (c) Mouse B cells isolated from the spleen of 129S2 WT and AID-deficient mice were activated by anti-CD40 antibody and IL-4 for 1 day and then transduced with retrovirus expressing Cas9 nuclease and gRNAs used in (a). Empty GFP- or AID- expressing retroviruses were used as negative or positive controls, respectively. At day 4, cells were collected, stained with IgG1 antibody, and then analysed by flow cytometry. IgG1+ cells were gated on GFP-positive population. Mean±s.d.; n=3 biological replicates for each condition. Statistical analysis determined using unpaired t-test (**P<0.01; ***P<0.001). (d,e) IgM+ hybridomas were transduced with four different combinations of lentiviruses expressing Cas9 nuclease and gRNAs as above. Representative zebra plots (d) and average percentages±s.d. of CSR (e) from six independent experiments are presented.
Figure 2
Figure 2. Induction of CSR by CRISPR-Cas9 system in human B cell lines.
(a) Top: genomic organization of the human IgH constant region locus and position of the gRNAs. Bottom: schematic representation of six possible CSR products induced by deletions between Sμ and Sγ3, Sγ1 or Sα1 regions. Black arrows indicate the PCR primers designed to detect deletion. Gels show PCR amplicons obtained with the indicated primers. (b) Representative sequences of junctions identified from 30 clones for Sμ 3′ and Sγ1 3′ genomic region. Ref. Seq., sequence of the predicted genomic junction between Sμ 3′ and Sγ1 3′ region. Dashes: deleted bases. (c) IgM+ JEKO-1 cells were transduced with lentiviruses expressing Cas9 nuclease and gRNAs targeting Sμ and Sγ3, Sγ1 or Sα1 flanking regions. Cells were collected, co-stained with antibodies against CD19 and IgG or IgA, and analysed by flow cytometry. Representative zebra plots from three independent experiments are presented. Percentages of events are indicated in the corresponding quadrants. (d) To induce sequential CSR from IgM to IgG and then to IgA, IgM+ JEKO-1 cells were transduced with lentiviruses expressing Cas9 nuclease and gRNAs targeting Sμ 3′ and Sγ3 3′ flanking regions to generate IgG3+ JEKO-1 cells. IgG3+ cells were transduced again with lentiviruses expressing Cas9 nuclease and gRNAs targeting Sμ 5′ and Sα1 3′ flanking regions. Four days later, cells were collected, co-stained with IgM, IgG, or IgA antibodies and analysed by flow cytometry. Representative zebra plots from three independent experiments are presented. Percentages of events are indicated in the corresponding quadrants.
Figure 3
Figure 3. CSR in a panel of human B-cell lymphoma lines.
Ten different human B-cell lymphoma lines (JEKO-1, GRANTA-519, UPN-1, UPN-2, MAVER-1, MINO, Z-138, BL-41, BJAB and MEC-1) were transduced with lentiviruses expressing Cas9 nuclease and gRNAs targeting Sμ and Sγ3, Sγ1, or Sα1 flanking regions. Two days later, cell lines were selected with puromycin (0.2 μg ml−1) for 3 days. Live cells were collected, co-stained with CD19 and IgG or IgA antibodies, and analysed by flow cytometry. As a control, non-transduced or single lentivirus-transduced cells were used. Data were analysed by FlowJo software. Mean±s.d.; n=3 biological replicates for each condition.
Figure 4
Figure 4. Biological effects of IgH subclass switch in human lymphoma cell growth.
(ac) To understand the growth of B cells after switch of the IgH subclass, JEKO-1 cells were co-transduced with two lentiviruses expressing Cas9 nuclease and gRNAs targeting Sμ, Sγ3 3′ (a), Sγ1 3′ (b) and Sα1 3′ (c) flanking regions. Cells were co-stained with antibodies against IgM and IgG or IgA and analysed by flow cytometry over time. (d) Statistical analysis of relative growth rates from lymphoma cells from Fig. 4a–c. Data are from at least four experiments in each condition. P values are calculated for each IgH subclass compared with native IgM+ cells. Data are expressed as mean ±s.d. for four independent experiments. Statistical analysis determined using two-way ANOVA (**P<0.01; ***P<0.001). (e) JEKO-1 cells were transduced with lentiviruses expressing Cas9 nuclease and gRNAs targeting Sμ and Sγ 3 regions. After 5 days, cells were transduced with retroviral vector expressing PI3KδE1021K or control vector. Cells were co-stained with antibodies against IgM and IgG to allow the gating on the IgH-negative population (IgH=IgM/IgG) and percentages of GFP+ cells were analysed over time by flow cytometry. As additional control IgH- cells not transduced with the retrovirus (GFP) were analysed. Data are from two independent experiments each repeated in duplicates and are expressed as mean±s.d. Statistical analysis determined using two-way ANOVA (***P<0.001).
Figure 5
Figure 5. Generation of Fab′ fragments by CRISPR-Cas9 system in mouse hybridomas.
(a) Top: schematic representation of mouse IgG antibody and target sites of two different gRNAs used for Fab′ fragment production. By using lentiviruses expressing Cas9 nuclease and Fc 5′ or Fc 5′/Fc 3′ guide RNAs, Fab′ fragments were produced by frameshift (left) or deletion (right) of the IgH Fc fragment, respectively. Bottom: schematic depiction of 5′ gRNA (scissors) in reference to the papain cleavage site. PAM sequence is underlined in red text. (b) IgG1+ hybridomas were transduced with lentivirus expressing Cas9 nuclease and gRNAs targeting Fc 5′ or Fc 5′ and Fc3′ regions. gRNAs targeting Sμ 5′, Sγ1 3′ or Fc 3′ were used as negative controls. Hybridomas were selected with puromycin, stained with IgM and IgG1 antibodies, and analysed by flow cytometry. Representative zebra plots from three different IgG1+ hybridomas are presented. Percentages of events are indicated in the corresponding quadrants. (c) Histograms representing the percentages of IgG-negative cells are shown with mean±s.d.; n=3 biological replicates for each condition. Statistical analysis determined using unpaired t-test (***P<0.001). (d,e) Western blot analyses of Fab′ fragments from hybridoma supernatants. IgG1+ hybridomas were transduced with lentiviruses expressing Cas9 nuclease and gRNAs targeting Fc 5′ or Fc 5′ and Fc3′ regions and IgG1-negative single clones were obtained by serial dilution. Examples of two clones from the frameshift approach (d; #1.1 and #1.2; purity >99%) and two clones from the deletion approach (e; #1.3 and #1.4; purity >99%) are shown. Supernatants were loaded on a SDS–PAGE in non-reducing condition, and developed with an anti-mouse kappa-light chain antibody. Three different IgG1+ hybridomas were used as controls.

Similar articles

Cited by

References

    1. Gostissa M., Alt F. W. & Chiarle R. Mechanisms that promote and suppress chromosomal translocations in lymphocytes. Annu. Rev. Immunol. 29, 319–350 (2011). - PubMed
    1. Jung D., Giallourakis C., Mostoslavsky R. & Alt F. W. Mechanism and control of V(D)J recombination at the immunoglobulin heavy chain locus. Annu. Rev. Immunol. 24, 541–570 (2006). - PubMed
    1. Stavnezer J., Guikema J. E. J. & Schrader C. E. Mechanism and regulation of class switch recombination. Annu. Rev. Immunol. 26, 261–292 (2008). - PMC - PubMed
    1. Boboila C., Alt F. W. & Schwer B. Classical and alternative end-joining pathways for repair of lymphocyte-specific and general DNA double-strand breaks. Adv. Immunol. 116, 1–49 (2012). - PubMed
    1. Gostissa M. et al. IgH class switching exploits a general property of two DNA breaks to be joined in cis over long chromosomal distances. Proc. Natl Acad. Sci. USA 111, 2644–2649 (2014). - PMC - PubMed

Publication types

Substances