Review
. 2016 May;73(10):1989-2016.
doi: 10.1007/s00018-016-2163-8. Epub 2016 Mar 8.

Sweet complementarity: the functional pairing of glycans with lectins

Affiliations
Review

Sweet complementarity: the functional pairing of glycans with lectins

H-J Gabius et al. Cell Mol Life Sci. 2016 May.

Abstract

Carbohydrates establish the third alphabet of life. As part of cellular glycoconjugates, the glycans generate a multitude of signals in a minimum of space. The presence of distinct glycotopes and the glycome diversity are mapped by sugar receptors (antibodies and lectins). Endogenous (tissue) lectins can read the sugar-encoded information and translate it into functional aspects of cell sociology. Illustrated by instructive examples, each glycan has its own ligand properties. Lectins with different folds can converge to target the same epitope, while intrafamily diversification enables functional cooperation and antagonism. The emerging evidence for the concept of a network calls for a detailed fingerprinting. Due to the high degree of plasticity and dynamics of the display of genes for lectins the validity of extrapolations between different organisms of the phylogenetic tree yet is inevitably limited.

Keywords: Agglutinin; Antibodies; Glycobiology; Glycome; Lectins; Sialylation; Sugar code.


Figures

Fig. 1
Fig. 1
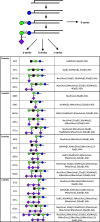
Schematic illustration of the stepwise elongation of a branch of a complex-type N-glycan, starting from the β-GlcNAc-terminated structure. Gal/GalNAc moieties can then be added in alternative routes, and sialylation/sulfation completes the processing
Fig. 2
Fig. 2
Enzymatic routes of Golgi-based synthesis of gangliosides, starting from lactosylceramide in the 0-series, from GM3 in the a-series, from GD3 in the b-series and GT3 in the c-series (for details on terminology, please see [135, 136]). As in branch extensions of glycan chains on glycoproteins, the α2,8-sialylation leads to di- and trisialosides
Fig. 3
Fig. 3
Schematic illustration of the general sulfatide structure. The chain length of the fatty acid can vary so that different forms of this glycosphingolipid are physiologically present
Fig. 4
Fig. 4
Dynamic glycan remodeling by the (cell surface) ganglioside neuraminidase (Neu3). The hydrolytic removal of the branch-end sialic acid converts GD1a to GM1 (for details on ensuing consequences of this processing for ligand properties, please see text)
Fig. 5
Fig. 5
Effect of exposure of human neuroblastoma (SK-N-MC) cells to inhibitors of glucosylceramide biosynthesis to block generation of gangliosides [a, for 10 days; 50 µM N-butyldeoxynojirimycin (open triangle) or 10 µM threo-1-phenyl-2-decanoylamino-3-morpholino-1-propanol (open square)] and to reagents for cholesterol depletion [b; 5 µM hydroxypropyl-β-cyclodextrin (triangle) or 3 µg/ml filipin III (open square)] on binding of radioiodinated galectin-1 (untreated control cells: filled circle). Data of the binding curves (inset) were algebraically processed by Scatchard analysis (from [193])
Fig. 6
Fig. 6
Galectin binding to human neuroblastoma cells and functional competition between galectins in cell growth regulation. a Radioiodinated homodimeric galectin-1 (filled circle solid line) and chimera-type galectin-3 (open triangle dashed line) bind with similar affinity to human neuroblastoma cells, whereas proteolytic removal of the N-terminal stalk section from galectin-3 impairs binding (open circle dotted line); inset binding curves. b Reduction of cell surface binding of labeled galectin-1 by increasing concentrations of label-free galectin-3. c Impact of galectin-1 on cell growth (filled circle) relative to the mock-treated control (open square) and the neutralizing effect of galectin-3 applied at a 10-fold excess relative to the concentration of galectin-1 (open triangle) (from Figs. 6–8 in [201], extended by Fig. 2E, F in [192])
Fig. 7
Fig. 7
Schematic illustration of the three types of modular arrangement of galectins, with the five canonical CGs as example. The proto-type (homodimeric) proteins with similarity to mammalian galectins-1 and -2 (the paralogue pair CG-1A/-B and CG-2; relative positioning of CRDs given as in respective crystal structures), the chimera-type CG-3 (constituted by the C-terminal carbohydrate recognition domain (CRD), 10 Gly/Pro-rich sequence repeats with a length of five to eight amino acids and an N-terminal peptide with two sites for Ser phosphorylation) and the tandem-repeat-type CG (with two different CRDs separated by a linker, its two lengths arising from alternative splicing) with similarity to mammalian galectin-8, thus referred to as CG-8
Fig. 8
Fig. 8
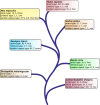
Phylogenetic tree of model organisms and their display of canonical galectins (for modes of modular organization, please see Fig. 7) on the level of the gene (Roman number), transcript (Arabic number) and produced protein (numerical information). For details on search algorithms and data bases, please see [103, 253]
Fig. 9
Fig. 9
Immunohistochemical detection of CGs by light (ac) and fluorescence (df) microscropy in sections of adult chicken kidney illustrating non-overlapping staining profiles (please see also Fig. S3c, d). For fluorescence microscopy, an Alexa Fluor 568-labeled second-step antibody (goat anti-rabbit IgG) was used to visualize sites of binding by the primary (CG-specific) antibody preparation (please see also Fig. 10). Application of anti-CG-1B served as control to exclude antigen-independent staining (a, d). Epithelial cells of collecting tubules (arrowheads) were negative for CG-1A (b, e), but positive for CG-3 (c, f). Intensity of staining of the epithelial cells of thick loops (arrows) was mostly strong for CG-1A (b, e), but negative to weak for CG-3 (c, f). The following concentrations of antibodies were used after systematic testing in each case to reach an optimal signal-to-background ratio: anti-CG-1B: 0.5 µg/ml (a, d), anti-CG-1A: 1 µg/ml (b, e) and anti-CG-3: 0.016 µg/ml (c) or 0.06 µg/ml (f). Scale bar in a is 10 µm and applies to microphotographs af (for details on tissue preparation and the immunohistochemical protocol, please see [214, 215, 274, 275]; Table S1 in [214] summarizes the immunohistochemical data reported in [214, 274, 275], Figs. 10i and 11 in [214] as well as Figs. 8 and 9 in [186] present respective microphotographs)
Fig. 10
Fig. 10
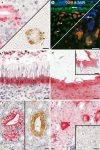
Illustration of the diversity of subcellular localization of CGs. In light microscopy, red coloring is based on alkaline phosphatase/Vector Red substrate reaction, brown color is generated by horseradish peroxidase/diaminobenzidine (H2O2) reaction. In both cases, an enzyme-second antibody conjugate was applied. Counterstaining with hemalaun was generally done except for panel a (bottom right). a Presence of CG-3 was detected in cell nuclei of collecting tubules (arrowheads) in sections of kidney using two different histochemical detection systems. b Fluorescent CG-3-dependent staining of nuclei (magenta, arrowheads) of hypertrophic chondrocytes (left) and multinucleated osteoclasts (right) in developing bone after applying the first-step anti-CG-3 antibody, then Alexa Fluor 568-labeled second-step antibody (red) and finally 4′,6-diamidino-2-phenylindole (DAPI) for counterstaining of nuclei (blue, arrows). c Subnuclear (arrowheads) presence of CG-3 in epithelial cells of the ureter. d and inset to d Extracellular presence of CG-3 in the stratified squamous epithelium of the esophagus shown at two levels of magnification. e Presence of CG-2 in collecting ducts of kidney was confined to the apical cytoplasm of the epithelial cells, visualized by two detection systems as in a. f Intense signal for cytoplasmic CG-8 presence in epithelial cells of distal tubules of the adult kidney (inset: control without incubation step with first-step antibody). Antibodies were used in the following concentrations after systematic testing in each case to reach an optimal signal-to-background ratio: anti-CG-3 in a, c 0.016 µg/ml, in b 0.5 µg/ml, and in d 1 µg/ml; e anti-CG-2: 0.0625 µg/ml; f anti-CG-8: 2 µg/ml. Scale bars are 10 µm (a, c, f), 20 µm (b, d, e), 100 µm (inset to f), and 200 µm (inset to d) (for details on the immunohistochemical protocol, please see [214, 215]; Table 2 in [103], along with microphotographs in Fig. 8 [103], summarizes respective observations, also as originally given for CG-2/CG-8 in [274, 275])
Fig. 11
Fig. 11
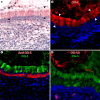
Histochemical detection of accessible binding sites for labeled CGs by light (a) and fluorescence (bd) microscopy in sections of adult chicken ureter. a, b Staining by labeled CG-3 was most prominent in the apical part of cells in the pseudo-stratified epithelial lining of the ureter’s mucosa (arrowheads). c Consecutive application of anti-CG-3-specific first-step antibody detecting endogenous CG-3 with Alexa Fluor 488-labeled second-step (goat anti-rabbit) antibody and then of Alexa Fluor 555-labeled CG-3 to detect binding sites for the lectin led to visualization of CG-3-binding sites in the aforementioned apical parts of the respective epithelial cells, clearly separated from CG–3’s presence in the basal part of these cells. d Differences in reactivity profiles for two CGs were visualized with Alexa Fluor 488-labeled CG-3 and Alexa Fluor 555-labeled CG-1A. Binding sites for CG-3 were found in the epithelial cells of the ureter’s mucosa, whereas CG-1A strongly bound in the ureter’s lumen. Color coding for assignment of red/green to the respective probe is given in bd, nuclear staining with DAPI adds the blue color. Reagents were used in the following concentrations after systematic testing in each case to optimal signal-to-background ratio: CG-3: 1 µg/ml (a) or 8 µg/ml (b, c, d), anti-CG-3: 0.125 µg/ml (c), CG-1A: 8 µg/ml (d). Scale bar in a is 10 µm and applies to microphotographs ad (for details on the galectin histochemical processing, please see [215, 234, 239]; from experiments for Fig. 10 in [186], further microphotographs on CG histochemistry in Fig. 8 in [215])
Fig. 12
Fig. 12
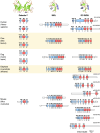
Schematic illustration of the copy number and architecture of genes for proto-type galectin-7, MGL and DC-SIGN/DC-SIGNR (domain structure placed in the top section in each case) of selected mammals. Exons are drawn as boxes (colored) in red when coding for the CRD, otherwise presented in blue, introns as lines (length drawn in proportions). Lengths of exons in base pairs are given in Arabic numbers, order of exons in Roman numerals (for technical details, please see [214, 253])

References

    1. Sharon N (1975) Complex Carbohydrates. Their Chemistry, Biosynthesis, and Functions. Addison-Wesley Publ. Co., Reading, MA, USA
    1. Reuter G, Gabius H-J. Eukaryotic glycosylation: whim of nature or multipurpose tool? Cell Mol Life Sci. 1999;55(3):368–422. doi: 10.1007/s000180050298. - DOI - PMC - PubMed
    1. Haji-Ghassemi O, Blackler RJ, Young NM, Evans SV. Antibody recognition of carbohydrate epitopes. Glycobiology. 2015;25(9):920–952. doi: 10.1093/glycob/cwv037. - DOI - PubMed
    1. Avery OT, Macleod CM, McCarty M. Studies on the chemical nature of the substance inducing transformation of pneumococcal types: induction of transformation by a desoxyribonucleic acid fraction isolated from pneumococcus type I. J Exp Med. 1944;79(2):137–158. doi: 10.1084/jem.79.2.137. - DOI - PMC - PubMed
    1. Ioffe E, Stanley P. Mice lacking N-acetylglucosaminyltransferase I activity die at mid-gestation, revealing an essential role for complex or hybrid N-linked carbohydrates. Proc Natl Acad Sci USA. 1994;91(2):728–732. doi: 10.1073/pnas.91.2.728. - DOI - PMC - PubMed

LinkOut - more resources