

The Association Between Neighborhood Poverty and HIV Diagnoses Among Males and Females in New York City, 2010-2011
- PMID: 26957664
- PMCID: PMC4765978
- DOI: 10.1177/003335491613100213
The Association Between Neighborhood Poverty and HIV Diagnoses Among Males and Females in New York City, 2010-2011
Abstract
Objective: We assessed the association of neighborhood poverty with HIV diagnosis rates for males and females in New York City.
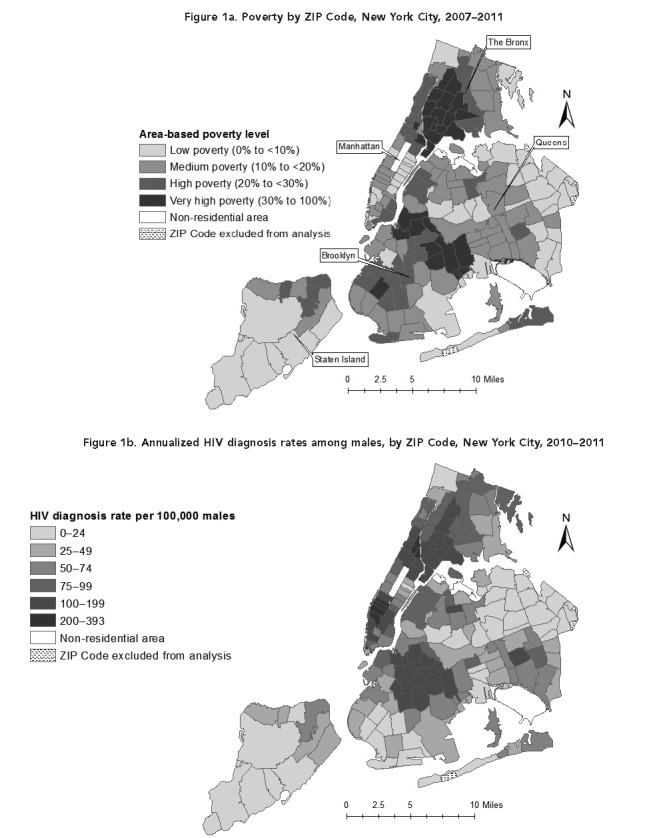
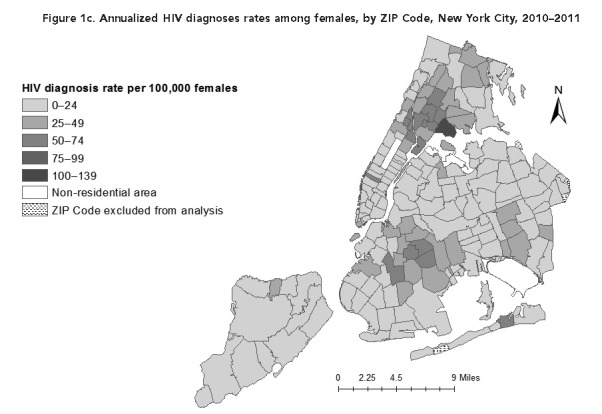
Methods: We calculated annual HIV diagnosis rates by ZIP Code, sex, and neighborhood poverty level using 2010-2011 New York City (NYC) HIV surveillance data and data from the U.S. Census 2010 and American Community Survey 2007-2011. Neighborhood poverty levels were percentage of residents in a ZIP Code with incomes below the federal poverty threshold, categorized as 0%-<10% (low poverty), 10%-<20% (medium poverty), 20%-<30% (high poverty), and 30%-100% (very high poverty). We used sex-stratified negative binomial regression models to measure the association between neighborhood-level poverty and HIV diagnosis rates, controlling for neighborhood-level education, race/ethnicity, age, and percentage of men who have sex with men.
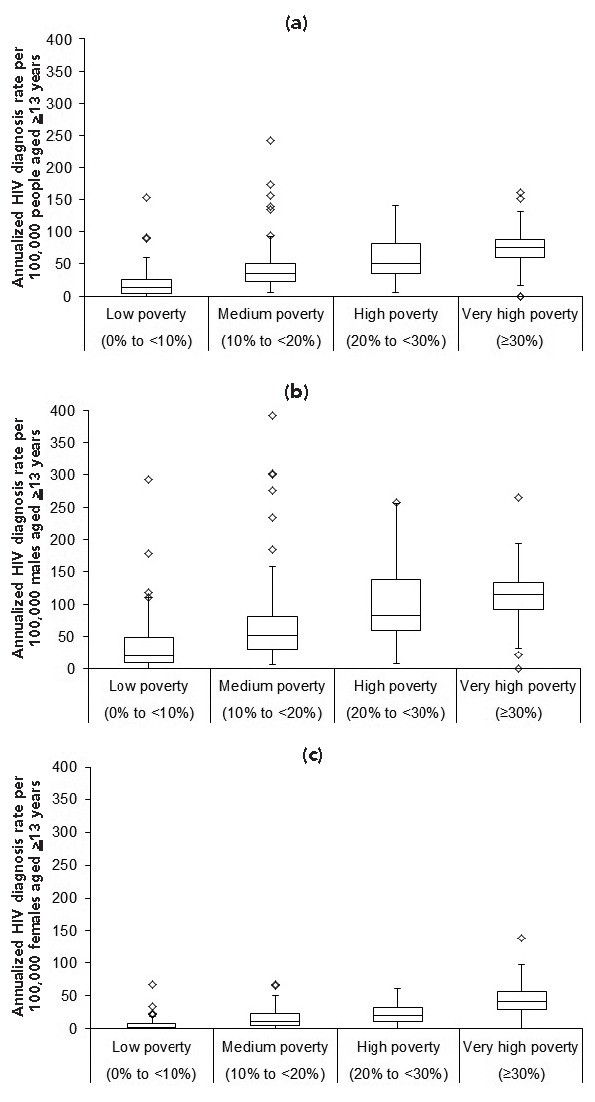
Results: In 2010-2011, 6,184 people were newly diagnosed with HIV. Median diagnosis rates per 100,000 population increased by neighborhood poverty level overall (13.7, 34.3, 50.6, and 75.6 for low-, medium-, high-, and very high-poverty ZIP Codes, respectively), for males, and for females. In regression models, higher neighborhood poverty remained associated with higher diagnosis rates among males (adjusted rate ratio [ARR] = 1.63, 95% confidence interval [CI] 1.34, 1.97) and females (ARR=2.14, 95% CI 1.46, 3.14) for very high- vs. low-poverty ZIP Codes.
Conclusion: Living in very high- vs. low-poverty urban neighborhoods was associated with increased HIV diagnosis rates. After controlling for other factors, the association between poverty and diagnosis rates was stronger among females than among males. Alleviating poverty may help decrease HIV-related disparities.
Figures
References
-
- Centers for Disease Control and Prevention (US) Diagnoses of HIV infection in the United States and dependent areas, 2013. HIV Surveillance Report. 2015;25:1–82. Atlanta: CDC; 2015.
-
- The White House (US), Office of National AIDS Policy. National HIV/AIDS strategy. 2010 [cited 2015 Nov 20] Available from: https://www.whitehouse.gov/administration/eop/onap/nhas.
-
- Centers for Disease Control and Prevention (US) High-impact HIV prevention: CDC's approach to reducing HIV infections in the United States. 2011 [cited 2015 Nov 20] Available from: http://www.cdc.gov/hiv/policies/hip/hip.html.
-
- Centers for Disease Control and Prevention (US) Social determinants of health among adults with diagnosed HIV infection in 18 areas, 2005–2009. HIV Surveillance Supplemental Report. 2013;18:1–28. Atlanta: CDC; 2013.
-
- Yen IH, Kaplan GA. Neighborhood social environment and risk of death: multilevel evidence from the Alameda County Study. Am J Epidemiol. 1999;149:898–907. - PubMed
MeSH terms
LinkOut - more resources
Full Text Sources
Other Literature Sources
Medical
