. 2016 Mar 8:9:10.
doi: 10.1186/s13072-016-0058-4. eCollection 2016.

Tissue-independent and tissue-specific patterns of DNA methylation alteration in cancer

Affiliations

Tissue-independent and tissue-specific patterns of DNA methylation alteration in cancer

Yuting Chen et al. Epigenetics Chromatin. .

Abstract

Background: There is growing evidence that DNA methylation alterations contribute to carcinogenesis. While cancer tissue exhibits widespread DNA methylation changes, the proportion of tissue-specific versus tissue-independent DNA methylation alterations in cancer is unclear. In addition, it is unknown which factors determine the patterns of aberrant DNA methylation in cancer.

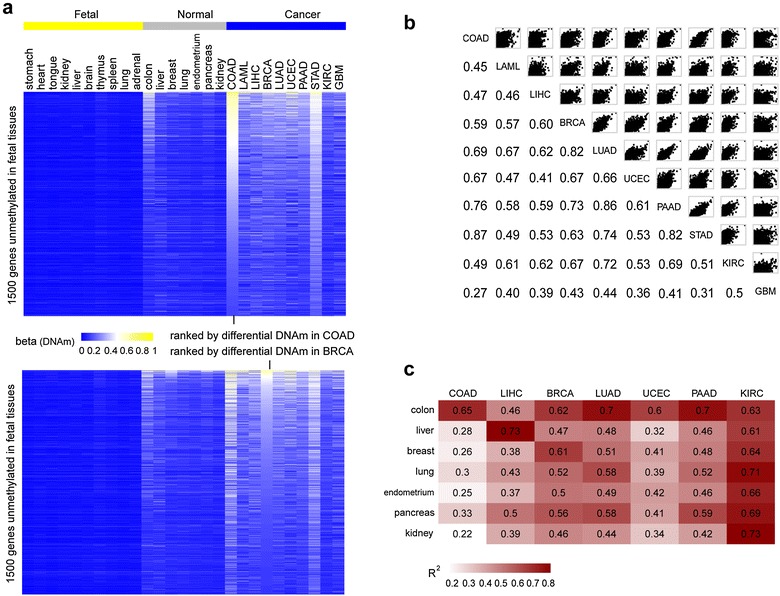
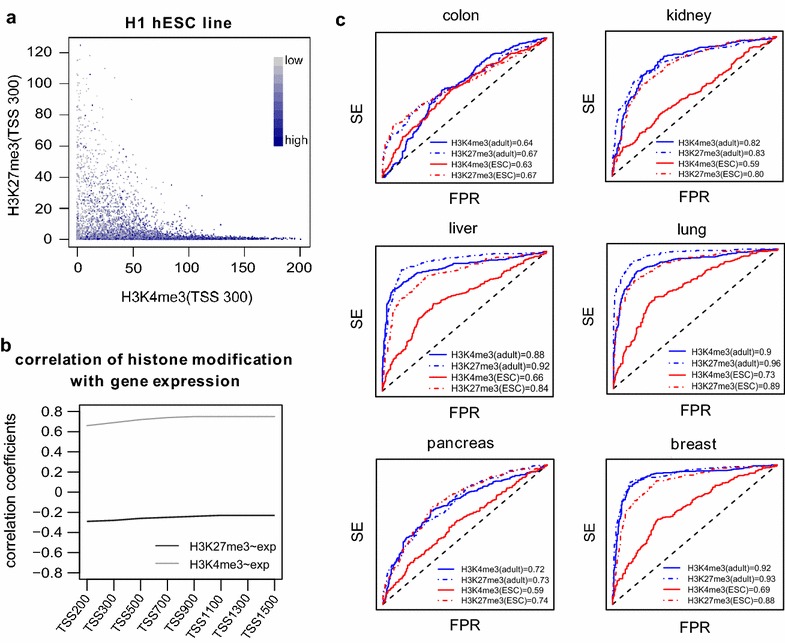
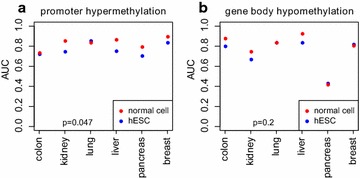
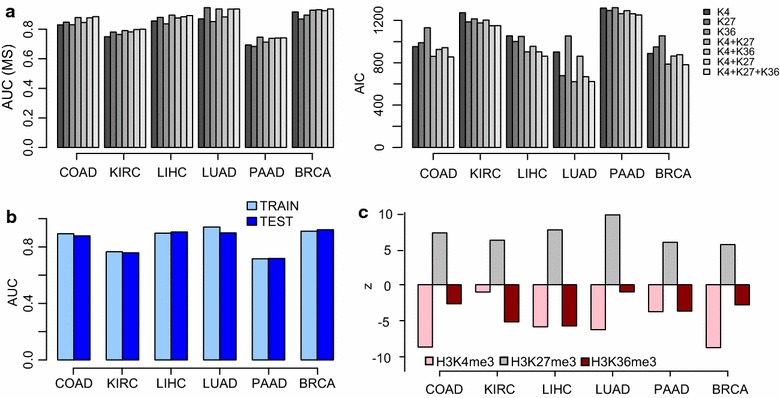
Results: Using HumanMethylation450 BeadChips (450k), we here analyze genome-wide DNA methylation patterns of ten types of fetal tissue, in addition to matched normal-cancer data for corresponding tissue types, encompassing over 3000 samples. We demonstrate that the level of aberrant cancer DNA methylation in gene promoters and gene bodies is highly correlated between cancer types. We estimate that up to 60 % of the DNA methylation variation in a cancer genome of a given tissue type is explained by the corresponding variation in a cancer genome of another type, implying that much of the cancer DNA methylation landscape is tissue independent. We further show that histone marks in normal cells are better predictors of aberrant cancer DNA methylation than the corresponding signals in human embryonic stem cells. We build predictors of cancer DNA methylation patterns and show that although inclusion of three histone marks (H3K4me3, H3K27me3 and H3K36me3) improves model accuracy, the bivalent marks are the most predictive. Finally, we show that chromatin accessibility of gene promoters in normal tissue dictates the promoter's propensity to acquire aberrant DNA methylation in cancer in so far as it determines its level of DNA methylation in normal tissue.

Conclusions: Our data show that a considerable fraction of the aberrant cancer DNA methylation landscape results from a mechanism that is largely tissue specific. Histone marks as specified in the normal cell of origin provide highly predictive models of aberrant cancer DNA methylation and outperform those derived from the same marks in hESCs.

Keywords: Bivalency; Cancer; Chromatin; DNA methylation; Histone.


Figures

Fig. 1
Fig. 1
Tissue-independent cancer DNA methylation patterns. a Top heatmap depicts the DNA methylation values of 1500 top-ranked cu-GPs, ranked by level of hypermethylation in colon cancer (COAD), across all fetal tissue types, adult normal tissue and age-matched cancer types from the TCGA. Lower heatmap is the analog for top 1500 cu-GPs, ranked according to hypermethylation in breast cancer (BRCA). In every case, we show the average DNAm values in each phenotype. b Upper diagonal Scatterplots of average DNAm levels of the 8360 cu-GPs between each cancer type. Lower diagonal corresponding R 2 (Pearson) correlation values. c Heatmap of correlation R 2 values of the average DNAm levels of the 8360 cu-GPs in a given cancer type against the corresponding DNAm levels in normal tissue
Fig. 2
Fig. 2
Prediction of tissue-specific cancer DNAm patterns from bivalent marks in normal cells. a Scatter plot shows the association between gene expression with promoter H3K4me3 (x-axis) and H3K27me3 (y-axis) occupancy. b Pearson's correlation coefficients calculated between promoter H3K4me3 and H3K27me3 modification with corresponding gene expression levels in H1 hESC line, as function of the window size (bp) centered at the TSS over which the signal is estimated. c ROC-AUC analysis assessing the predictive potential of cancer-associated hypermethylation at unmethylated GPs in normal tissue from H3K4me3 and H3K27me3 promoter signals in normal tissue and hESC cells, as indicated. Each panel is for a given tissue and cancer type
Fig. 3
Fig. 3
Prediction accuracy of tissue-specific cancer DNAm patterns from the H3K36me3 signal. a Scatter plot shows the area under the curve (AUC) prediction accuracy (y-axis) of promoter hypermethylation in cancer from the H3K36me3 signal in the corresponding normal tissue or hESC, as indicated. Normal/cancer tissues considered include colon (COAD), kidney (KIRC), lung (LUAD), liver (LIHC), pancreas (PAAD) and breast (BRCA). P value is from a paired Wilcoxon rank sum test. b As a, but now predicting gene-body hypomethylation in cancer
Fig. 4
Fig. 4
Prediction accuracy of tissue-specific cancer DNAm patterns from the H3K36me3 signal. a Left panel depicts a barplot of the AUC of seven different models (as obtained in the cross-validation model selection step) in predicting promoter DNA hypermethylation in cancer, for each of six different cancer types (COAD, KIRC, LIHC, LUAD, PAAD and BRCA), as indicated. High AUC values indicate better models. Right panel depicts the Akaike information criterion (AIC) values of each model in each cancer type. Lower AIC values indicate better models. b AUC values of optimal model in the mode selection (training) and blind test sets and for each cancer type. c For the model including all three histone signals as predictors, we plot the estimated z-statistics of each predictor of the trained model. Positive (negative) associations indicate that larger (lower) signal values correlate with increased promoter hypermethylation in cancer
Fig. 5
Fig. 5
Patterns of promoter DNAm change in cancer depending on open/closed chromatin. a Boxplots of DNAm β values of gene promoters, stratified according to normal/cancer tissue and whether in or outside of a DHS region, where DHS status is determined in the corresponding normal cell type. DHS data were available for three normal tissues (lung, kidney and pancreas), and hence, there were a total of five cancer types (KIRC, KIRP, LUAD, LUSC and PAAD). Above boxplots, we give the t statistics between normal (N) and cancer (C). Red labels the t statistics when restricted to DHS regions, and blue labels t statistics when restricted to non-DHS regions. Above the plot we give the corresponding t test P values. b As a, but now for bivalently marked gene promoters, with bivalency as determined in the normal cell type

References

    1. Feinberg AP, Ohlsson R, Henikoff S. The epigenetic progenitor origin of human cancer. Nat Rev Genet. 2006;7:21–33. doi: 10.1038/nrg1748. - DOI - PubMed
    1. Berman BP, Weisenberger DJ, Aman JF, Hinoue T, Ramjan Z, Liu Y, Noushmehr H, Lange CP, van Dijk CM, Tollenaar RA, et al. Regions of focal DNA hypermethylation and long-range hypomethylation in colorectal cancer coincide with nuclear lamina-associated domains. Nat Genet. 2012;44:40–46. doi: 10.1038/ng.969. - DOI - PMC - PubMed
    1. Baylin SB, Jones PA. A decade of exploring the cancer epigenome—biological and translational implications. Nat Rev Cancer. 2011;11:726–734. doi: 10.1038/nrc3130. - DOI - PMC - PubMed
    1. Baylin SB, Ohm JE. Epigenetic gene silencing in cancer—a mechanism for early oncogenic pathway addiction? Nat Rev Cancer. 2006;6:107–116. doi: 10.1038/nrc1799. - DOI - PubMed
    1. Hansen KD, Timp W, Bravo HC, Sabunciyan S, Langmead B, McDonald OG, Wen B, Wu H, Liu Y, Diep D, et al. Increased methylation variation in epigenetic domains across cancer types. Nat Genet. 2011;43:768–775. doi: 10.1038/ng.865. - DOI - PMC - PubMed