. 2016 Feb 24;10(1):014121.
doi: 10.1063/1.4942756. eCollection 2016 Jan.

Quantitative analysis of the chemotaxis of a green alga, Chlamydomonas reinhardtii, to bicarbonate using diffusion-based microfluidic device

Affiliations

Quantitative analysis of the chemotaxis of a green alga, Chlamydomonas reinhardtii, to bicarbonate using diffusion-based microfluidic device

Hong Il Choi et al. Biomicrofluidics. .

Abstract

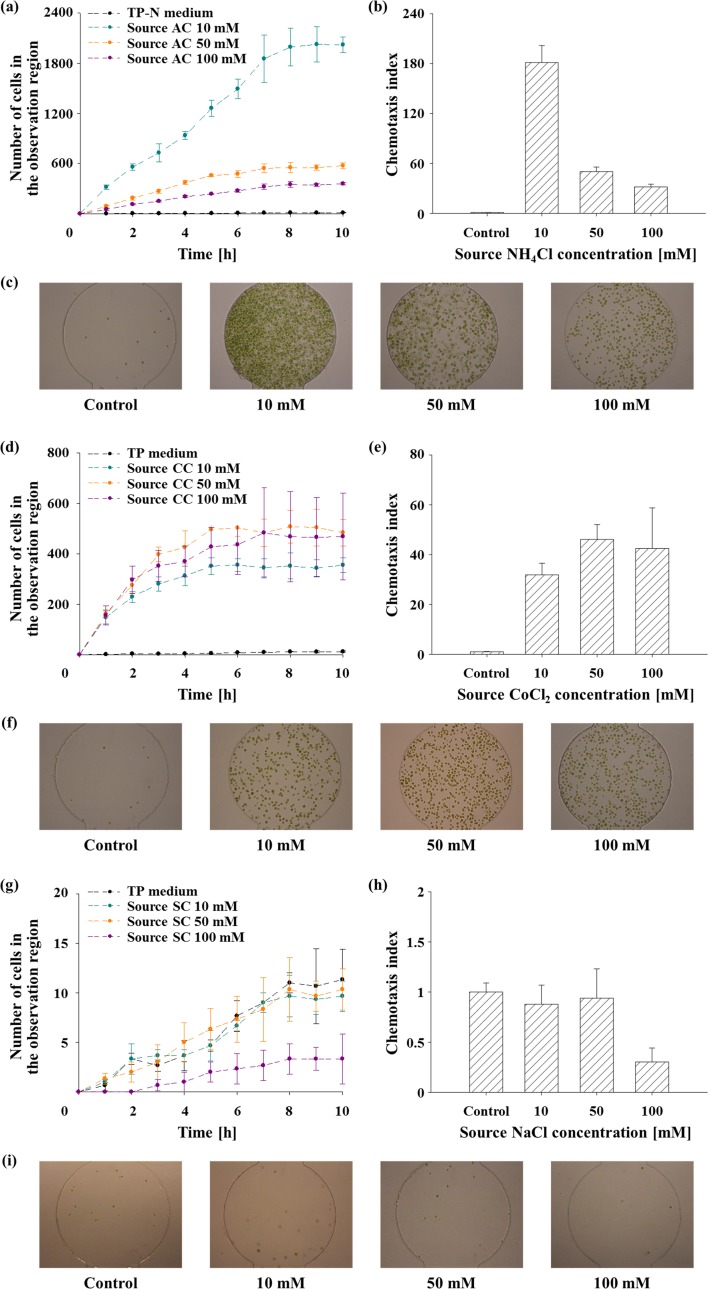
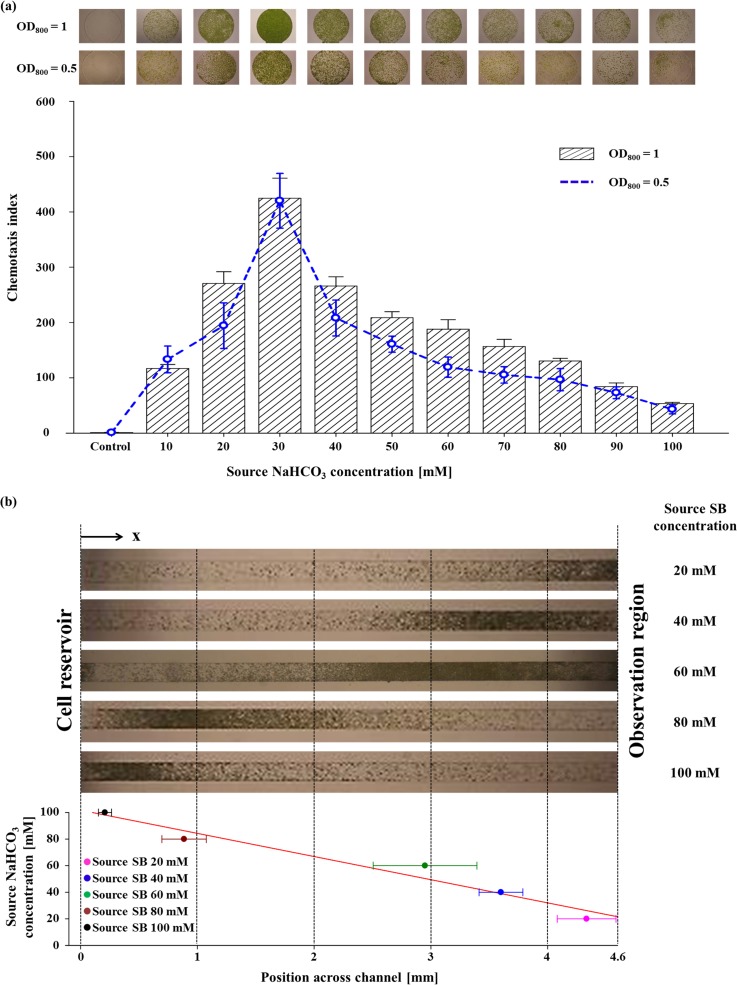
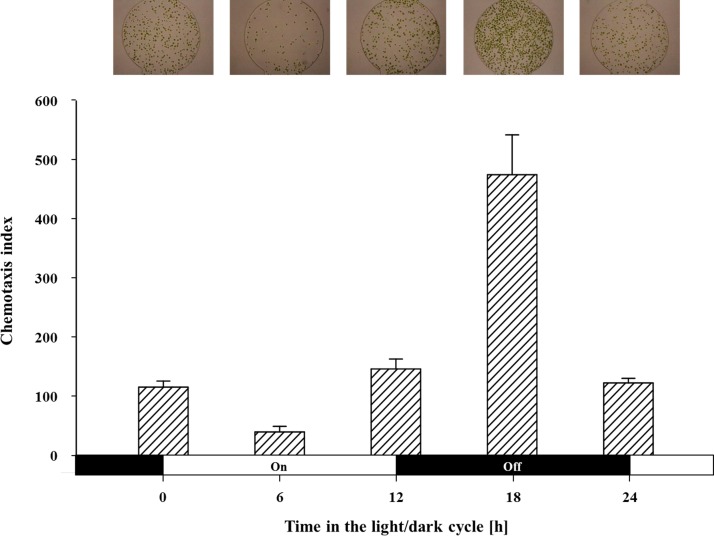
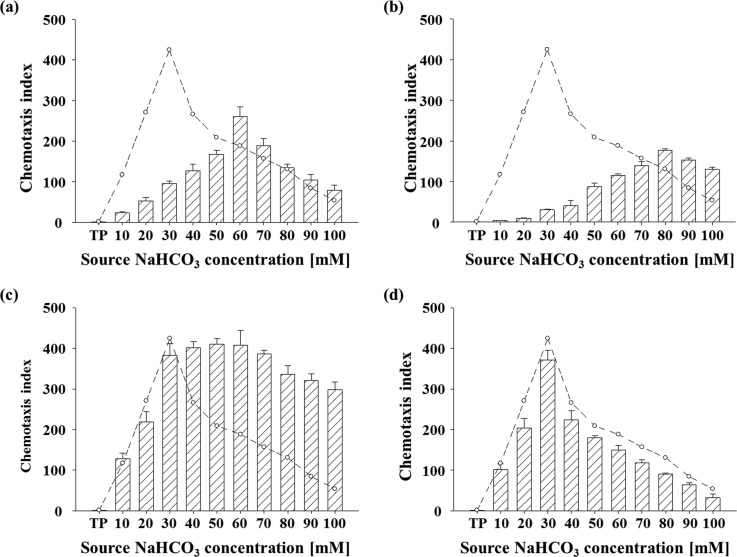
There is a growing interest in the photosynthetic carbon fixation by microalgae for the production of valuable products from carbon dioxide (CO2). Microalgae are capable of transporting bicarbonate (HCO3 (-)), the most abundant form of inorganic carbon species in the water, as a source of CO2 for photosynthesis. Despite the importance of HCO3 (-) as the carbon source, little is known about the chemotactic response of microalgae to HCO3 (-). Here, we showed the chemotaxis of a model alga, Chlamydomonas reinhardtii, towards HCO3 (-) using an agarose gel-based microfluidic device with a flow-free and stable chemical gradient during the entire assay period. The device was validated by analyzing the chemotactic responses of C. reinhardtii to the previously known chemoattractants (NH4Cl and CoCl2) and chemotactically neutral molecule (NaCl). We found that C. reinhardtii exhibited the strongest chemotactic response to bicarbonate at the concentration of 26 mM in a microfluidic device. The chemotactic response to bicarbonate showed a circadian rhythm with a peak during the dark period and a valley during the light period. We also observed the changes in the chemotaxis to bicarbonate by an inhibitor of bicarbonate transporters and a mutation in CIA5, a transcriptional regulator of carbon concentrating mechanism, indicating the relationship between chemotaxis to bicarbonate and inorganic carbon metabolism in C. reinhardtii. To the best of our knowledge, this is the first report of the chemotaxis of C. reinhardtii towards HCO3 (-), which contributes to the understanding of the physiological role of the chemotaxis to bicarbonate and its relevance to inorganic carbon utilization.


Figures

FIG. 1.
FIG. 1.
Schematic diagram of the device for chemotaxis assay. (a) Overall design of the device is presented with the direction of diffusion and cell migration (upper right box: a perspective view of the device mainly focused on the agarose channels and observation region). (b) Image and description of the microdevice with magnified view of cell migration channel, observation region, and agarose gel channels. (c) Flow chart of experimental process. (d) A filling process of agarose gel into microchannels which functions as a semi-permeable membrane allowing free diffusion of small molecules but preventing fluid flow in the microsystem. (e) A medium filling process in the microfluidic device. Due to their hydrophilic and gas-permeable properties of oxygen-treated PDMS microchannel, the channel was filled with a medium while pushing out the trapped air in the channel.
FIG. 2.
FIG. 2.
Fluorescence microscopy images (the top panel) and their concentration gradient profiles (the bottom panel) across the channel at different times. 0.1 mM of fluorescein solution was used for the diffusion tracking. The steady-state diffusion was achieved after 4 h and maintained for the entire assay period (>20 h).
FIG. 3.
FIG. 3.
The validation of agarose gel-based microfluidic device for chemotaxis assay of C. reinhardtii using NH4Cl (ammonium chloride; AC), CoCl2 (cobalt chloride; CC), and NaCl (sodium chloride; SC). All data and error bars are the means and standard deviations of the three biological replicates (n = 3). (a) The number of accumulated C. reinhardtii cells in the observation region in response to NH4Cl gradient according to time. (b) CI measured in the presence of NH4Cl gradient after 8 h of observation. (c) A representative microscopy image showing the cell response towards NH4+ after 8 h at different concentrations. (d) The number of the accumulated cells in the observation region towards CoCl2 according to time. (e) CI measured in the presence of CoCl2 gradient after 8 h. (f) A representative microscopy image showing the cell response towards Co2+ at 8 h at different concentrations. (g) The number of the accumulated cells in the observation region in response to NaCl gradient according to time. (h) CI measured in the presence of NaCl gradient after 8 h. (i) A representative microscopy image showing the cell response towards NaCl at 8 h at different concentrations.
FIG. 4.
FIG. 4.
Chemotactic response of C. reinhardtii towards HCO3. All the experiments were carried out in triplicates (n = 3). Error bars are the standard deviations. (a) The chemotaxis index (CI) of the wild-type cells (OD800 = 1) in response to HCO3 at various source NaHCO3 (sodium bicarbonate; SB) concentrations (from 10 mM to 100 mM at an interval of 10 mM). The blue dashed line indicates the chemotactic response of the wild-type cells at an OD800 of 0.5. The upper images show the representative microscopy images of the accumulated cells at each source concentration. The cell behavior assay in the absence of HCO3 gradient was performed as a control experiment. (b) Cell population band formation in response to the different source NaHCO3 concentrations (from 20 mM to 100 mM at an interval of 20 mM) across the cell migration channel. The top panel shows the representative cell bands formed at different position of the cell migration channel, while the bottom panel shows the center positions of the cell bands. The red line indicates the linear regression of the center position. The linearity of the center positions (r2 = 0.956) indicates the existence of the most preferred HCO3 concentration in the chemotaxis of C. reinhardtii.
FIG. 5.
FIG. 5.
The chemotaxis index of the cells synchronized to Light (on): Dark (off) (12 h:12 h) cycle. The chemotactic response was assayed for 1 h using the cells sampled every 6 h. Chemotaxis to HCO3 showed the maximum level at the middle of the dark period (18 h) and the minimum level during the day phase (6 h). The upper images show the representative images of the attracted cells at each sampling time. Data are the mean (bar graph) and standard deviation (error bars) of three biological replicates (n = 3).
FIG. 6.
FIG. 6.
The distribution of CI in response to several factors related to CCM according to different NaHCO3 concentrations. Data and error bars are the means and standard deviations of triplicate experiments (n = 3). Dashed line indicates the chemotactic response of the wild-type cells (OD800 1) acclimated to the CO2 (ambient) condition. CI distributions of (a) the wild-type cells acclimated to 5% CO2-enriched air. (b) CC-2702 (cia5), a CCM-deficient mutant. (c) The wild-type cells treated with DIDS, inhibitor of putative HCO3/Cl transporter. (d) The wild-type cells treated with AZ, inhibitor of external carbonic anhydrase. TP: TP medium used as a negative control.

References

    1. Hu Q., Sommerfeld M., Jarvis E., Ghirardi M., Posewitz M., Seibert M., and Darzins A., Plant J. 54, 621 (2008).10.1111/j.1365-313X.2008.03492.x - DOI - PubMed
    1. Lim H. S., Kim J. Y. H., Kwak H. S., and Sim S. J., Anal. Chem. 86, 8585 (2014).10.1021/ac502324c - DOI - PubMed
    1. Borowitzka M. A., J. Appl. Phycol. 25, 743 (2013).10.1007/s10811-013-9983-9 - DOI
    1. Kim J. Y. H., Kwak H. S., Sung Y. J., Choi H. I., Hong M. E., Lim H. S., Lee J., Lee S. Y., and Sim S. J., Sci. Rep. 6, 21155 (2016).10.1038/srep21155 - DOI - PMC - PubMed
    1. Barra L., Chandrasekaran R., Corato F., and Brunet C., Mar. Drugs 12, 1641 (2014).10.3390/md12031641 - DOI - PMC - PubMed

LinkOut - more resources