

Glucosamine Hydrochloride but Not Chondroitin Sulfate Prevents Cartilage Degradation and Inflammation Induced by Interleukin-1α in Bovine Cartilage Explants
- PMID: 26958319
- PMCID: PMC4749751
- DOI: 10.1177/1947603515603762
Glucosamine Hydrochloride but Not Chondroitin Sulfate Prevents Cartilage Degradation and Inflammation Induced by Interleukin-1α in Bovine Cartilage Explants
Abstract
Objective: Glucosamine hydrochloride (GH) and chondroitin sulfate (CS) are commonly used for the treatment of osteoarthritis (OA). The aim of this study was to assess their effects, alone and in combination, on preventing aggrecan degradation and inflammation in an in vitro model of OA.
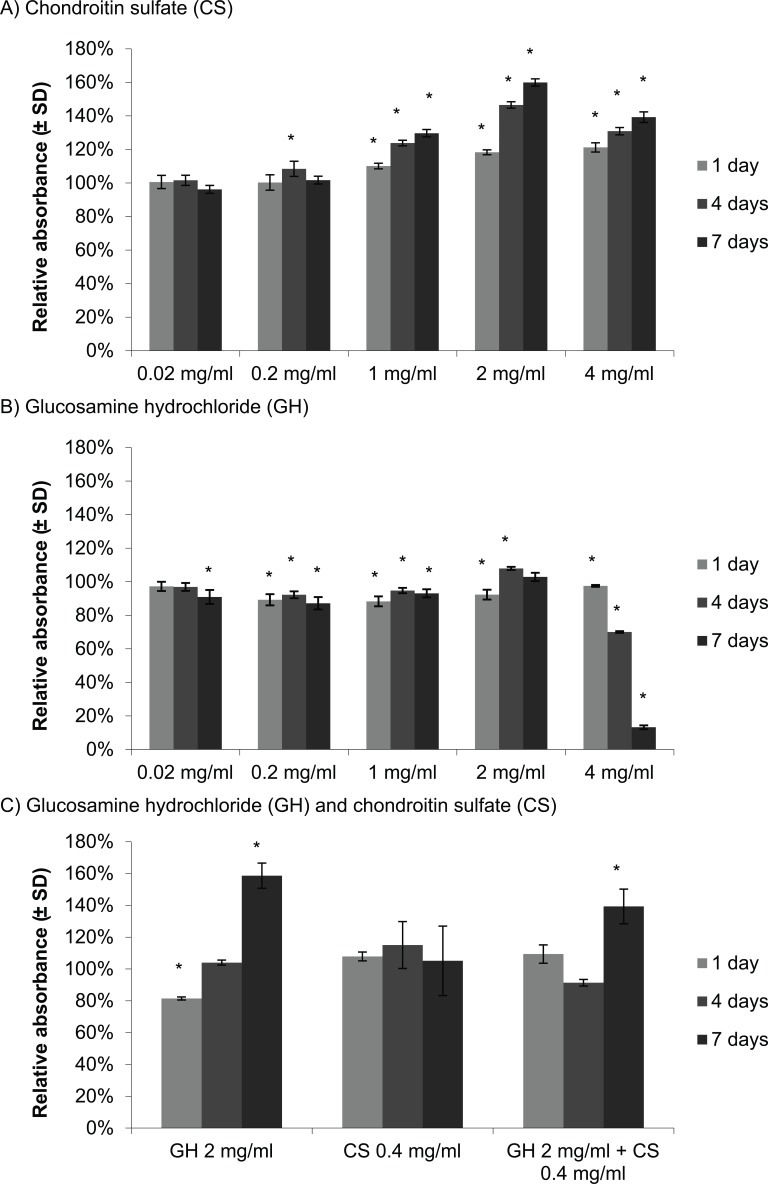
Design: To test the effects of GH and/or CS as a preventative treatment, cartilage explants were pretreated with the compound(s) using concentrations that showed no detrimental effect on chondrocyte viability. Interleukin-1α (IL-1α) was added to induce cartilage degradation, supernatant and explants were analyzed for proteoglycan degradation products, aggrecanase mRNA expression and activity, and for the release of inflammatory markers.
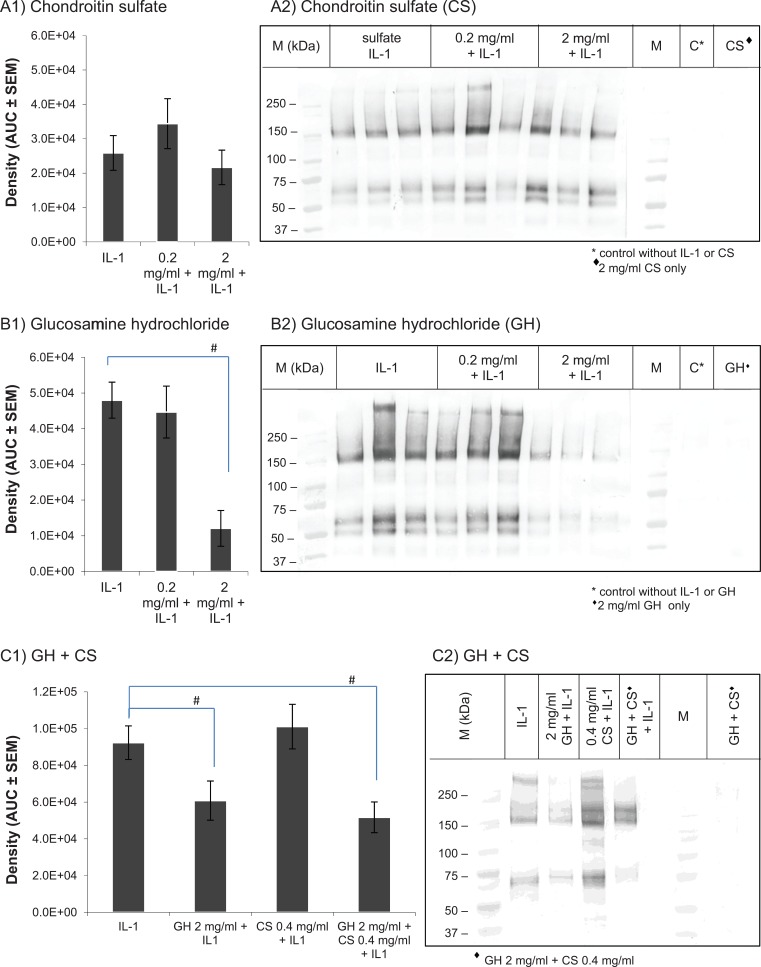
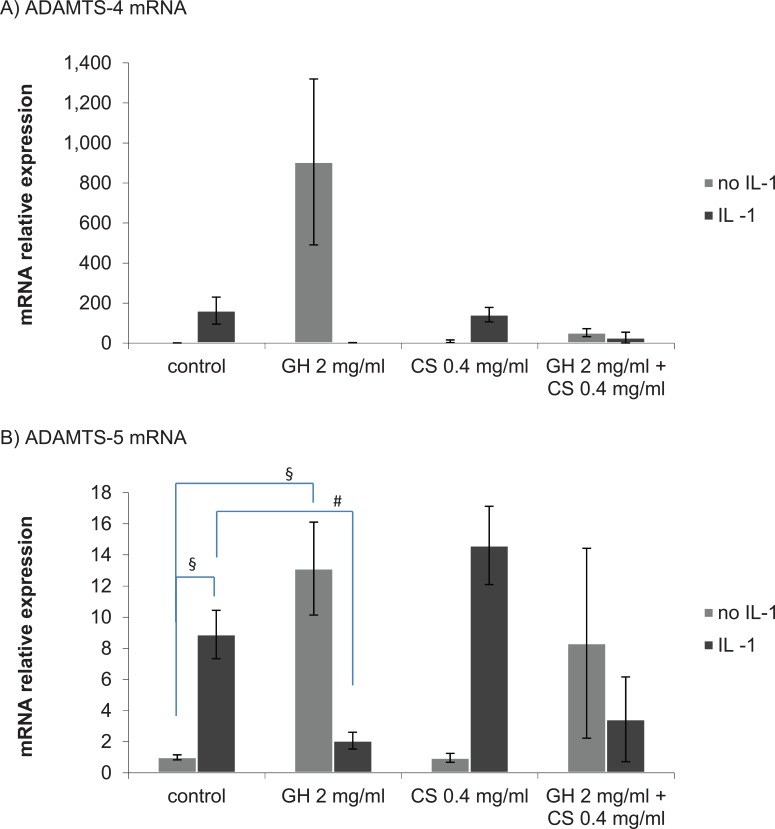
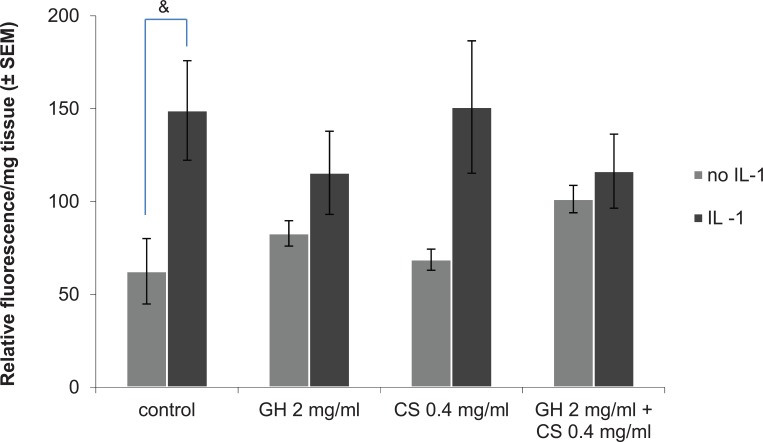
Results: Following treatment with IL-1α, 2 mg/mL dose of GH pretreatment was associated with a reduction of glycosaminoglycan release, reduced generation of the pathological interglobular domain aggrecan catabolites, decreased mRNA levels of ADAMTS-4 and -5 and reduced activity of ADAMTS-4. In contrast, CS alone did not have a significant effect on IL-1α-induced cartilage degradation and the addition of 0.4 mg/mL CS to 2 mg/mL GH did not further inhibit IL-1α-induced activity. Pretreatment with 2 mg/mL GH also reduced the release of inflammatory markers, prostaglandin E2 and nitric oxide induced by IL-1α while CS did not have a significant effect.
Conclusions: The results suggest that GH prevents cartilage degradation mediated by aggrecanases ADAMTS-4 and -5, and may also reduce inflammation. This could be part of the mechanisms by which GH is effective in maintaining joint integrity and function, and preventing or delaying early symptoms of OA.
Keywords: aggrecanase; chondroitin; glucosamine; osteoarthritis.
Conflict of interest statement
Figures


Similar articles
-
Effects of glucosamine and chondroitin sulfate on bovine cartilage explants under long-term culture conditions.Am J Vet Res. 2007 Jul;68(7):709-15. doi: 10.2460/ajvr.68.7.709. Am J Vet Res. 2007. PMID: 17605605
-
Mannosamine inhibits aggrecanase-mediated changes in the physical properties and biochemical composition of articular cartilage.Arch Biochem Biophys. 2000 Feb 1;374(1):79-85. doi: 10.1006/abbi.1999.1538. Arch Biochem Biophys. 2000. PMID: 10640399
-
Short-term gene expression changes in cartilage explants stimulated with interleukin beta plus glucosamine and chondroitin sulfate.J Rheumatol. 2006 Jul;33(7):1329-40. J Rheumatol. 2006. PMID: 16821268
-
Effects of glucosamine hydrochloride and chondroitin sulphate, alone and in combination, on normal and interleukin-1 conditioned equine articular cartilage explant metabolism.Equine Vet J. 2005 May;37(3):227-31. doi: 10.2746/0425164054530687. Equine Vet J. 2005. PMID: 15892231
-
Glucosamine and chondroitin sulfate regulate gene expression and synthesis of nitric oxide and prostaglandin E(2) in articular cartilage explants.Osteoarthritis Cartilage. 2005 May;13(5):387-94. doi: 10.1016/j.joca.2005.01.003. Osteoarthritis Cartilage. 2005. PMID: 15882562
Cited by
-
Agaricus bisporus-Derived Glucosamine Hydrochloride Regulates VEGF through BMP Signaling to Promote Zebrafish Vascular Development and Impairment Repair.Life (Basel). 2023 Dec 12;13(12):2330. doi: 10.3390/life13122330. Life (Basel). 2023. PMID: 38137931 Free PMC article.
-
Olive and grape seed extract prevents post-traumatic osteoarthritis damages and exhibits in vitro anti IL-1β activities before and after oral consumption.Sci Rep. 2016 Sep 19;6:33527. doi: 10.1038/srep33527. Sci Rep. 2016. PMID: 27640363 Free PMC article.
-
Reduction of osteoarthritis severity in the temporomandibular joint of rabbits treated with chondroitin sulfate and glucosamine.PLoS One. 2020 Apr 15;15(4):e0231734. doi: 10.1371/journal.pone.0231734. eCollection 2020. PLoS One. 2020. PMID: 32294140 Free PMC article.
-
Habitual glucosamine use, APOE genotypes, and risk of incident cause-specific dementia in the older population.Alzheimers Res Ther. 2023 Sep 9;15(1):152. doi: 10.1186/s13195-023-01295-6. Alzheimers Res Ther. 2023. PMID: 37689747 Free PMC article.
-
Diacerein plus glucosamine hydrochloride improves the safety and efficacy and inhibit inflammatory factors in the treatment of knee osteoarthritis.Am J Transl Res. 2023 Jan 15;15(1):548-555. eCollection 2023. Am J Transl Res. 2023. PMID: 36777840 Free PMC article.
References
-
- Arthritis Research UK. Data and statistics. 2015. http://www.arthritisresearchuk.org/arthritis-information/data-and-statis....
-
- Arthritis Foundation. Osteoarthritis. 2015. http://www.arthritis.org/conditions-treatments/disease-center/osteoarthr....
-
- Hardingham T. Extracellular matrix and pathogenic mechanisms in osteoarthritis. Curr Rheumatol Rep. 2008;10:30-6. - PubMed
LinkOut - more resources
Full Text Sources
Other Literature Sources
