. 2016 Feb 12:11:224-238.
doi: 10.1016/j.nicl.2016.02.003. eCollection 2016.

Correlation between amygdala BOLD activity and frontal EEG asymmetry during real-time fMRI neurofeedback training in patients with depression

Affiliations

Correlation between amygdala BOLD activity and frontal EEG asymmetry during real-time fMRI neurofeedback training in patients with depression

Vadim Zotev et al. Neuroimage Clin. .

Abstract

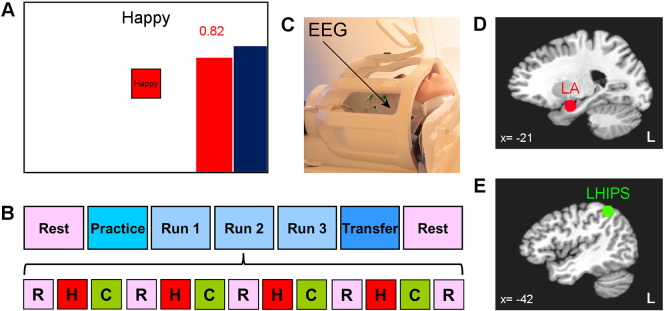
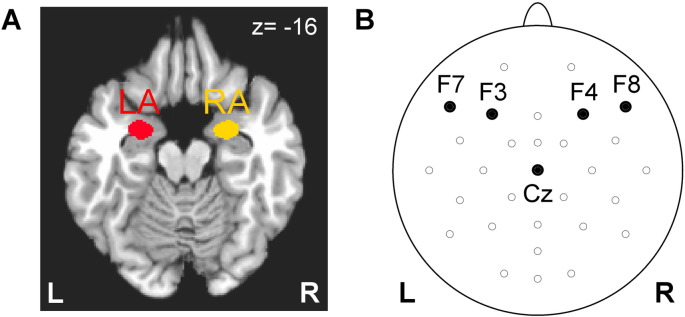
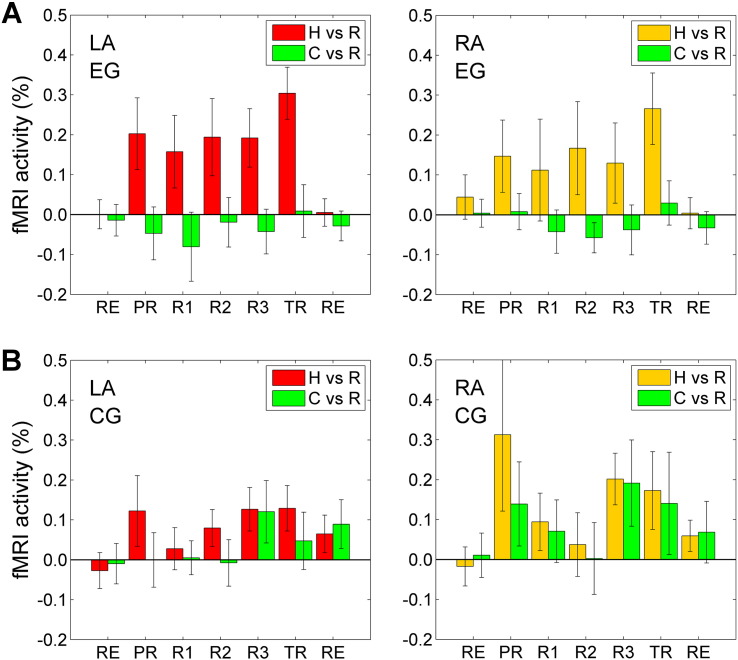
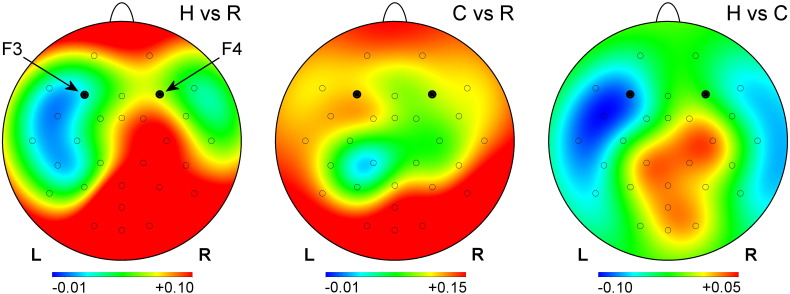
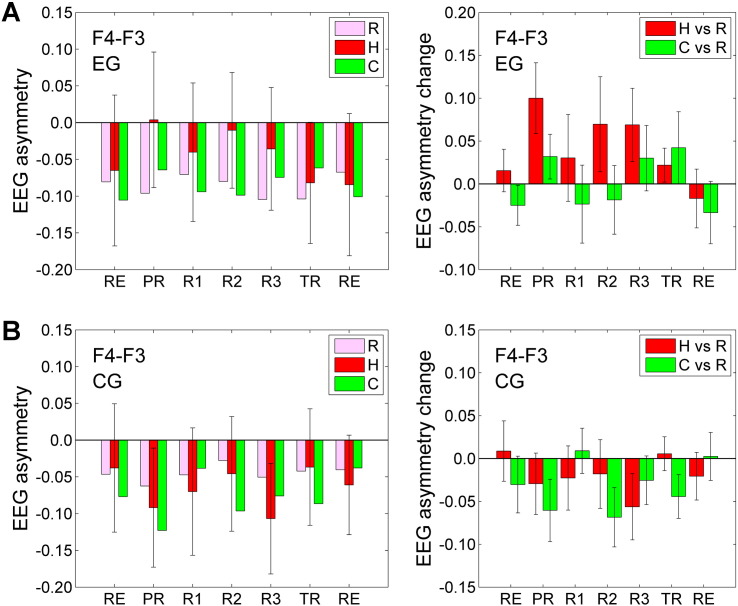
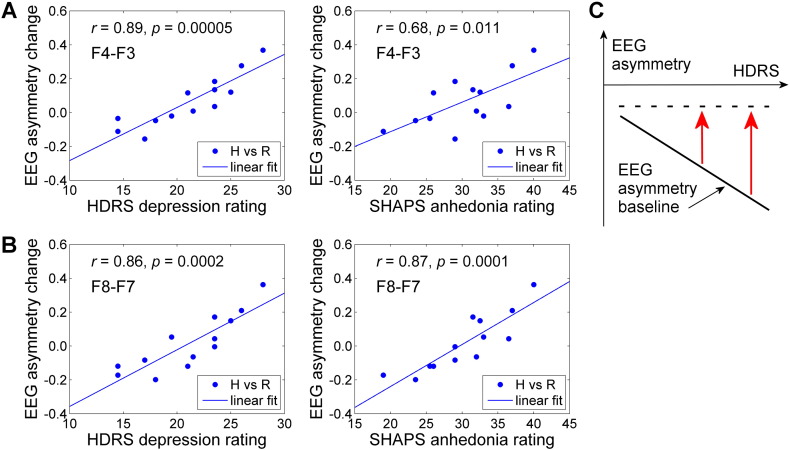
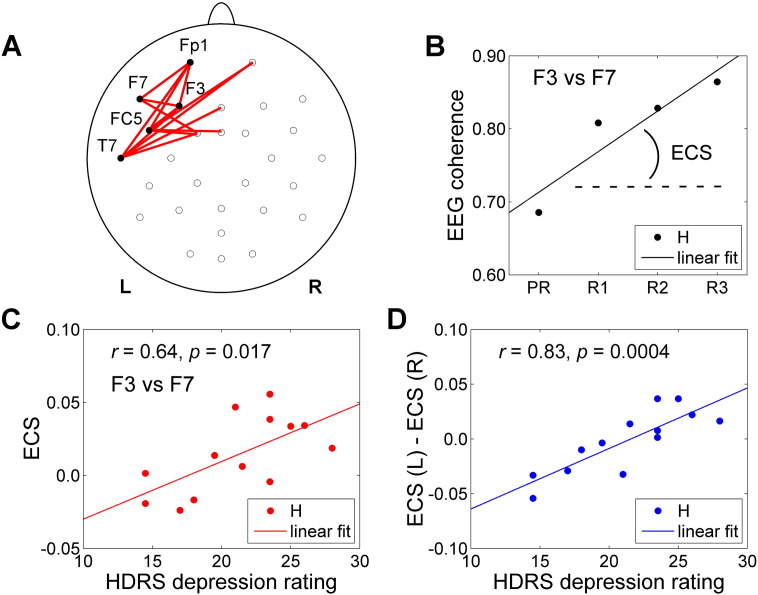
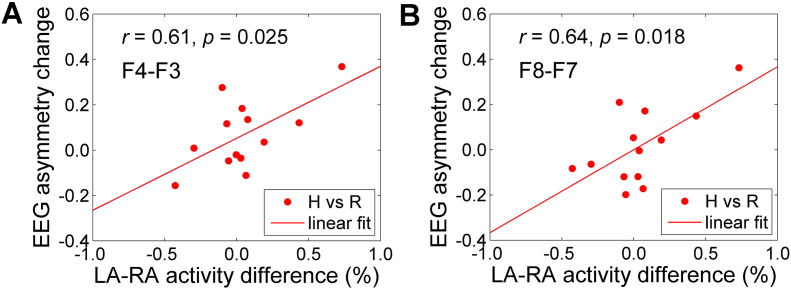
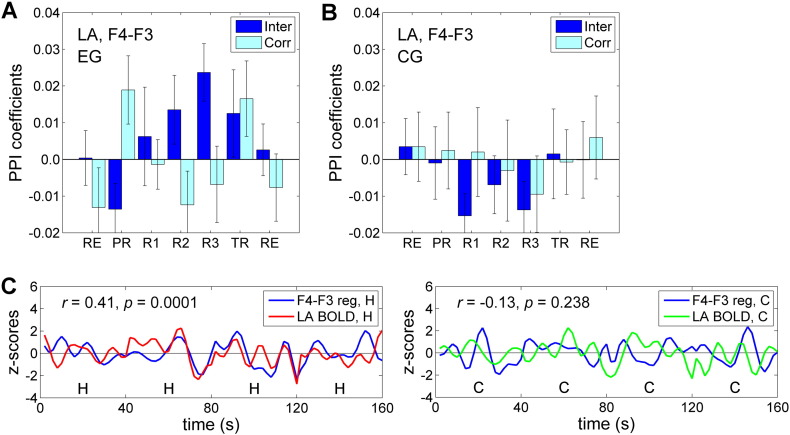
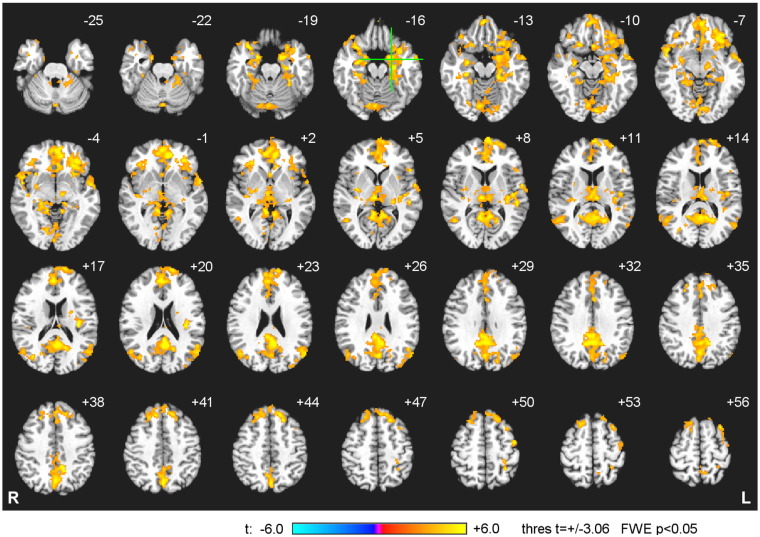
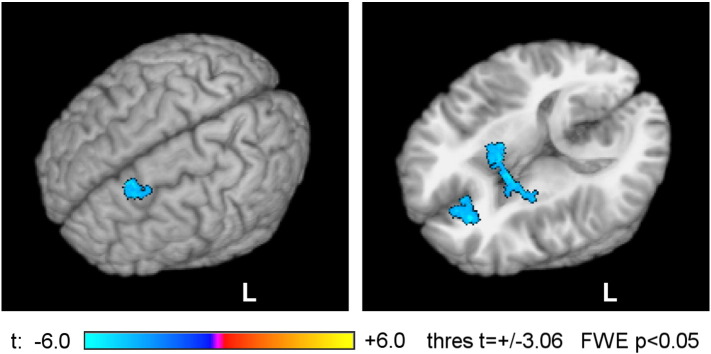
Real-time fMRI neurofeedback (rtfMRI-nf) is an emerging approach for studies and novel treatments of major depressive disorder (MDD). EEG performed simultaneously with an rtfMRI-nf procedure allows an independent evaluation of rtfMRI-nf brain modulation effects. Frontal EEG asymmetry in the alpha band is a widely used measure of emotion and motivation that shows profound changes in depression. However, it has never been directly related to simultaneously acquired fMRI data. We report the first study investigating electrophysiological correlates of the rtfMRI-nf procedure, by combining the rtfMRI-nf with simultaneous and passive EEG recordings. In this pilot study, MDD patients in the experimental group (n = 13) learned to upregulate BOLD activity of the left amygdala using an rtfMRI-nf during a happy emotion induction task. MDD patients in the control group (n = 11) were provided with a sham rtfMRI-nf. Correlations between frontal EEG asymmetry in the upper alpha band and BOLD activity across the brain were examined. Average individual changes in frontal EEG asymmetry during the rtfMRI-nf task for the experimental group showed a significant positive correlation with the MDD patients' depression severity ratings, consistent with an inverse correlation between the depression severity and frontal EEG asymmetry at rest. The average asymmetry changes also significantly correlated with the amygdala BOLD laterality. Temporal correlations between frontal EEG asymmetry and BOLD activity were significantly enhanced, during the rtfMRI-nf task, for the amygdala and many regions associated with emotion regulation. Our findings demonstrate an important link between amygdala BOLD activity and frontal EEG asymmetry during emotion regulation. Our EEG asymmetry results indicate that the rtfMRI-nf training targeting the amygdala is beneficial to MDD patients. They further suggest that EEG-nf based on frontal EEG asymmetry in the alpha band would be compatible with the amygdala-based rtfMRI-nf. Combination of the two could enhance emotion regulation training and benefit MDD patients.

Keywords: Amygdala; Approach; Avoidance; Depression; EEG–fMRI; Emotion; Frontal EEG asymmetry; Motivation; Neurofeedback; Real-time fMRI.


Figures

Fig. 1
Fig. 1
Experimental paradigm for real-time fMRI neurofeedback training of emotional self-regulation with simultaneous EEG. A) Real-time display screen for Happy Memories conditions with real-time fMRI neurofeedback (rtfMRI-nf). The variable-height rtfMRI-nf bar is red, and the target level bar is blue. B) Protocol for the rtfMRI-nf experiment included seven runs, each lasting 8 min 46 s: Rest (RE), Practice (PR), Run 1 (R1), Run 2 (R2), Run 3 (R3), Transfer (TR), and Rest (RE). The experimental runs (except the Rest) consisted of 40-s long blocks of Happy Memories (H), Count (C), and Rest (R) conditions. C) An MR-compatible 32-channel EEG system was used to perform EEG recordings simultaneously with fMRI data acquisition. D) Target region of interest (ROI) in the left amygdala (LA) region for the experimental group (EG). E) Target ROI in the left horizontal segment of the intraparietal sulcus (LHIPS) region for the control group (CG). (For interpretation of the references to color in this figure legend, the reader is referred to the web version of this article.)
Fig. 2
Fig. 2
Regions of interest and EEG channels used in offline analysis of amygdala BOLD activity and frontal EEG asymmetry. A) Left amygdala (LA) and right amygdala (RA) ROIs were defined anatomically according to the co-planar stereotaxic atlas of the human brain by Talairach and Tournoux. The ROIs are projected in the figure onto the standard TT_N27 template in the Talairach space. The left hemisphere (L) is to the reader's left. B) Pairs of frontal EEG channels used to quantify frontal EEG asymmetry: F3 (left) and F4 (right), F7 (left) and F8 (right). Cz channel was used as a reference.
Fig. 3
Fig. 3
BOLD activity levels for the amygdala during the rtfMRI-nf experiment. A) Average fMRI percent signal changes for the left amygdala (LA, left) and the right amygdala (RA, right) for the experimental group (EG). Each bar represents a mean GLM-based fMRI percent signal change for the corresponding ROI (Fig. 2A) with respect to the Rest baseline for the Happy Memories (H vs R) or Count (C vs R) conditions in a given run, averaged across the group. The error bars are standard errors of the means (sem). The experimental runs and condition blocks are depicted schematically in Fig. 1B. For the Rest runs (RE), the analyses were formally performed in the same way as for the five task runs to evaluate internal consistency of the results. B) Corresponding average fMRI percent signal changes for the control group (CG).
Fig. 4
Fig. 4
Variations in upper alpha EEG power across three experimental conditions during the rtfMRI-nf training. The maps show differences in average normalized upper alpha EEG power values for the Happy Memories and Rest (H vs R), Count and Rest (C vs R), and Happy Memories and Count (H vs C) conditions for the experimental group (EG). The results are also averaged across three rtfMRI-nf training runs (Run 1, Run 2, Run 3). The (unitless) normalized power was computed as ln(P), where P is EEG signal power for a given channel with Cz reference. The upper alpha EEG band was defined individually for each participant (see text for details).
Fig. 5
Fig. 5
Average values of frontal EEG asymmetry and their changes during the rtfMRI-nf experiment. A) Average frontal EEG asymmetry (FEA) values (left) and changes (right) for channels F3 and F4 (Fig. 2B) for the experimental group (EG). Bars in the left plot represent FEA values averaged, respectively, for the Rest (R), Happy Memories (H), and Count (C) conditions in a given run and across the group. Bars in the right plot represent average FEA changes for the Happy Memories and Count conditions relative to the Rest conditions (H vs R and C vs R). The error bars are standard errors of the means (sem). The notation ‘F4 − F3’ in this and other figures refers to the FEA computed as ln(P(F4)) − ln(P(F3)), where P is EEG signal power for a given channel in an individually defined upper alpha EEG band. The experimental runs and condition blocks are illustrated in Fig. 1B above. For the Rest runs (RE), the analyses were formally performed in the same way as for the five task runs to evaluate internal consistency of the results. B) Corresponding average FEA values and changes for the control group (CG).
Fig. 6
Fig. 6
Correlations between frontal EEG asymmetry changes during the rtfMRI-nf training and individual psychological measures. The results are for the experimental group (EG), with each data point corresponding to one participant. Mean frontal EEG asymmetry (FEA) changes for the Happy Memories conditions with respect to the Rest conditions (H vs R) further averaged across four rtfMRI-nf runs (Practice, Run 1, Run 2, Run 3) were used in the analysis for each subject. A) Correlation results for the FEA changes for channels F3 and F4 (‘F4 − F3’). B) Correlation results for the FEA changes for channels F7 and F8 (‘F8 − F7’). C) Interpretation of the experimental results. The baseline FEA values (Rest condition blocks) are more negative (solid line) in patients with higher depression severity (HDRS). The rtfMRI-nf FEA values (Happy Memories conditions) appear independent (dashed line) of the depression severity. Thus, the FEA changes (red arrows) are more positive in patients with more severe depression. Abbreviations: HDRS — Hamilton Depression Rating Scale, SHAPS — Snaith–Hamilton Pleasure Scale. (For interpretation of the references to color in this figure legend, the reader is referred to the web version of this article.)
Fig. 7
Fig. 7
Correlations between enhancement in EEG coherence in the upper alpha EEG band during the rtfMRI-nf training and depression severity. A) Pairs of EEG channels that showed correlations (p < 0.05, uncorr.) between the EEG coherence slope (ECS) and HDRS depression severity for the experimental group (EG). B) Definition of the EEG coherence slope (ECS) across Happy Memories conditions in four rtfMRI-nf runs (Practice, Run 1, Run 2, Run 3) for a given pair of EEG channels for a given subject. C) Example of correlation between the ECS values (for F3 vs F7) and HDRS depression severity ratings for the participants in the EG. Each data point corresponds to one participant. Pairs of EEG channels exhibiting such correlations are denoted by red segments in A). D) Correlation between the average ECS laterality and HDRS depression severity ratings. ECS(L) is a mean ECS for fronto-temporal EEG channels on the left (Fp1, F3, F7, FC5, T7, ten pairs). ECS(R) is a mean ECS for the corresponding fronto-temporal EEG channels on the right (Fp2, F4, F8, FC6, T8, ten pairs). HDRS — Hamilton Depression Rating Scale. (For interpretation of the references to color in this figure legend, the reader is referred to the web version of this article.)
Fig. 8
Fig. 8
Correlations between changes in frontal EEG asymmetry and amygdala BOLD laterality during the rtfMRI-nf training. The results are for the experimental group (EG), with each data point corresponding to one participant. Mean individual frontal EEG asymmetry (FEA) changes and BOLD activity differences between the LA and RA (‘LA − RA’) for the Happy Memories conditions with respect to the Rest conditions (H vs R) were averaged across four rtfMRI-nf runs (Practice, Run 1, Run 2, Run 3). A) FEA changes for channels F3 and F4 (denoted as ‘F4 − F3’). B) FEA changes for channels F7 and F8 (denoted as ‘F8 − F7’).
Fig. 9
Fig. 9
Temporal correlation between frontal EEG asymmetry and BOLD activity of the left amygdala during the rtfMRI-nf training. A) Average values of the psychophysiological interaction (PPI) analysis coefficients — interaction (‘Inter’) and correlation (‘Corr’) — for the left amygdala (LA) ROI (Fig. 2A) for the experimental group (EG). Frontal EEG asymmetry (FEA) for channels F3 and F4 (denoted as ‘F4 − F3’) was used in the PPI analysis. The voxel-wise [FEA-based regressor] × [Happy − Count] interaction and correlation values were averaged within the LA ROI and across the group. The error bars are standard errors of the means (sem). The positive PPI interaction indicates a stronger temporal correlation between the FEA and the LA BOLD activity during the Happy Memories condition. B) Corresponding PPI results for the control group (CG). C) Illustration of the PPI effects for the EG using single-subject data. The left plot shows positive correlation between the FEA-based regressor and the LA time course during four Happy Memories (H) condition blocks in one run (Fig. 1B) concatenated together in the figure. The right plot shows lack of correlation between these time courses during four concatenated Count (C) condition blocks in the same run.
Fig. 10
Fig. 10
Enhancement in temporal correlation between frontal EEG asymmetry and BOLD activity of various brain regions during the rtfMRI-nf training. Group statistical maps of the psychophysiological interaction (PPI) effect [FEA-based regressor] × [Happy − Count] are shown for the experimental group (EG). Frontal EEG asymmetry (FEA) for channels F3 and F4 was used in the PPI analysis. The maps are projected onto the standard anatomical template TT_N27 in the Talairach space, with 3 mm separation between axial slices. The number adjacent to each slice indicates the z coordinate in mm. The left hemisphere (L) is to the reader's right. The green crosshairs mark the center of the left amygdala target ROI (Fig. 1D). Peak t-statistics values for the PPI interaction effect and the corresponding locations are specified in Table 2. (For interpretation of the references to color in this figure legend, the reader is referred to the web version of this article.)
Fig. 11
Fig. 11
Enhancement in inverse temporal correlation between left frontal upper alpha EEG power and BOLD activity during the rtfMRI-nf training. 3D renderings of group statistical maps of the psychophysiological interaction (PPI) effect [EEG-power-based regressor] × [Happy − Count] are shown for the experimental group (EG). An average of normalized upper alpha EEG powers for channels F3, F7, and FC5 located over the left prefrontal cortex was used in the PPI analysis. The maps are projected onto the standard 3D anatomical template TT_N27 in the Talairach space. Three clusters, obtained after FWE correction, are shown as follows. Left: a cluster in the left DM/DLPFC region. Right: a cluster in the left rACC region and a cluster including areas of the right globus pallidus and the bilateral amygdala (show-through ‘glass brain’ rendering). Peak t-statistics values for the PPI interaction effect and the corresponding locations are specified in Table 3.

Similar articles

Cited by

References

    1. Aftanas L.I., Golocheikine S.A. Human anterior and frontal midline theta and lower alpha reflect emotionally positive state and internalized attention: high-resolution EEG investigation of meditation. Neurosci. Lett. 2001;310:57–60. - PubMed
    1. Allen J.J.B., Harmon-Jones E., Cavender J.H. Manipulation of frontal EEG asymmetry through biofeedback alters self-reported emotional responses and facial EMG. Psychophysiol. 2001;38:685–693. - PubMed
    1. American Psychiatric Association . DSM-IV-TR. fourth ed. American Psychiatric Press; Washington, DC: 2000. Diagnostic and Statistical Manual of Mental Disorders. text rev.
    1. Baehr E., Rosenfeld J.P., Baehr R. The clinical use of an alpha asymmetry protocol in the neurofeedback treatment of depression: two case studies. J. Neurotherapy. 1997;2:10–23.
    1. Bagby R.M., Parker J.D.A., Taylor G.J. The twenty-item Toronto Alexithymia Scale — I. Item selection and cross-validation of the factor structure. J. Psychosom. Res. 1994;38:33–40. - PubMed

Publication types

MeSH terms