. 2016 Mar 24;531(7595):496-9.
doi: 10.1038/nature17160. Epub 2016 Mar 9.

Intrinsic honesty and the prevalence of rule violations across societies

Affiliations

Intrinsic honesty and the prevalence of rule violations across societies

Simon Gächter et al. Nature. .

Abstract

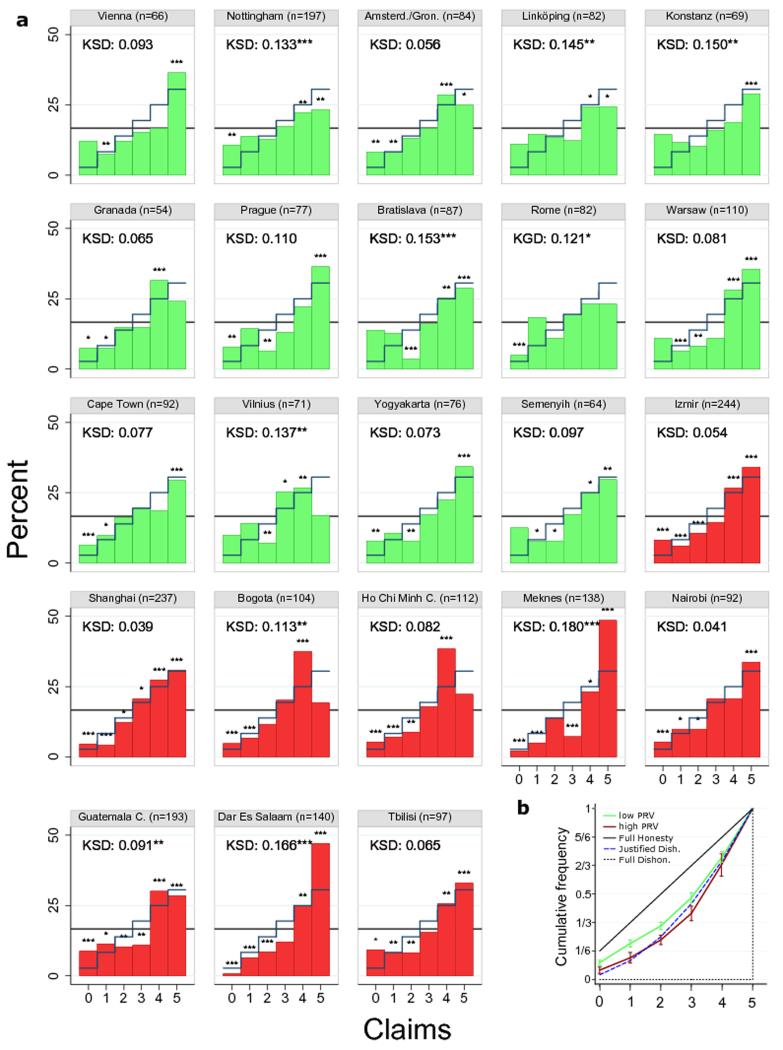
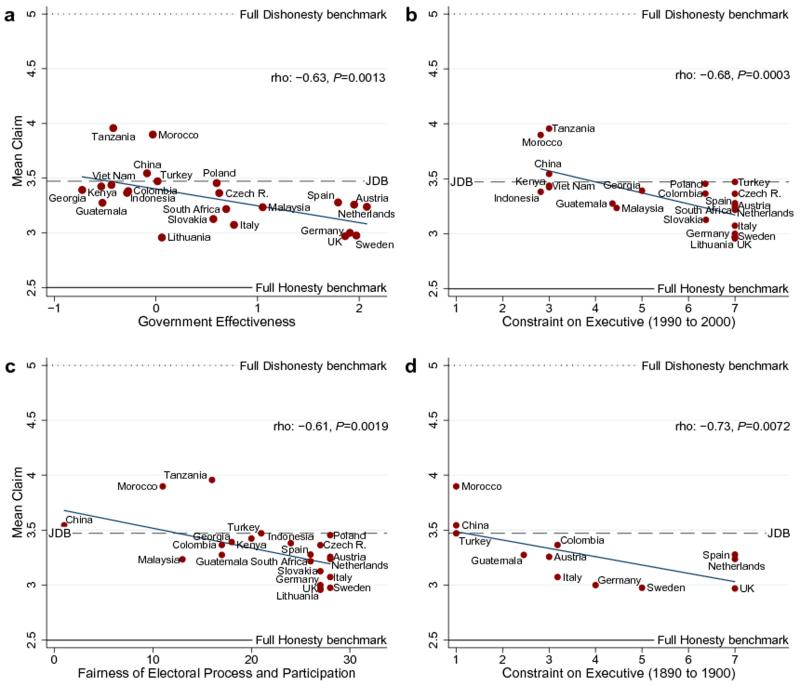
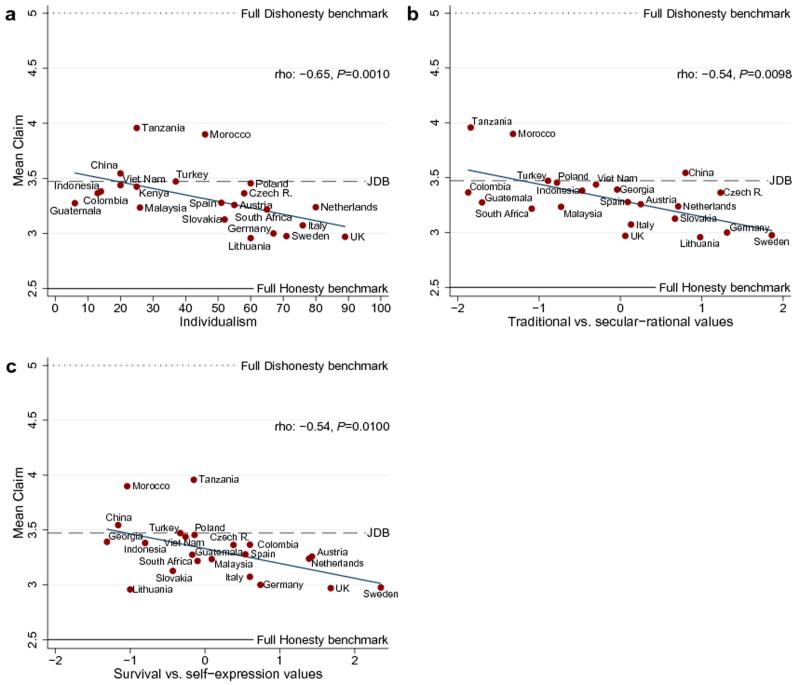
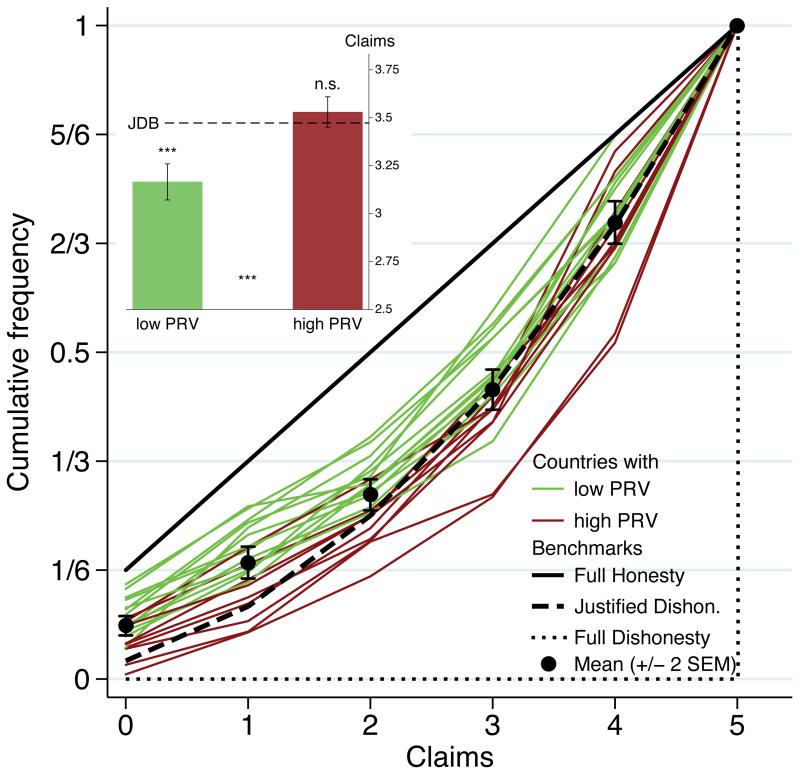
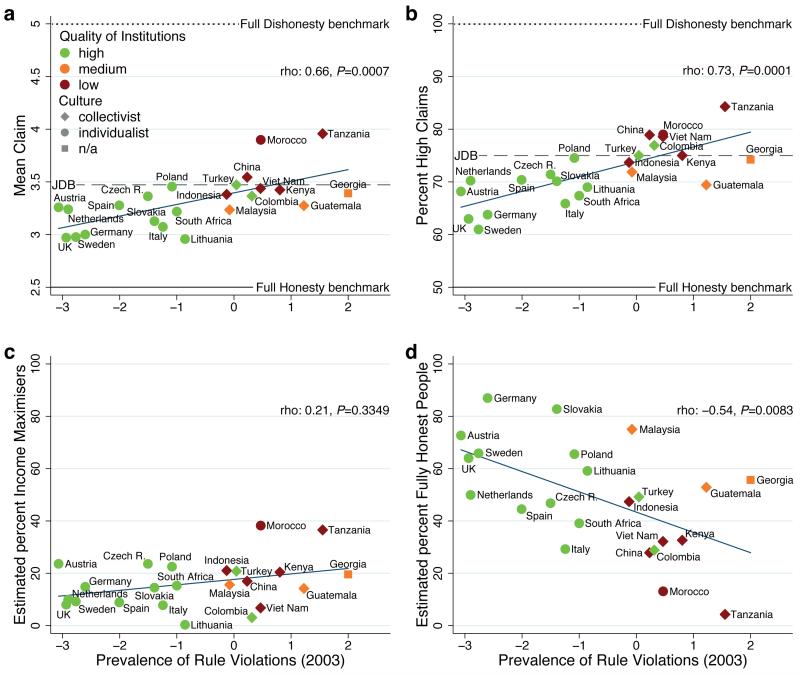
Deception is common in nature and humans are no exception. Modern societies have created institutions to control cheating, but many situations remain where only intrinsic honesty keeps people from cheating and violating rules. Psychological, sociological and economic theories suggest causal pathways to explain how the prevalence of rule violations in people's social environment, such as corruption, tax evasion or political fraud, can compromise individual intrinsic honesty. Here we present cross-societal experiments from 23 countries around the world that demonstrate a robust link between the prevalence of rule violations and intrinsic honesty. We developed an index of the 'prevalence of rule violations' (PRV) based on country-level data from the year 2003 of corruption, tax evasion and fraudulent politics. We measured intrinsic honesty in an anonymous die-rolling experiment. We conducted the experiments with 2,568 young participants (students) who, due to their young age in 2003, could not have influenced PRV in 2003. We find individual intrinsic honesty is stronger in the subject pools of low PRV countries than those of high PRV countries. The details of lying patterns support psychological theories of honesty. The results are consistent with theories of the cultural co-evolution of institutions and values, and show that weak institutions and cultural legacies that generate rule violations not only have direct adverse economic consequences, but might also impair individual intrinsic honesty that is crucial for the smooth functioning of society.


Figures

Extended Data Figure 1
Extended Data Figure 1. The die-in-a-cup task (due to Fischbacher and Föllmi-Heusi)
Participants (n = 2568 from 23 countries) are asked to roll the die twice in the cup and to report the first roll. Payment is according to reported roll, except reporting 6 earns 0 money units (MU; across subject pools MU in local currency are adjusted to equalise purchasing power). We used the same set of dice in all subject pools, and we also tested the dice for biasedness. The procedures followed established rules in cross-cultural experimental economics. See Supplementary Information for further details. This picture was taken by J.S. in the experimental laboratory of the University of Nottingham.
Extended Data Figure 2
Extended Data Figure 2. Distribution of claims
a. Distribution per subject pool. Subject pools are ordered by country PRV. The first 14 subject pools (in green) are from “low” (below-average) PRV countries; the last 9 subject pools (in red) are from “high” (above-average) PRV countries relative to the world sample of 159 countries. The horizontal black line refers to the uniform distribution implied by honest reporting and the blue step function to the distribution implied by the Justified Dishonesty benchmark (JDB). For each subject pool we report the one-sample Kolmogorov-Smirnov test (KS) for discrete data in comparison with JDB (KSD is the KS d value). Stars above bars refer to binomial tests comparing the frequency of a particular claim with its predicted value under a uniform distribution. b. Cumulative distributions for pooled data from subject pools from low and high PRV countries, respectively. See Supplementary Analysis for further information. * P < 0.1, ** P < 0.05, *** P < 0.01.
Extended Data Figure 3
Extended Data Figure 3. Association between indicators of institutional quality and intrinsic honesty as measured by Mean Claim
The blue line is a linear fit. The line marked ‘JDB’ indicates the ‘Justified Dishonesty benchmark’. rho indicates Spearman rank order correlation coefficients. Mean Claim is negatively related to a. Government Effectiveness; b. Constraint on Executive; c. ‘Fairness of Electoral Process and Participation’; d. Constraint on Executive using the averages of the years 1890 to 1900 as a measure for distant institutional quality. See Extended Data Table 1 and Supplementary Information for data description, references, and further analyses.
Extended Data Figure 4
Extended Data Figure 4. Association between cultural indicators and intrinsic honesty as measured by Mean Claim
The blue line is a linear fit. The line marked ‘JDB’ indicates the ‘Justified Dishonesty benchmark’. rho indicates Spearman rank order correlation coefficients. Mean Claim is negatively related to a. Individualism; b. Traditional vs. secular-rational values; c. Survival vs. self-expression values. See Extended Data Table 1 and Supplementary Information for data description, references, and further analyses.
Figure 1
Figure 1. Distributions of reported die rolls
Depicted are the cumulative distribution functions (CDFs) of amounts claimed compared to the CDFs of the Full Honesty, Justified Dishonesty and Full Dishonesty benchmarks. Green coloured CDFs represent subject pools (nlow = 14) from countries with a below-average Prevalence of Rule Violations (PRV; mean PRVlow = −1.69), and red coloured CDFs represent subject pools (nhigh = 9) from countries with above-average PRV (mean PRVhigh = 0.78) out of 159 countries. Inset, the average claim is shown for subjects from below average (‘low’, nlow = 1211) and above average (‘high’, nhigh = 1211) PRV countries. *** P < 0.01, two-sided t-tests; n.s. P > 0.14. JDB is the Justified Dishonesty benchmark.
Figure 2
Figure 2. Measures of honesty and the prevalence of rule violations in society
Shown are scatter plots of four measures of honesty and PRV at country level (n = 23); higher values indicate more rule violations. a, Mean Claim. b, Percent High Claims of 3, 4, and 5 MU. c, Percent Income Maximisers estimated from the fraction of people claiming 5 MU. d, Percent Fully Honest People estimated from the fraction of people claiming 0 MU. rho is the Spearman rank correlation based on country means. JDB is the Justified Dishonesty benchmark (not defined for c and d). Colour coding refers to the Quality of Institutions as measured by Constraints on Executives; shapes distinguish between countries classified as collectivist or individualist. PRV is negatively correlated with Constraints on Executives and Individualism (Supplementary Information); this also holds in our sample (Constraint on Executive: rho = −0.76, n = 23, P < 0.0001; Individualism: rho= −0.79, n = 22, P < 0.0001).

Comment in

References

    1. Trivers RL. Deceit and self-deception. Fooling yourself the better to fool others. Penguin, London: 2014.
    1. Gino F, Ayal S, Ariely D. Contagion and differentiation in unethical behavior: the effect of one bad apple on the barrel. Psychological Science. 2009;20:393. - PubMed
    1. Keizer K, Lindenberg S, Steg L. The spreading of disorder. Science. 2008;322:1681. - PubMed
    1. Hauk E, Saez-Marti M. On the cultural transmission of corruption. Journal of Economic Theory. 2002;107:311.
    1. Fischbacher U, Föllmi-Heusi F. Lies in disguise—an experimental study on cheating. Journal of the European Economic Association. 2013;11:525.

Publication types