. 2016 Mar 9;12(3):e1004802.
doi: 10.1371/journal.pcbi.1004802. eCollection 2016 Mar.

Dynamical Allocation of Cellular Resources as an Optimal Control Problem: Novel Insights into Microbial Growth Strategies

Affiliations

Dynamical Allocation of Cellular Resources as an Optimal Control Problem: Novel Insights into Microbial Growth Strategies

Nils Giordano et al. PLoS Comput Biol. .

Abstract

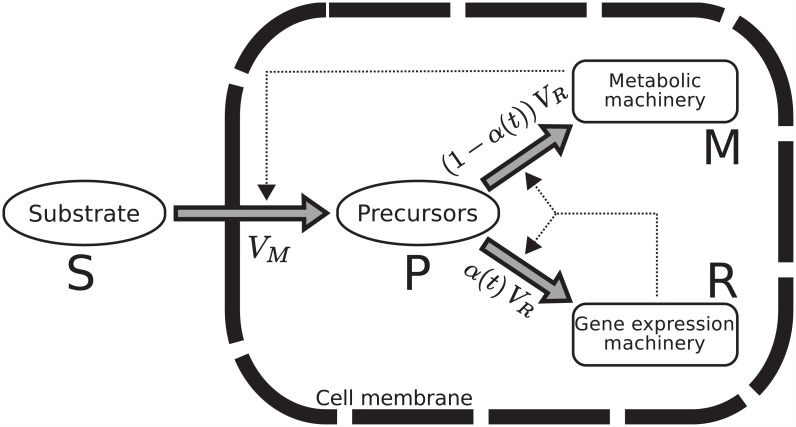
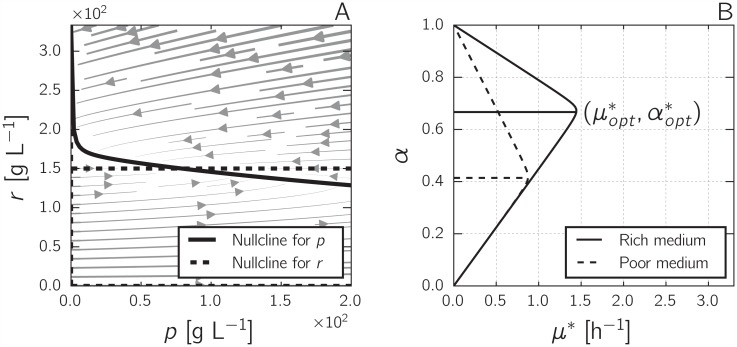
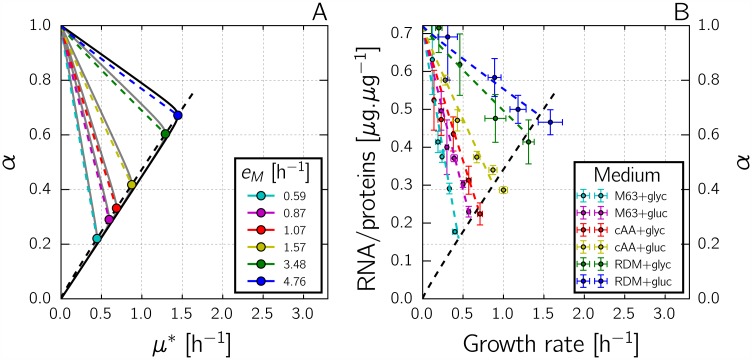
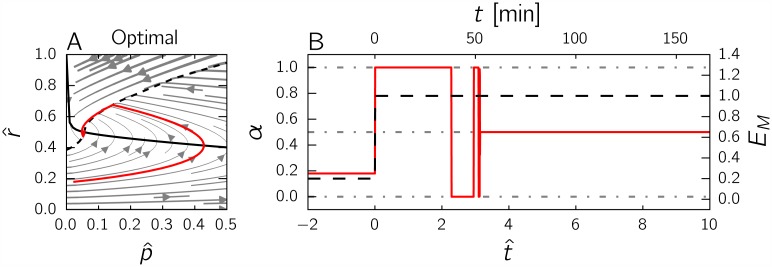
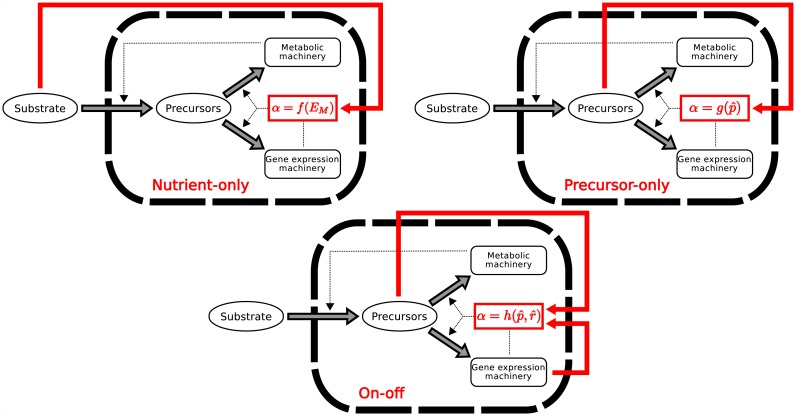
Microbial physiology exhibits growth laws that relate the macromolecular composition of the cell to the growth rate. Recent work has shown that these empirical regularities can be derived from coarse-grained models of resource allocation. While these studies focus on steady-state growth, such conditions are rarely found in natural habitats, where microorganisms are continually challenged by environmental fluctuations. The aim of this paper is to extend the study of microbial growth strategies to dynamical environments, using a self-replicator model. We formulate dynamical growth maximization as an optimal control problem that can be solved using Pontryagin's Maximum Principle. We compare this theoretical gold standard with different possible implementations of growth control in bacterial cells. We find that simple control strategies enabling growth-rate maximization at steady state are suboptimal for transitions from one growth regime to another, for example when shifting bacterial cells to a medium supporting a higher growth rate. A near-optimal control strategy in dynamical conditions is shown to require information on several, rather than a single physiological variable. Interestingly, this strategy has structural analogies with the regulation of ribosomal protein synthesis by ppGpp in the enterobacterium Escherichia coli. It involves sensing a mismatch between precursor and ribosome concentrations, as well as the adjustment of ribosome synthesis in a switch-like manner. Our results show how the capability of regulatory systems to integrate information about several physiological variables is critical for optimizing growth in a changing environment.


Conflict of interest statement

The authors have declared that no competing interests exist.

Figures

Fig 1
Fig 1. Self-replicator model of bacterial growth.
External substrates S enter the cell and are transformed into precursors P through the action of the metabolic machinery M. The precursors are used by the gene expression machinery R to make the proteins composing both the metabolic machinery (transporters, enzymes,…) and the gene expression machinery itself (RNA polymerase, ribosomes,…). α (1 − α) is the mass proportion of precursors converted into R (M). Thick arrows denote reactions and thin, dashed arrows denote catalytic activities. The rate of synthesis of precursors and the rate of synthesis of proteins from precursors are denoted by VM and VR, respectively.
Fig 2
Fig 2. Analysis of self-replicator model of bacterial growth.
A: Phase-plane analysis of the self-replicator model of Eqs 3 and 4. The nullclines for p and r are shown as solid and dashed curves, respectively. Parameter values are eM = 3.6 h-1, kR = 3.6 h-1, KR = 1 g L-1, β = 0.003 L g-1, α = 0.45. B: Dependence of the growth rate at steady state μ* on the resource allocation parameter α, for two different environmental conditions (solid line, eM = 4.76 h-1; dashed line, eM = 1.57 h-1, other parameter values are kR = 2.23 h-1, KR = 1 g L-1, and β = 0.003 L g-1). The maximal growth rate is attained for a unique α, called αopt*.
Fig 3
Fig 3. Self-replicator model accounts for bacterial growth laws.
A: Predicted quasi-linear relation between the maximal growth rate μopt* and the corresponding optimal resource allocation αopt*, for different values of eM (different colors). The colored dots indicate αopt* and μopt* for kR = 2.23 h-1 and different eM, and the dashed black line the relation for all intermediate values of eM. The dashed colored lines indicate the relation between αopt* and μopt* obtained when, for a given value of eM, the value of kR is decreased (lower kR leads to lower μopt*). The solid grey curves correspond to (μ*, α)-profiles like those shown in Fig 2B. B: Measured relation between the total RNA/protein mass ratio and the growth rate, in different growth media with different doses of a translation inhibitor (data from [12]). For each medium, indicated by a color, five different concentrations of inhibitor were used (higher dose leads to lower growth rate). Growth-medium compositions are given in the original publication and error bars represent standard deviations. The dashed black and colored lines are the same as in panel A, indicating the good quantitative correspondence between model predictions and experimental data for the chosen parameter values, obtained by fitting the model to the data points (see Methods for details).
Fig 4
Fig 4. Optimal control of the self-replicator during a nutrient upshift.
A: Optimal trajectory in the phase plane for the nondimensionalized model of Eqs 11 and 12, with streamlines. The optimal trajectory is shown as a solid, red curve. The solid, black curve represents the p^-nullcline. The dashed, black curve is the switching curve φ(p^). The optimal solution was obtained by numerical optimization using bocop [41] (see Methods for details), using the parameter values EM = 1 and K = 0.003, and starting from the initial state (0.024, 0.18) at t = 0 (optimal steady state for EM = 0.2). B: Time evolution of the control variable αopt(⋅) (thick, red line) and the environment EM (dashed, black line).
Fig 5
Fig 5. Alternative strategies for controlling the self-replicator of bacterial growth.
The feedback control strategies, shown in red and superposed on the self-replicator of Fig 1, exploit information on system variables and the environment to adjust the value of α, and thus the relative allocation of resources to the metabolic machinery and gene expression machinery.
Fig 6
Fig 6. Comparison of the performance of the nutrient-only and precursor-only strategies after a nutrient upshift.
A: Trajectory in the phase plane for the nutrient-only strategy (green curve). The solid, black curve represents the p^-nullcline. The dashed, black curve is the r^-nullcline. The solution is obtained by numerical simulation of the system of Eqs 11 and 12, supplemented with α = f(EM) as specified by Eq 27 in the Methods section and plotted in S1 Fig. The initial state corresponds to the steady state attained for an environment given by 0.2EM. While converging to the new steady state after the upshift, the precursor concentration makes a large overshoot. B: As above, but for the precursor-only strategy. The feedback control strategy is now defined by α=g(p^) as specified by Eq 28 in the Methods section and plotted in S1 Fig. The solution trajectory (blue curve) exhibits a lower overshoot. C: Evolution of the control variable α(⋅) as a function of time, for each of the above two strategies. Notice that in the nutrient-only strategy α(⋅) immediately jumps to the optimal value for the post-upshift steady state (green curve), whereas in the precursor-only strategy it depends on the (time-varying) precursor concentration (blue curve). D: Evolution of the ratio Vol/Volopt as a function of time, where Vol is the volume of the self-replicator and Volopt the volume of the same replicator following the optimal strategy shown in Fig 4. In all of the above simulations, the parameter values EM = 1 and K = 0.003 were used.
Fig 7
Fig 7. Comparison of the performance of the precursor-only and the on-off strategies after a nutrient upshift.
A: Trajectory in the phase plane for the on-off strategy (yellow curve). The solid, black curve represents the p^-nullcline and the dashed, black curve the function g. The solution is obtained by numerical simulation of the system of Eqs 11 and 12, supplemented with the equation α=h(p^,r^) defined in Eq 19 and plotted in Fig 8A. The initial state corresponds to the optimal steady state attained for an environment given by 0.2EM. B: Trajectory in the phase plane for the precursor-only strategy (same as in Fig 6B, added for comparison). C: Evolution of the control variable α for each strategy as a function of time. Both strategies stabilize the system at the optimal steady state, but only the on-off strategy (yellow curve) exhibits bang-bang behavior. D: Evolution of the ratio Vol/Volopt for the on-off and precursor-only strategies as a function of time, where Vol is the volume of the self-replicator and Volopt the volume of the same replicator following the optimal strategy shown in Fig 4. The final values of Vol/Volopt attained by the two strategies are 0.9831 and 0.9413, respectively. The on-off strategy is thus hardly distinguishable from the optimal control strategy in the plot. In all of the above simulations, the parameter values EM = 1 and K = 0.003 were used.
Fig 8
Fig 8. ppGpp regulation implements an on-off control strategy of resource allocation.
A: Response surface of the on-off control strategy, defined by α=h(p^,r^) in Eq 19. B: Response surface of the ppGpp control strategy, as defined by Eq 20 and the simplified kinetic model defining ppGpp in terms of the total amino acid concentration and the ribosomal protein fraction (S4 Text). The shape of the response surface of the ppGpp control strategy is seen to be in very good agreement with the on-off strategy leading to near-optimal performance of the self-replicator during a nutrient upshift.

References

    1. Schaechter M, Ingraham JL, Neidhardt FC. Microbe. ASM Press; 2006.
    1. Keseler IM, Mackie A, Peralta-Gil M, Santos-Zavaleta A, Gama-Castro S, Bonavides-Martínez C, et al. EcoCyc: fusing model organism databases with systems biology. Nucleic Acids Res. 2013. January;41(Database issue):D605–12. 10.1093/nar/gks1027 - DOI - PMC - PubMed
    1. Frank SA. The trade-off between rate and yield in the design of microbial metabolism. J Evol Biol. 2010. March;23(3):609–13. 10.1111/j.1420-9101.2010.01930.x - DOI - PubMed
    1. MacLean RC. The tragedy of the commons in microbial populations: insights from theoretical, comparative and experimental studies. Heredity. 2008. May;100(5):471–7. 10.1038/sj.hdy.6801073 - DOI - PubMed
    1. Schuetz R, Zamboni N, Zampieri M, Heinemann M, Sauer U. Multidimensional optimality of microbial metabolism. Science. 2012. May;336(6081):601–4. 10.1126/science.1216882 - DOI - PubMed

Publication types

MeSH terms

Substances

LinkOut - more resources